
- Moving the markets
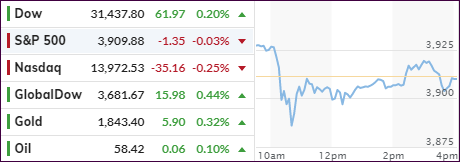
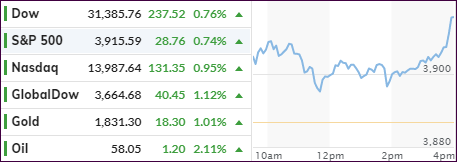
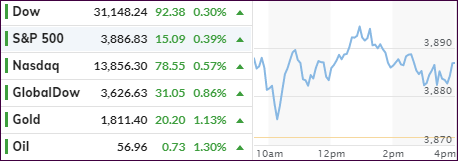
Up—down—sideways—up, and down pretty much describes the journey the major indexes took today with the result being an unchanged outcome. However, the Dow squeezed out a tiny gain of +0.20%, but that move was sufficient for the index to eke out another record closing high.
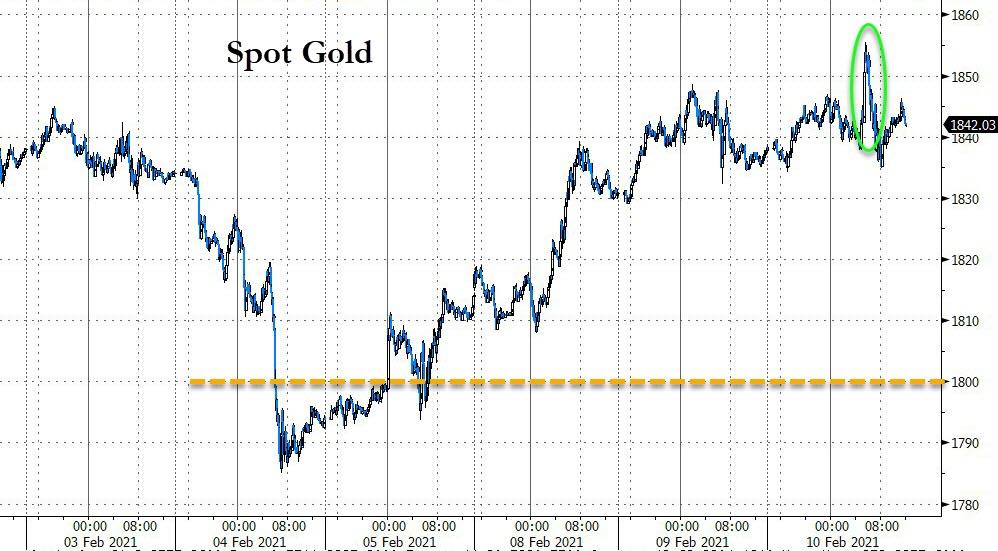
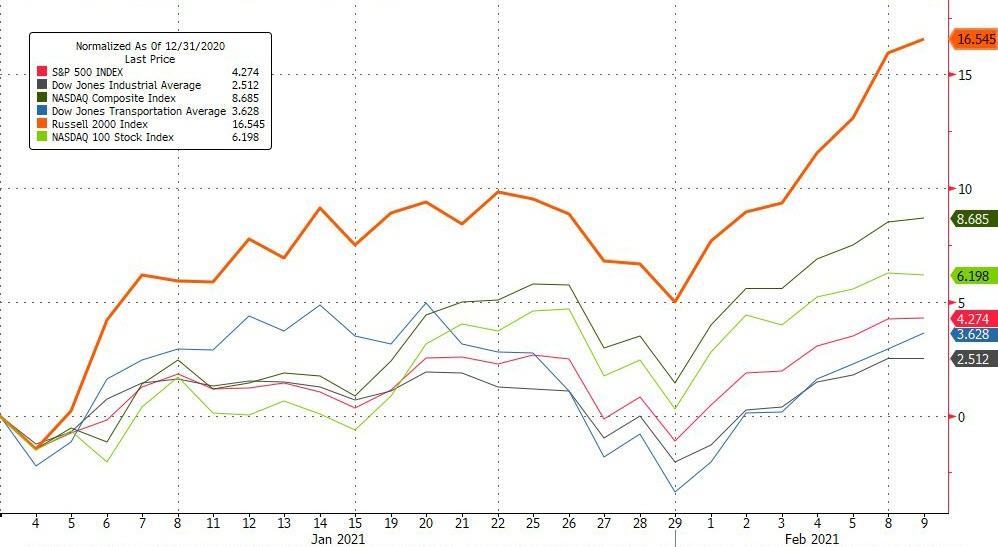
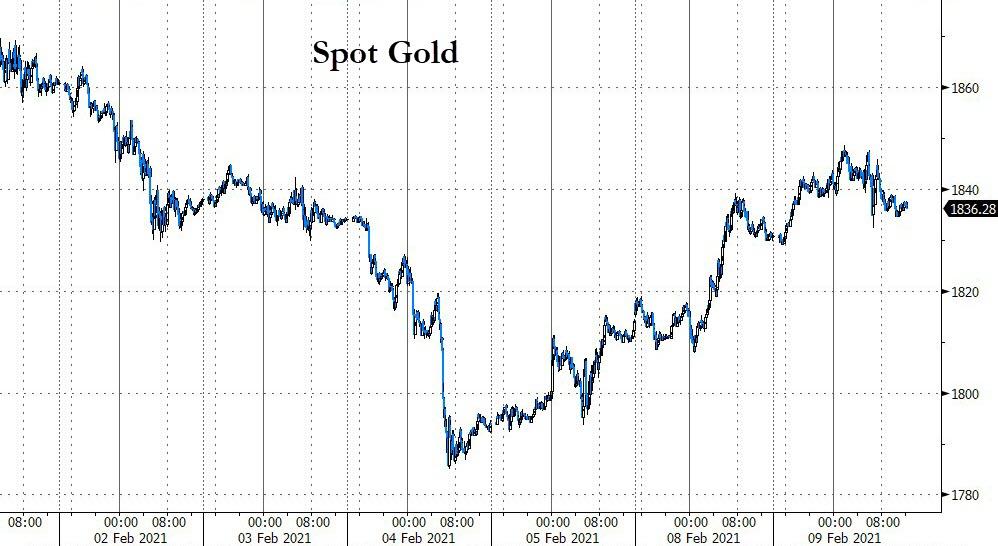
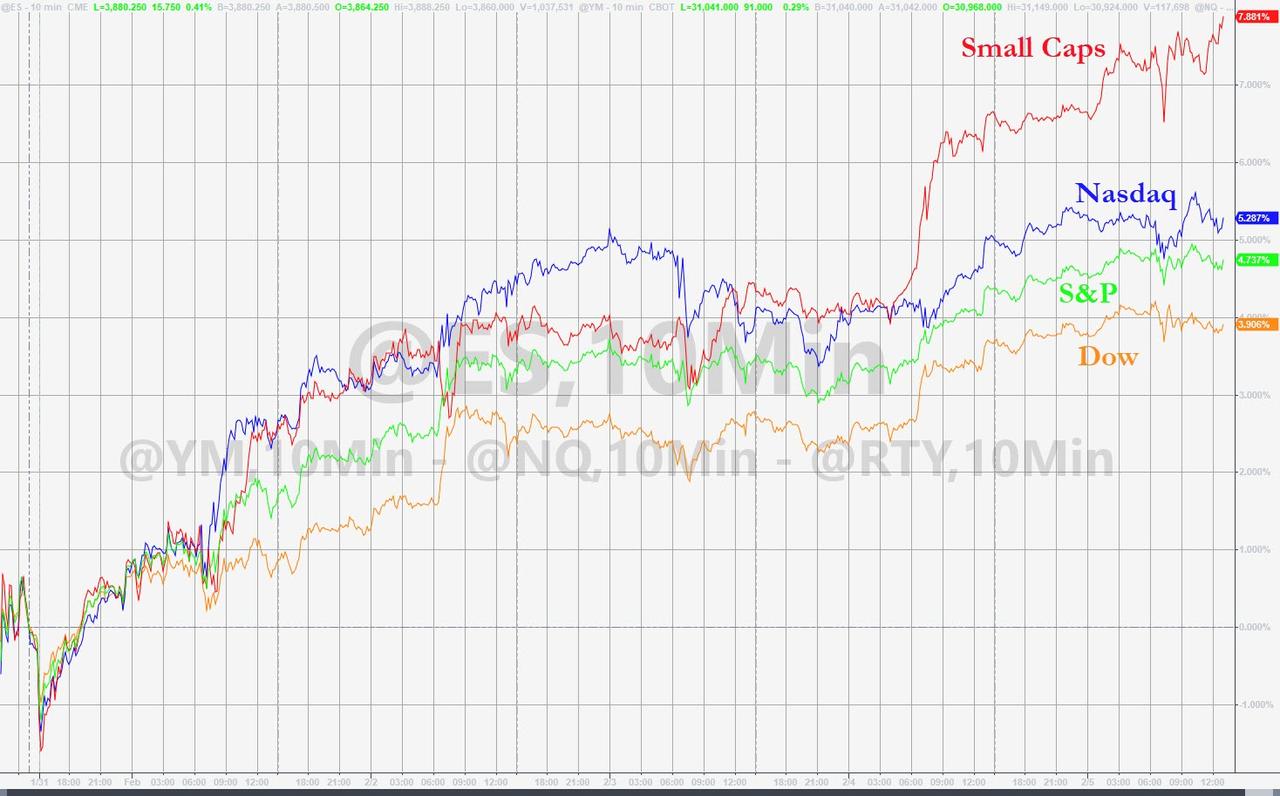
Not even SmallCaps, the winner YTD, were able to gather any momentum and ended lower by -1.07%. Saving the day to a small degree were MidCaps (IWO) with +0.16% and GLD, which again managed a green close by adding another +0.39%.
All eyes were on the outcome of a Fed speech with CNBC describing it like this:
Federal Reserve Chairman Jerome Powell said Wednesday monetary policy needs to stay “patiently accommodative” to support the economy that still faces challenges in the labor market. The employment picture is “a long way” from where it needs to be, the central bank chief told the Economic Club of New York.
Despite the past 2 days having been non-events in terms of performance, keep in mind that so far this has been a strong February with the S&P 500 having gained some 5%, mainly because of continued optimism about the massive Covid-19 stimulus package with more on deck, according to CNBC:
House Democrats unveiled the details of a relief proposal that included $1,400 direct checks with faster phase-outs than previous bills. President Joe Biden and Treasury Secretary Janet Yellen met with CEOs of JPMorgan, Walmart and Gap Tuesday to discuss additional economic relief.
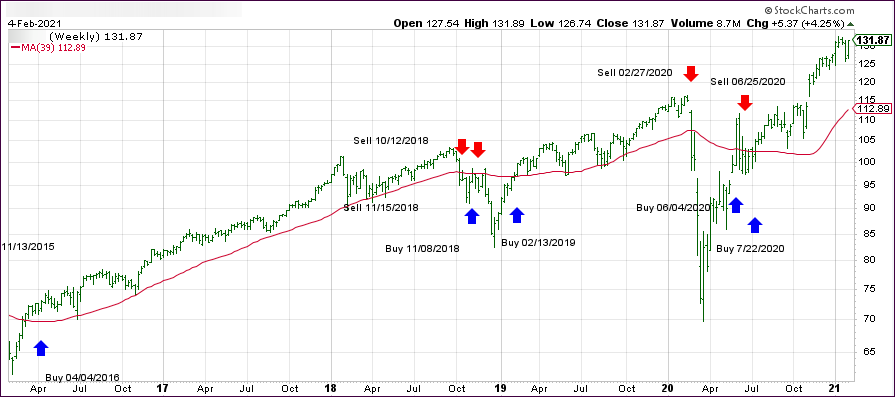
All the above, if executed as planned, will be exactly the kind of accommodation the markets are looking for and should keep equities moving higher—until the day they won’t. But that moment in time is an unknown date in the future. It also is the main reason why I continue to pounce on the importance of having an exit strategy.
Read More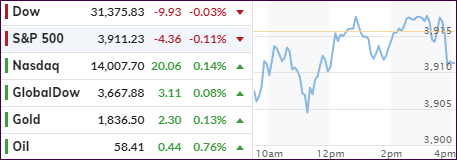
