
- Moving the markets
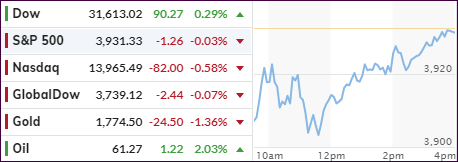
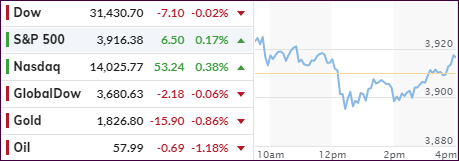
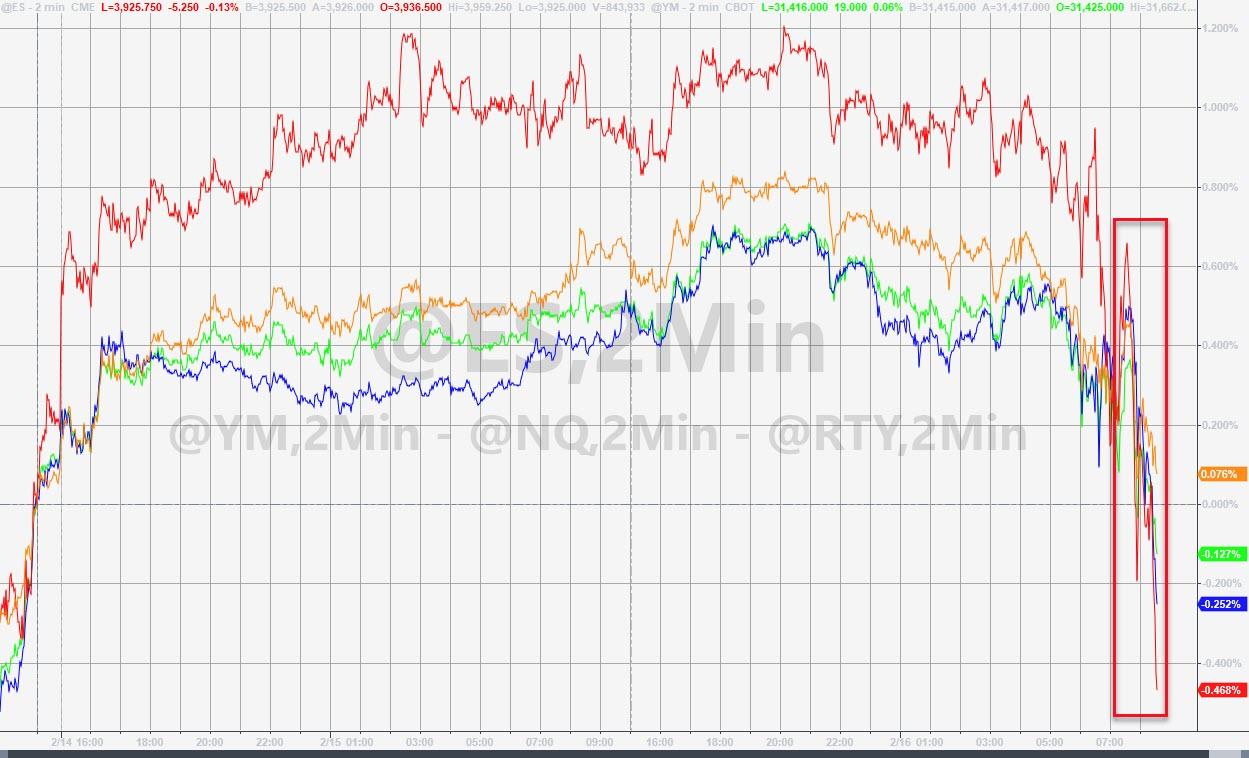
An early dump was reversed, especially by the Dow, which erased a 150-point loss and ended in the green by some 90 points, or +0.29%. The S&P 500 attempted the same magic but fell short, while the Nasdaq was the loser of the day with -0.58%, which was a major improvement from its lows of the session.
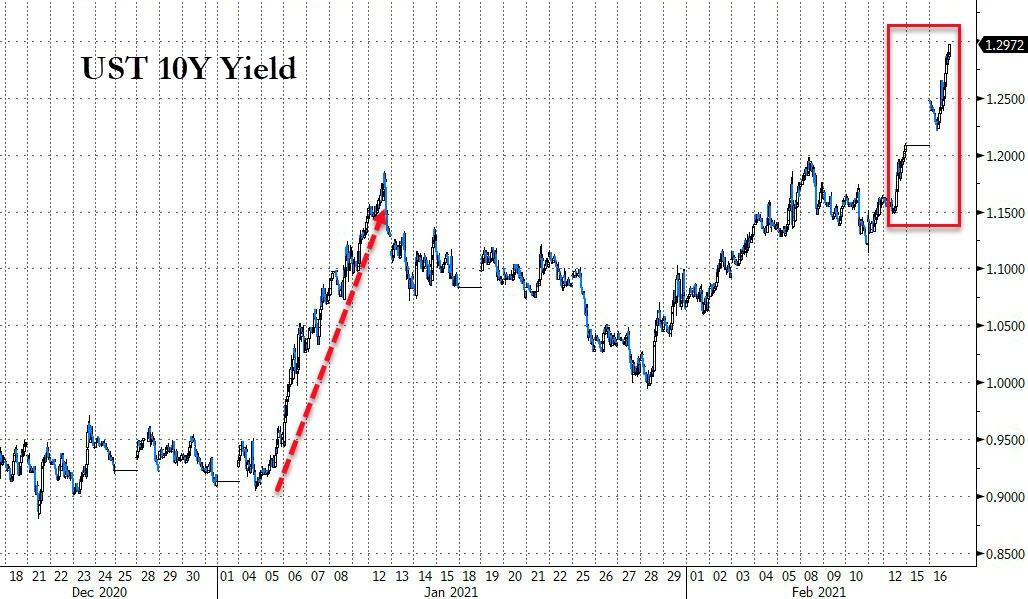
In the current non-directional environment, due to the ongoing rise in bond yields, highfliers like Small- and MidCaps are suffering the most.
Giving the markets an assist mid-day was none other than the Fed, after the release of the minutes of their last meeting suggested that easy monetary policy will remain in place for longer due to the economy being nowhere close to pre-pandemic readings.
“Participants noted that economic conditions were currently far from the Committee’s longer-run goals and that the stance for policy would need to remain accommodative until those goals were achieved,” the minutes stated.
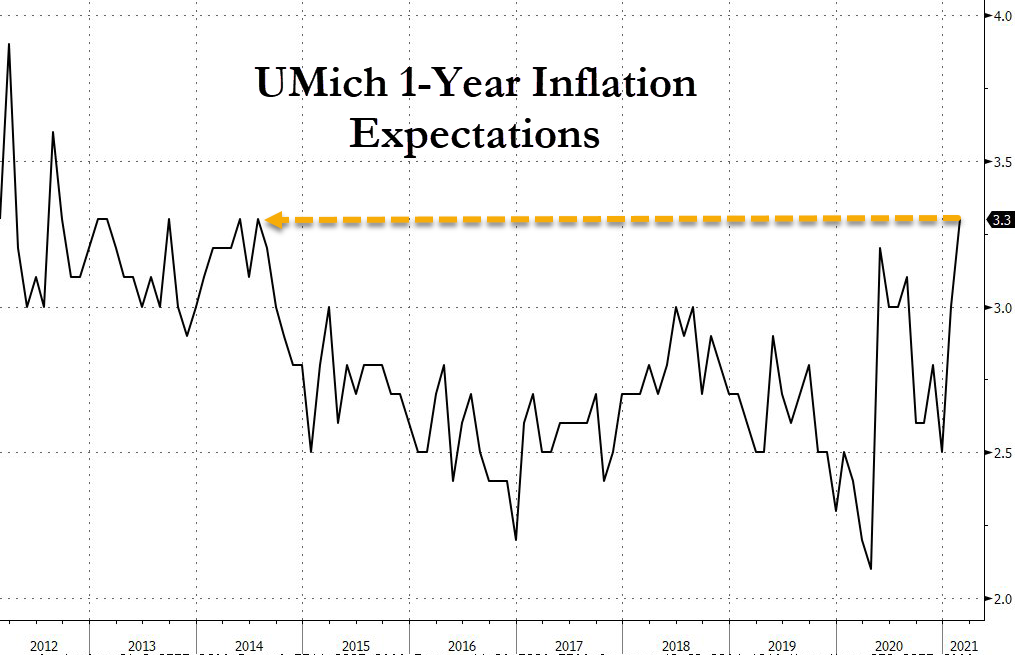
On the economic front, we saw some surprises. Retail Sales surged by +5.3% MoM in January, quite a difference from expectations of a +1.1% increase. Industrial Production turned out better than anticipated, however, the data showed it still being down almost 2% YoY.
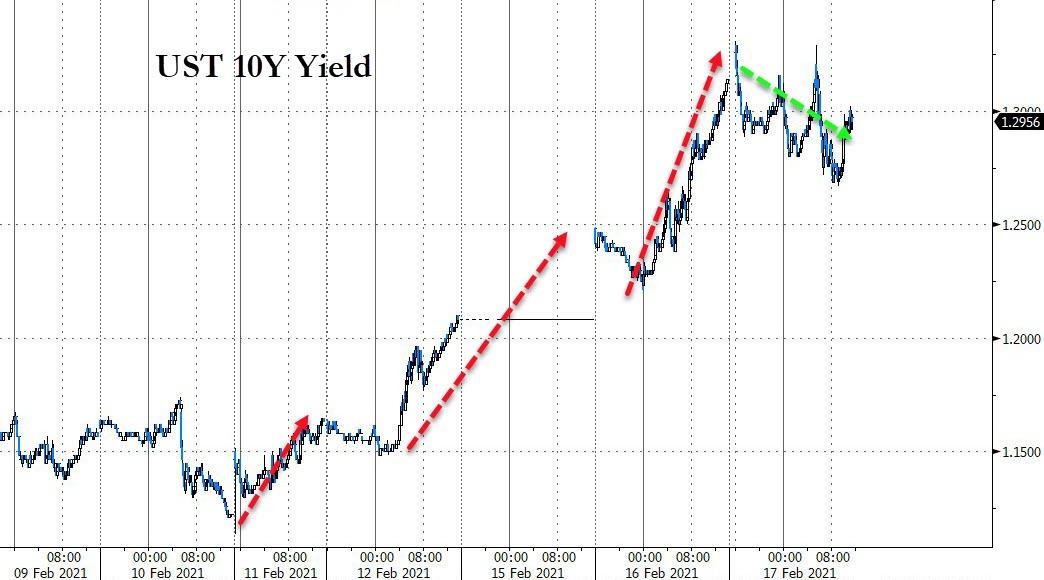
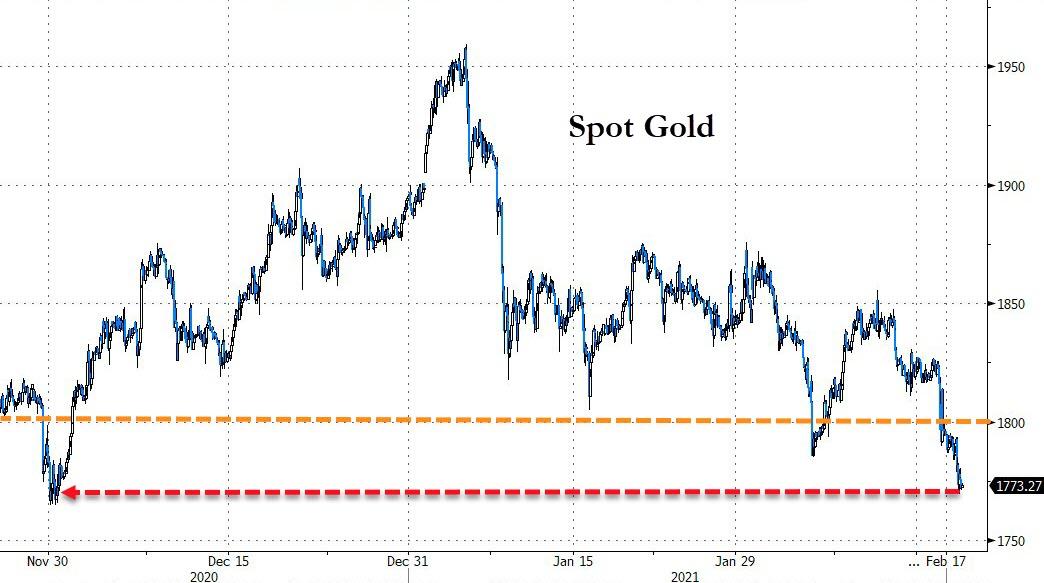
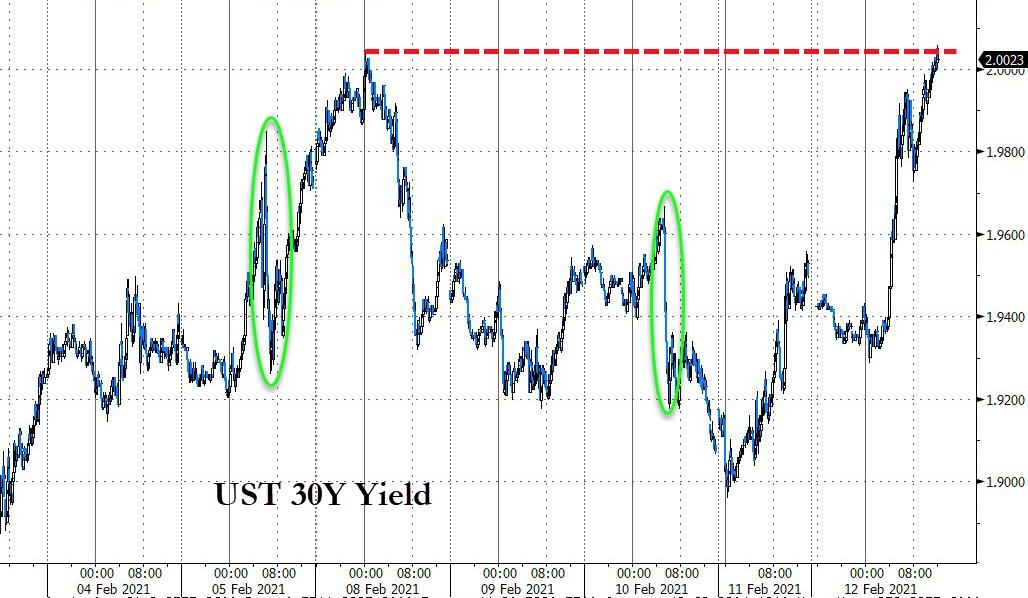
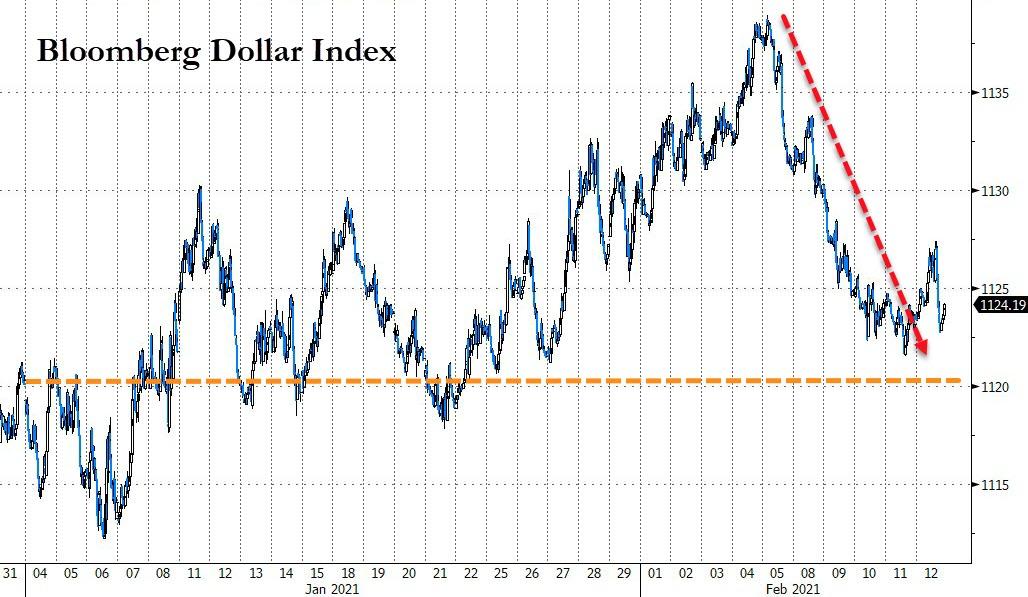
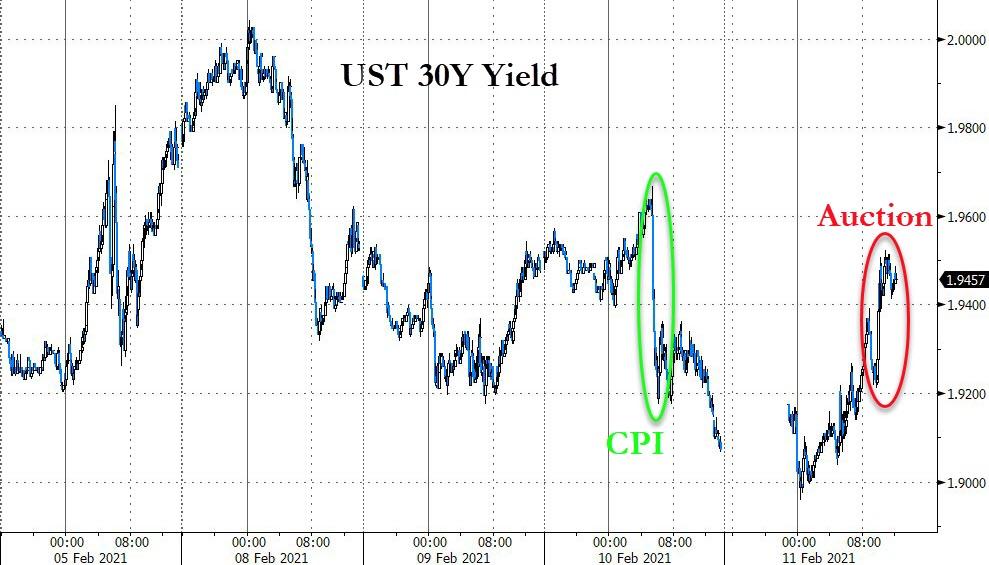
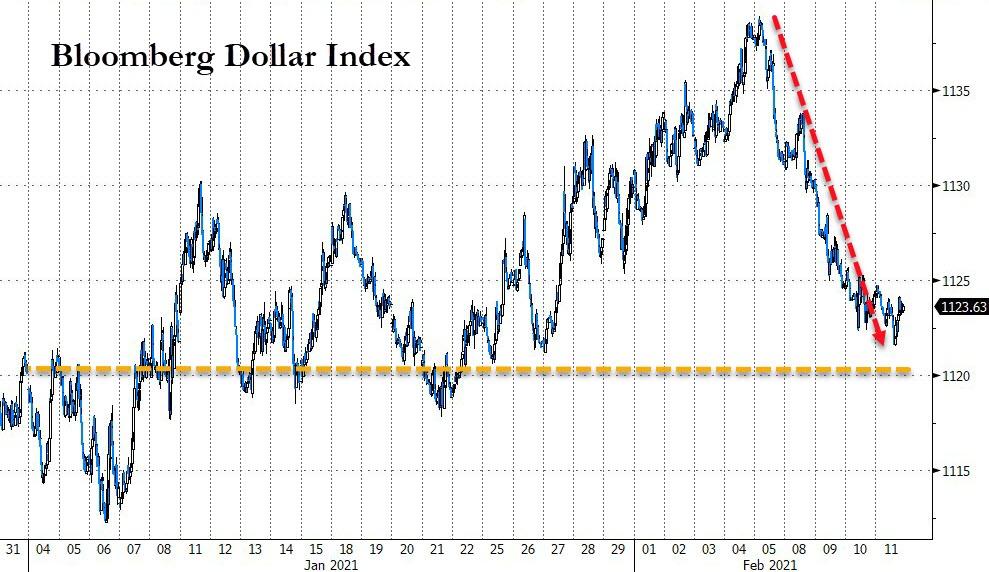
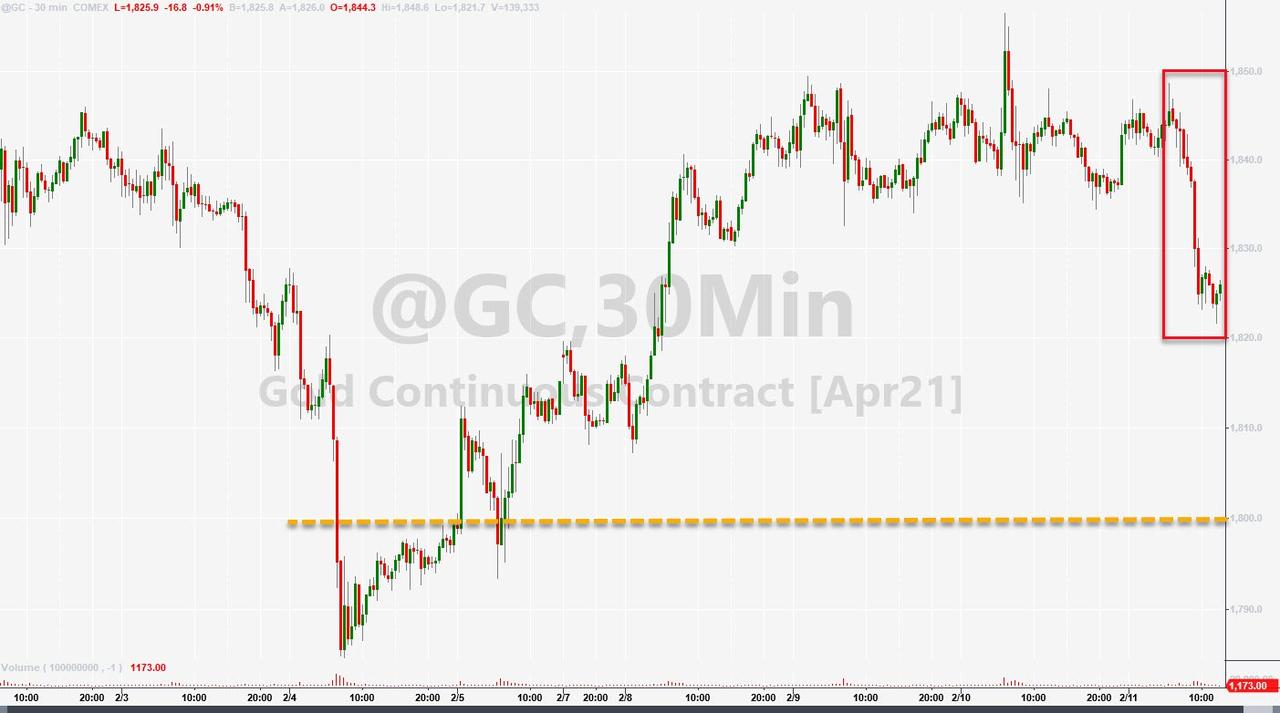
Bond yields spiked several times but lost some momentum into the close, as Bloomberg shows. As yields surged, gold and equities got dragged down with the latter finding some upward momentum late in the day. The US Dollar index built on yesterday’s gains and made sure precious metals had no chance of digging themselves out of an early hole.
As I pointed out yesterday, rising bond yields will be the biggest opposing force to keep equities in check, which is why I watch this arena very closely.
Read More
