
- Moving the markets
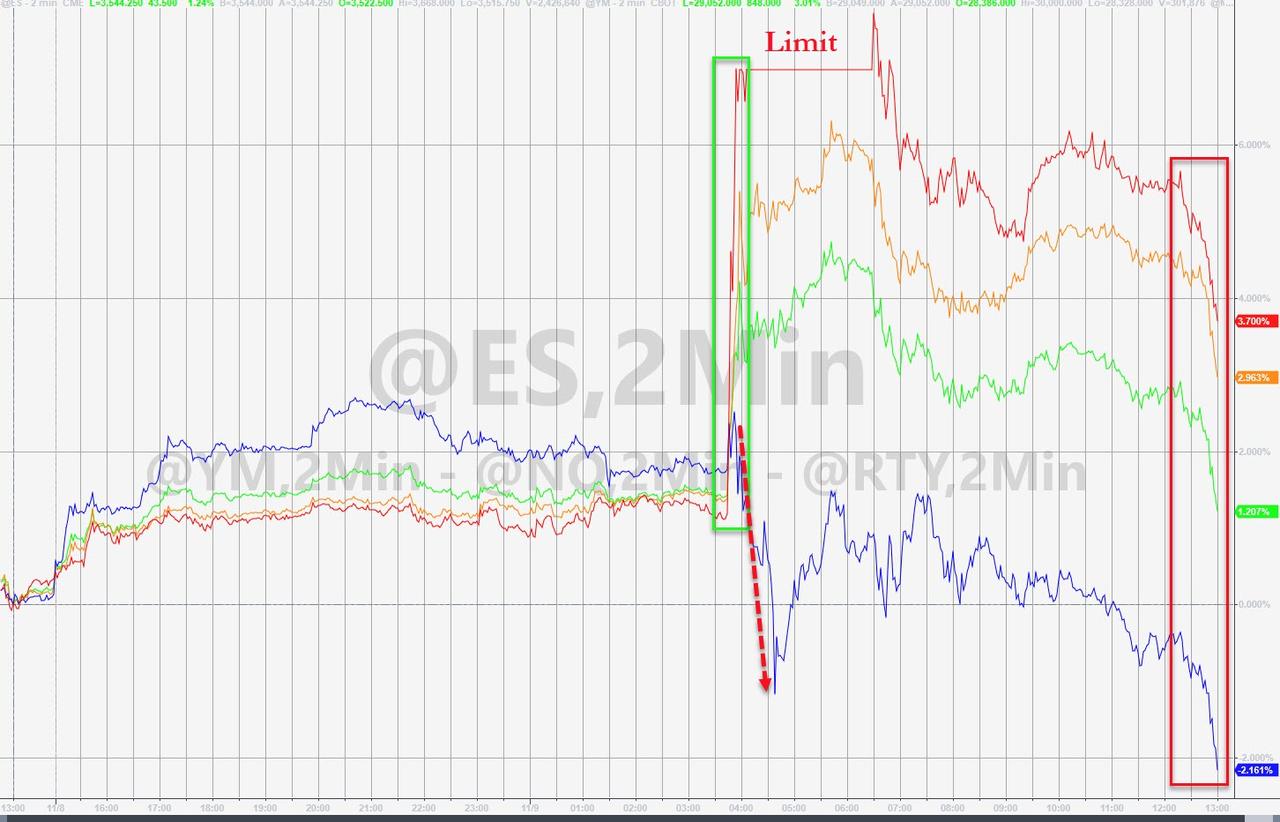
If you were looking for wild and whacky market behavior, look no further, you found it today. Not only were futures up across the board, including gold, and led by the technology sector, things reversed once the regular session opened.
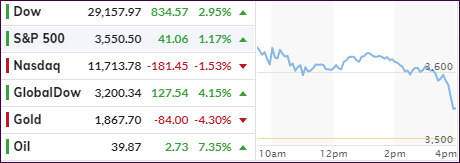
With the Dow being up some 1,500 points, and losing almost half of it by day’s end, the overnight leader, the Nasdaq, hit the skids and ended down some -1.5%. Despite a dive into the close, the Dow and S&P 500 managed to hang on to now sharply reduced gains.
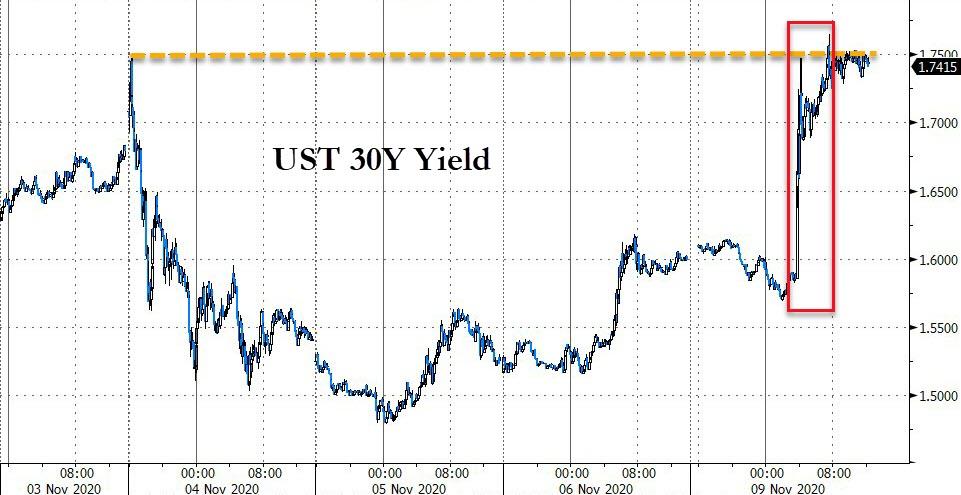
You could almost think about it as “opposite” day. Consider that some sectors (not tech) rallied in the face of sharply rising bond yields with the 10-year (not shown) now in striking distance of the 1% level. The 20-year bond ETF TLT dropped -2.23% and looked like a penny stock.
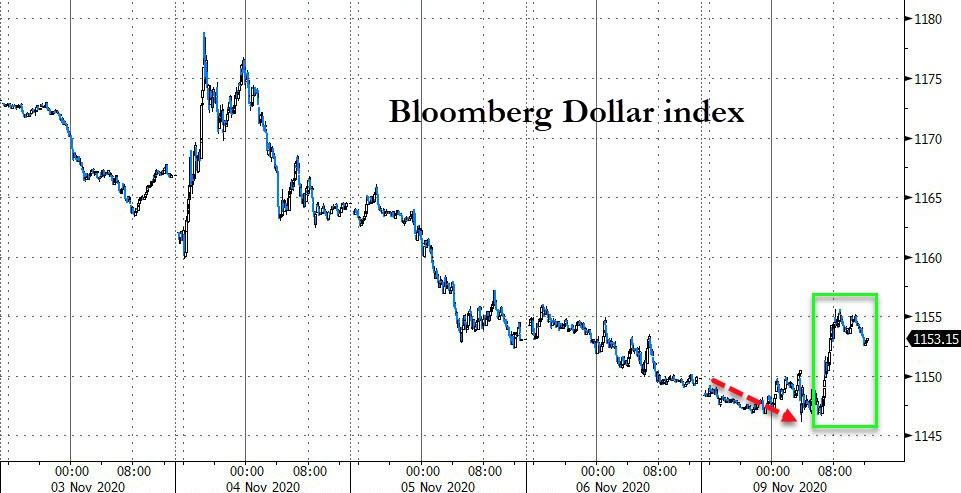
The US dollar index rallied sharply thereby pulling the rug out from gold’s recent gains and sending the precious metal back below the $1,900 level.
Causing the relentless surge in equities, in the face of rising bond yields, were indications by drug makers Pfizer and BioNTech that their Covid-19 vaccine is more than 90% effective.
Added CNBC:
The 90% effective rate from Pfizer and Germany’s BioNTech was better than what the market was expecting. Dr. Anthony Fauci, the director of the National Institute of Allergy and Infectious Diseases, has said that a vaccine that was 50% to 60% effective would be acceptable.
Of course, hope suddenly reigns supreme about getting the old life back, at some point in the future, returning to normal, people going back outside, the economy reopening, and masks being ditched.
Who knows what the reality will look like and if the above drug maker announcements really have merit?
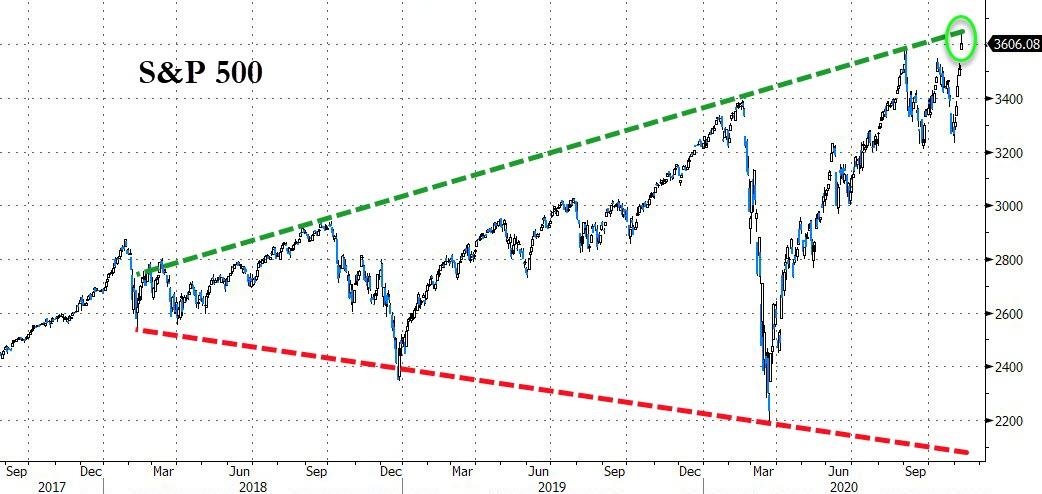
Technically speaking, it will now be interesting to see what happens to the S&P 500, which has reached the top end of its wide megaphone pattern, as Bloomberg demonstrates in this chart. Breakout or retracement, that is the big question.
2. ETFs in the Spotlight
In case you missed the announcement and description of this section, you can read it here again.
It features some of the 10 broadly diversified domestic and sector ETFs from my HighVolume list as posted every Saturday. Furthermore, they are screened for the lowest MaxDD% number meaning they have been showing better resistance to temporary sell offs than all others over the past year.
The below table simply demonstrates the magnitude with which these ETFs are fluctuating above or below their respective individual trend lines (%+/-M/A). A break below, represented by a negative number, shows weakness, while a break above, represented by a positive percentage, shows strength.
For hundreds of ETF choices, be sure to reference Thursday’s StatSheet.
For this current domestic “Buy” cycle, here’s how some our candidates have fared:
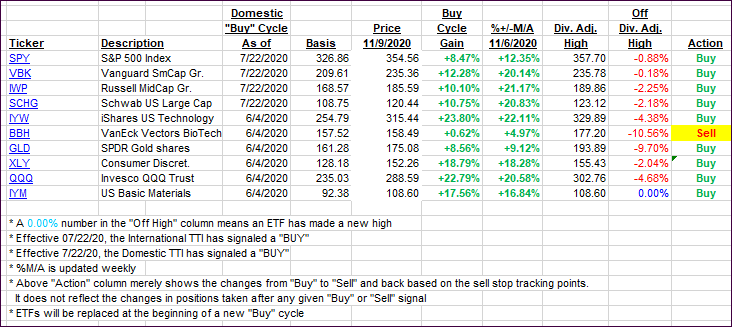
Click image to enlarge
Again, the %+/-M/A column above shows the position of the various ETFs in relation to their respective long-term trend lines, while the trailing sell stops are being tracked in the “Off High” column. The “Action” column will signal a “Sell” once the -8% point has been taken out in the “Off High” column. For more volatile sector ETFs, the trigger point is -10%.
3. Trend Tracking Indexes (TTIs)
Our TTIs surged, despite the tech breakdown, with the Domestic one gapping higher and closing in record territory.
This is how we closed 11/09/2020:
Domestic TTI: +16.38% above its M/A (prior close +11.59%)—Buy signal effective 07/22/2020
International TTI: +12.43% above its M/A (prior close +7.96%)—Buy signal effective 07/22/2020
Disclosure: I am obliged to inform you that I, as well as my advisory clients, own some of the ETFs listed in the above table. Furthermore, they do not represent a specific investment recommendation for you, they merely show which ETFs from the universe I track are falling within the specified guidelines.
Contact Ulli