
- Moving the markets
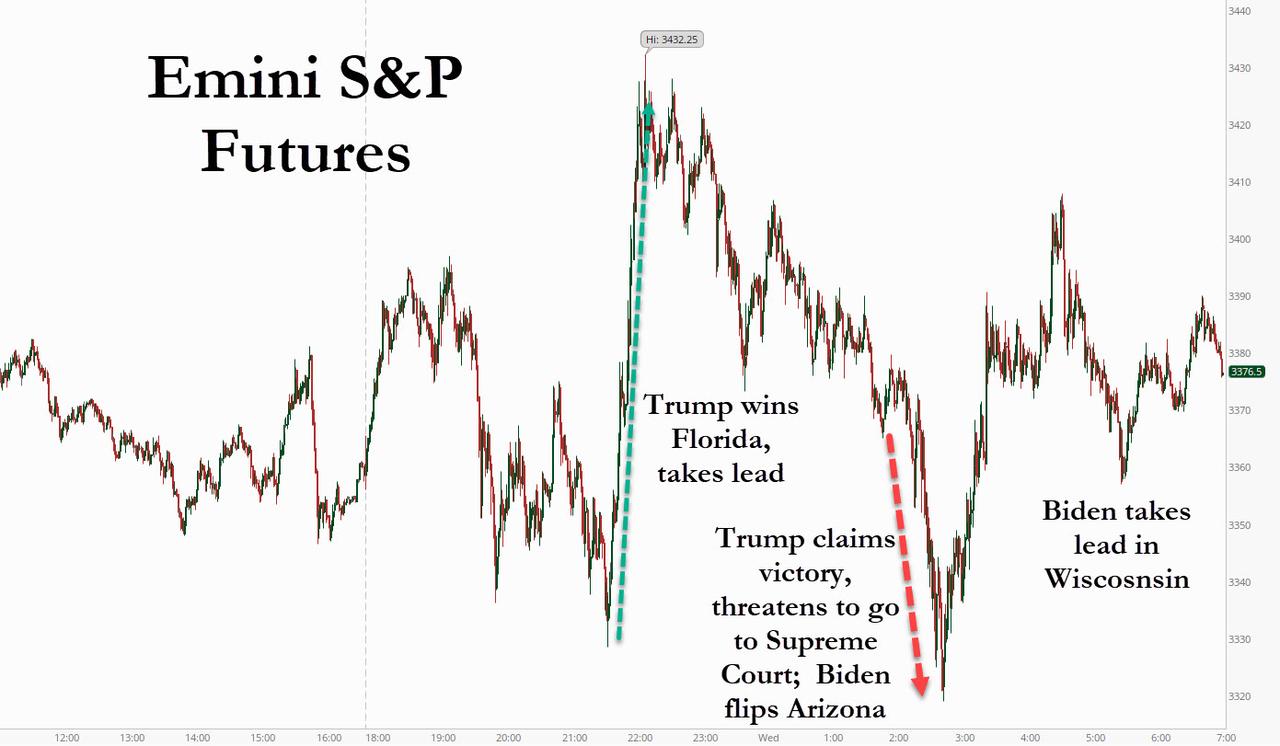
The future markets engaged in a wild roller coaster ride, as election odds shifted from one contender to the other and back. As expected, no winner was declared with skepticism over the outcome remaining, but there appeared to be no doubt that the Senate would remain in Republican hands, which crushed hopes for a Blue Wave.
“I think the big news for the markets right now at least as it looks preliminary is that there’s not going to be a blue wave, which is generally supportive for markets,” said Mike Lewis, managing director of U.S. equity cash trading at Barclays, on CNBC’s “Squawk Box.” “I think that the outlook going forward for markets is this is going to be more about policy and the Fed than it’s going to be about politics, which is a good thing for markets.”
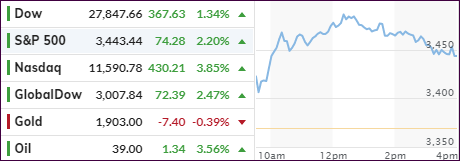
None of that early volatility was present during regular session, as the bullish theme prevailed, despite the White House race heading into extra innings. Equites went straight up with the Nasdaq reaching its daily limit causing the exchange to pause for a few minutes. I took advantage during a lull to increase our equity exposure in the tech sector, which had been beaten up more than any other during the October debacle.
In the meantime, both contenders exchanged verbal blows as to who had won the election, adding again to uncertainty, however, the markets were not affected by the rhetoric.
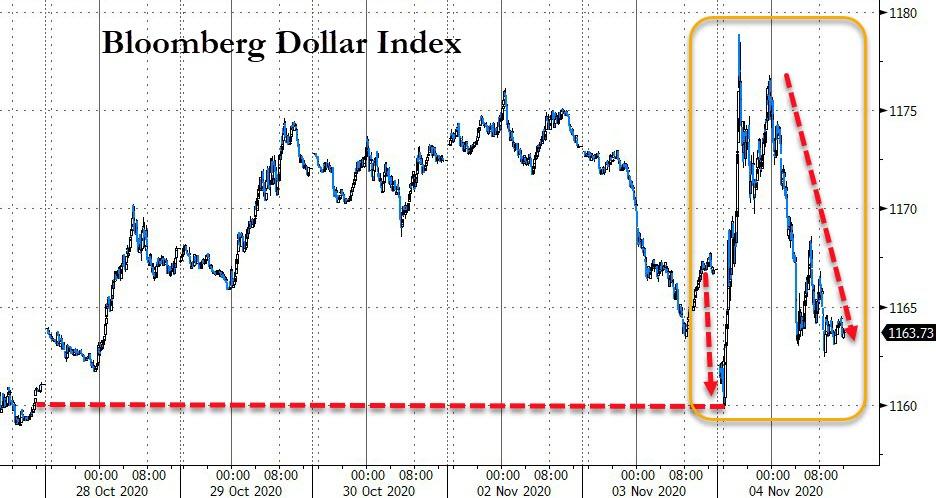
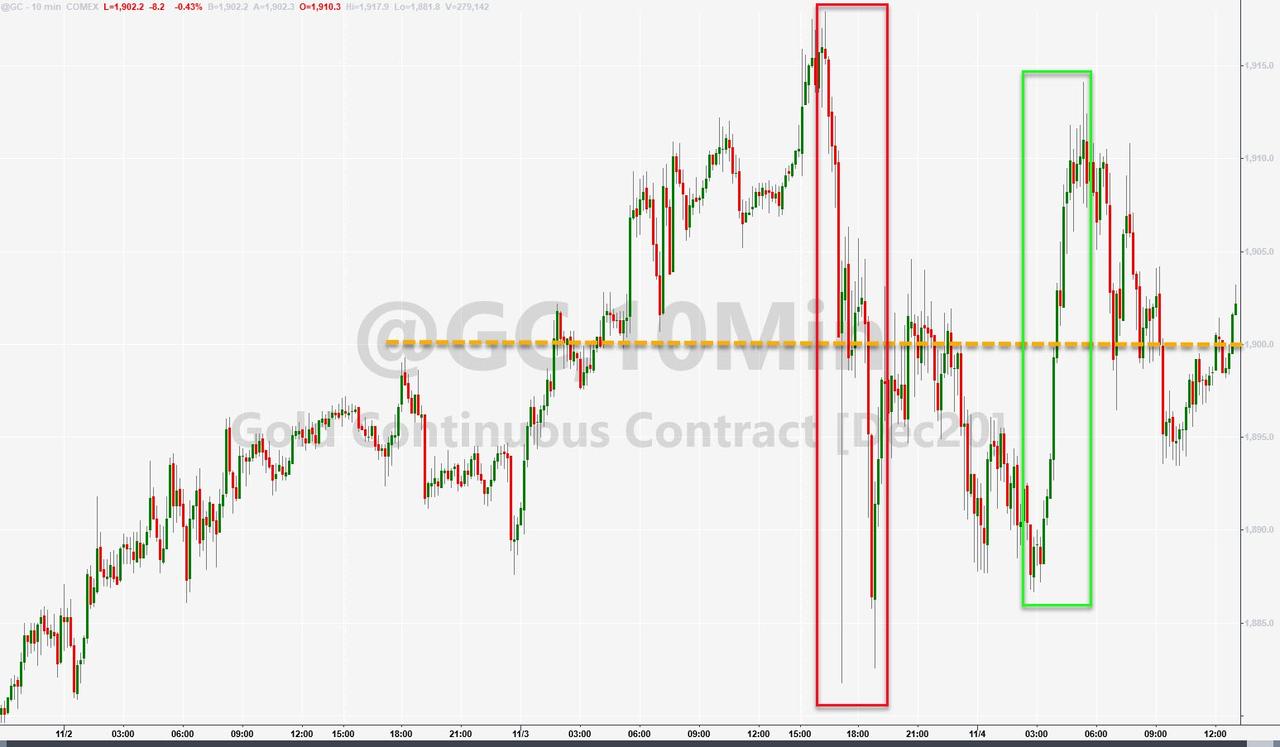
Wild swings were seen in many areas, such as the US Dollar, 30-year bond yields, as well as gold, which managed to crawl back above $1,900 after an extremely volatile 12 hour period.
Even professional traders were flabbergasted as to where this market might go, causing ZH to publish this spot-on headline:
“Frazzled Traders Turn To Booze, Tear Up The Script And Just Buy Everything”
That pretty much sums up today’s sentiment. With no WH election decision on the horizon, who knows what’s in store for tomorrow.
2. ETFs in the Spotlight
In case you missed the announcement and description of this section, you can read it here again.
It features some of the 10 broadly diversified domestic and sector ETFs from my HighVolume list as posted every Saturday. Furthermore, they are screened for the lowest MaxDD% number meaning they have been showing better resistance to temporary sell offs than all others over the past year.
The below table simply demonstrates the magnitude with which these ETFs are fluctuating above or below their respective individual trend lines (%+/-M/A). A break below, represented by a negative number, shows weakness, while a break above, represented by a positive percentage, shows strength.
For hundreds of ETF choices, be sure to reference Thursday’s StatSheet.
For this current domestic “Buy” cycle, here’s how some our candidates have fared:
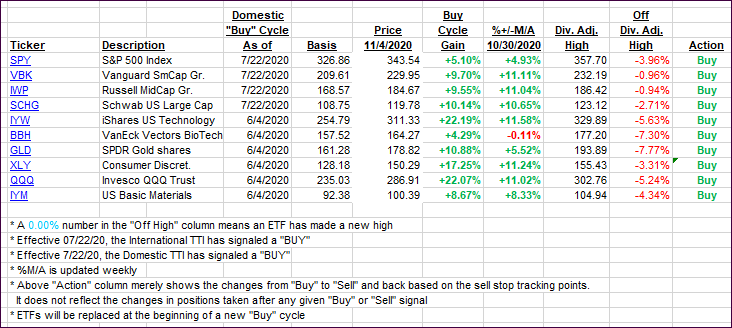
Click image to enlarge
Again, the %+/-M/A column above shows the position of the various ETFs in relation to their respective long-term trend lines, while the trailing sell stops are being tracked in the “Off High” column. The “Action” column will signal a “Sell” once the -8% point has been taken out in the “Off High” column. For more volatile sector ETFs, the trigger point is -10%.
3. Trend Tracking Indexes (TTIs)
Our TTIs edged up only a tad, as the rally was primarily tech based.
This is how we closed 11/04/2020:
Domestic TTI: +9.91% above its M/A (prior close +9.82%)—Buy signal effective 07/22/2020
International TTI: +5.50% above its M/A (prior close +4.86%)—Buy signal effective 07/22/2020
Disclosure: I am obliged to inform you that I, as well as my advisory clients, own some of the ETFs listed in the above table. Furthermore, they do not represent a specific investment recommendation for you, they merely show which ETFs from the universe I track are falling within the specified guidelines.
Contact Ulli