
ETF Tracker StatSheet
You can view the latest version here.
ENDING A STRONG WEEK WITH A WHIMPER
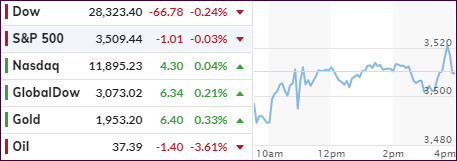
- Moving the markets
For sure, markets can’t go up in a straight line and momentum will slow down eventually. That was the case today when, after 4 days of solid gains, the major indexes ran out of steam and closed flat for the session. Still, despite an undecided election, we saw one of the best weeks since April in terms of performance.
Traders were looking for clarity in the election dilemma but found none, however, the positive mood was sustained due to better-than-expected US unemployment data, which may have stopped a potential sell-off from materializing.
The BLS reported that the economy added a stronger than expected 638k jobs in October, a little less than last month, but a “beat” of the 593k anticipated number. However, private job additions were boosted to a strong 908k. The surprise came via the tumbling unemployment figure, which dropped from 7.9% to 6.9%, far below the 7.6% expected.
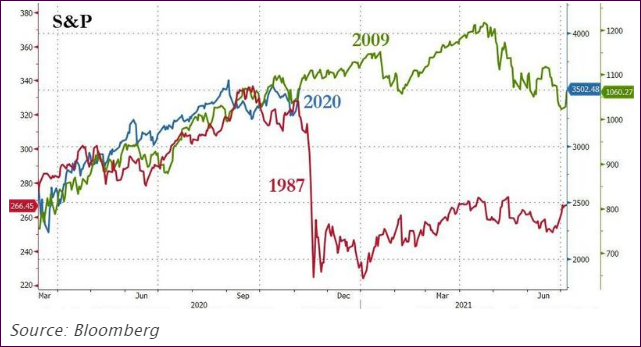
Despite the continuing election uncertainties, the S&P 500 notched its best performance in an election week since 1932, as this chart shows:
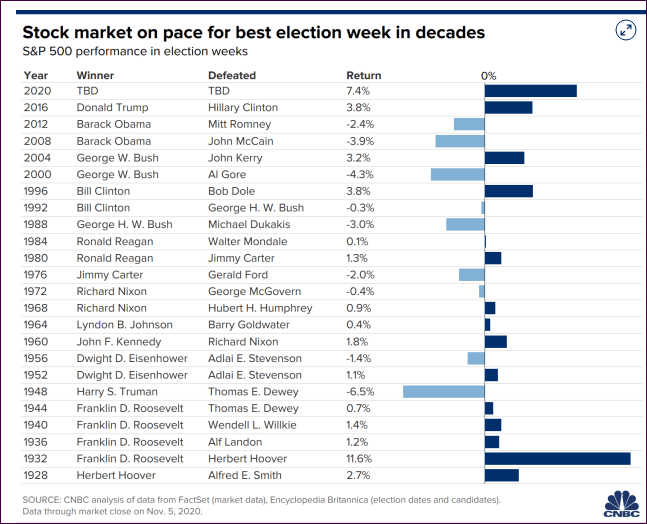
Again, it appears that traders are getting relaxed and accepting the possibility of a divided government, which translates into political gridlock with the good thing being no significant changes on tax policy.
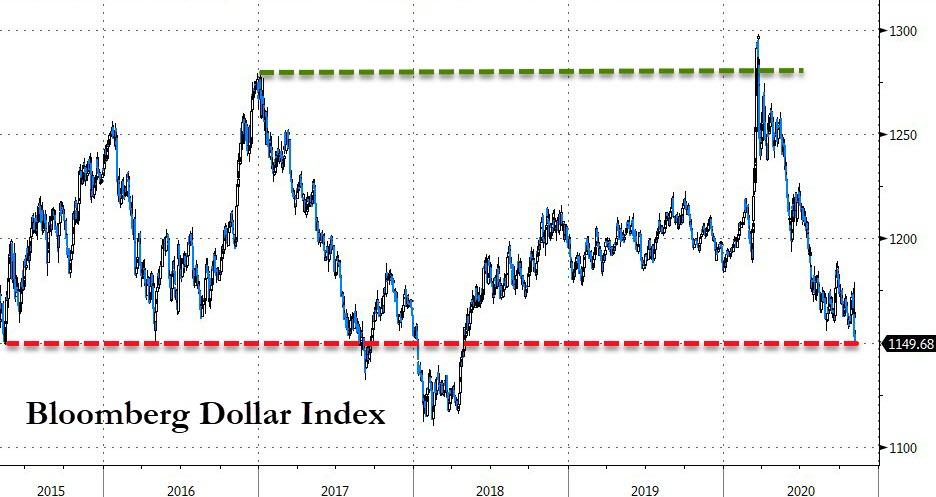
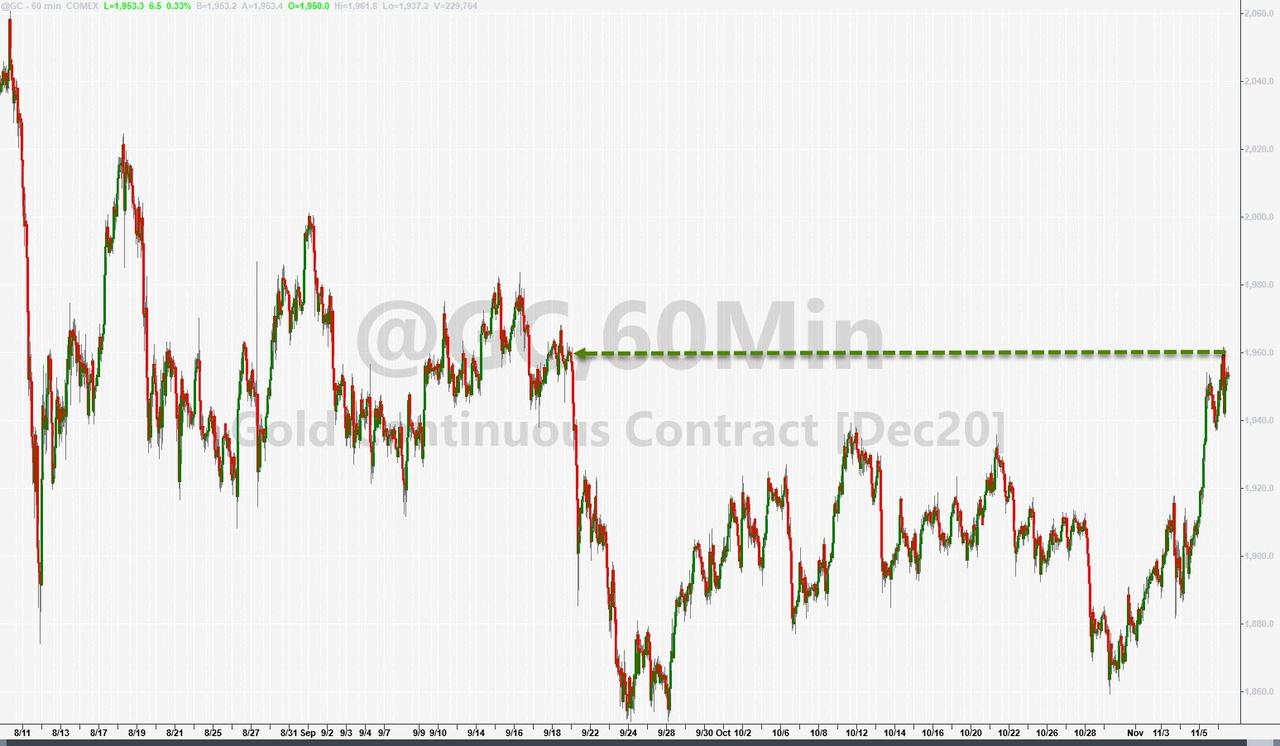
The US dollar’s demise continued with the currency crashing to its lowest level since May 2018, which helped gold to reclaim its recently lost $1,950 level.
Here’s some food for thought for you, presented by ZH:
And finally, what happens next? 1987 or 2009?
2. ETFs in the Spotlight
In case you missed the announcement and description of this section, you can read it here again.
It features some of the 10 broadly diversified domestic and sector ETFs from my HighVolume list as posted every Saturday. Furthermore, they are screened for the lowest MaxDD% number meaning they have been showing better resistance to temporary sell offs than all others over the past year.
The below table simply demonstrates the magnitude with which these ETFs are fluctuating above or below their respective individual trend lines (%+/-M/A). A break below, represented by a negative number, shows weakness, while a break above, represented by a positive percentage, shows strength.
For hundreds of ETF choices, be sure to reference Thursday’s StatSheet.
For this current domestic “Buy” cycle, here’s how some our candidates have fared:
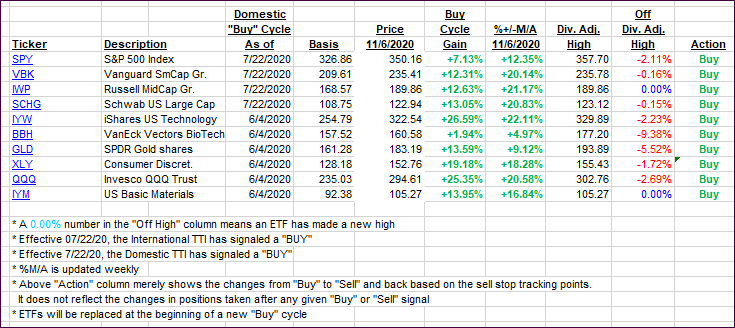
Click image to enlarge
Again, the %+/-M/A column above shows the position of the various ETFs in relation to their respective long-term trend lines, while the trailing sell stops are being tracked in the “Off High” column. The “Action” column will signal a “Sell” once the -8% point has been taken out in the “Off High” column. For more volatile sector ETFs, the trigger point is -10%.
3. Trend Tracking Indexes (TTIs)
Our TTIs changed immaterially with the markets pausing after this week’s ramp.
This is how we closed 11/06/2020:
Domestic TTI: +11.59% above its M/A (prior close +12.04%)—Buy signal effective 07/22/2020
International TTI: +7.96% above its M/A (prior close +7.62%)—Buy signal effective 07/22/2020
Disclosure: I am obliged to inform you that I, as well as my advisory clients, own some of the ETFs listed in the above table. Furthermore, they do not represent a specific investment recommendation for you, they merely show which ETFs from the universe I track are falling within the specified guidelines.
———————————————————-
WOULD YOU LIKE TO HAVE YOUR INVESTMENTS PROFESSIONALLY MANAGED?
Do you have the time to follow our investment plans yourself? If you are a busy professional who would like to have his portfolio managed using our methodology, please contact me directly or get more details here.
———————————————————
Back issues of the ETF Tracker are available on the web.
Contact Ulli