
- Moving the markets
The “buy everything” mantra continued today extending the election week rally on beliefs that the current dilemma might result in a divided government, with the powers of the president/congress being offset by the opposing party controlling the senate.
The bullish reaction to the results so far “may have been due to the fact that Republicans appear likely to retain a majority in the Senate, something that will make it hard for Biden to proceed with the tax increases and stricter regulations he promised,” said Charalambos Pissouros, senior market analyst at JFD Group, in a note.
Even though analysts had originally claimed that a “blue wave” sweep of the White House and the congress was being priced in the market, when, suddenly the possibility of a split government seemed “market pleasing” giving power to the bullish cause.
Despite the WH outcome far from being certain, traders are confident that much of the election uncertainty has passed, and the worst possible outcomes seem to have been avoided. At least for the moment, this viewpoint prevails, yet it could change in a hurry.
ZH added this succinct spot-on tweet:
A disputed election is bad for stocks
Legislative gridlock is bad for stocks.
But the combination of the two is great for stocks
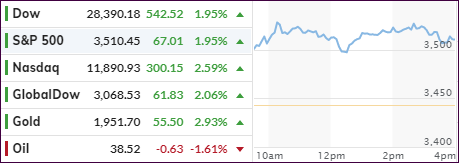
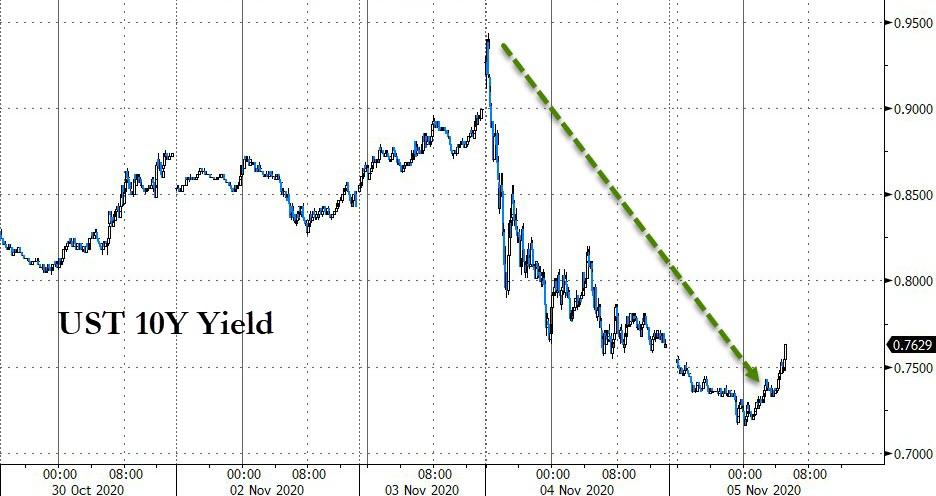
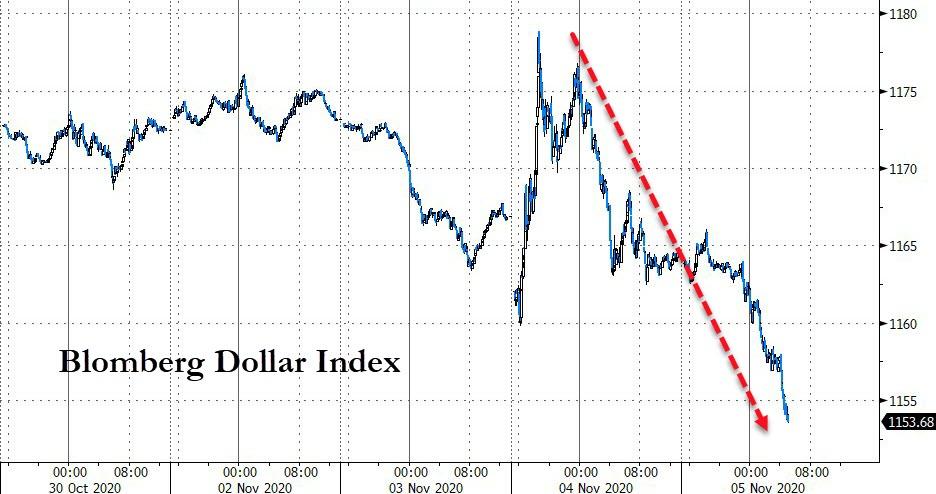
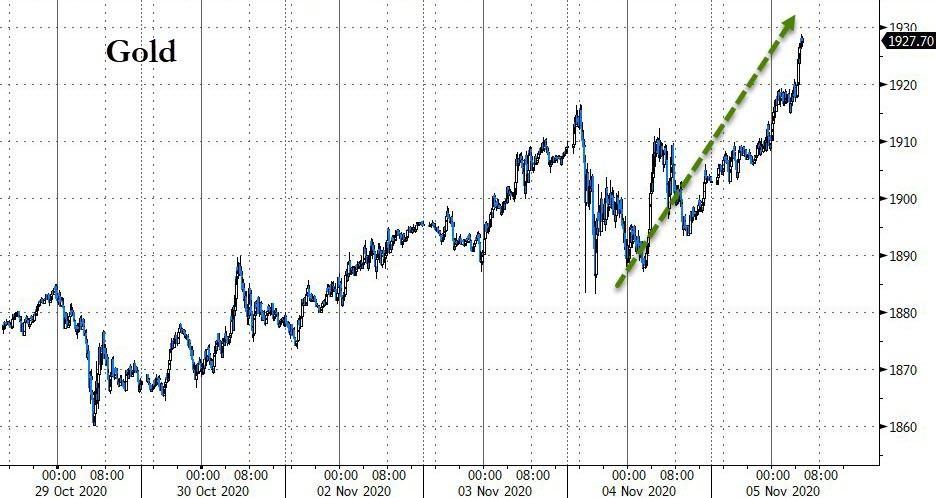
In the end, stocks soared led by the Nasdaq, bond yields tanked, and the US dollar got clobbered. The combination of lower bond yields and a declining dollar was like pouring fuel on the fire for gold, which ripped higher with spot gold actually outperforming the major indexes for the session.
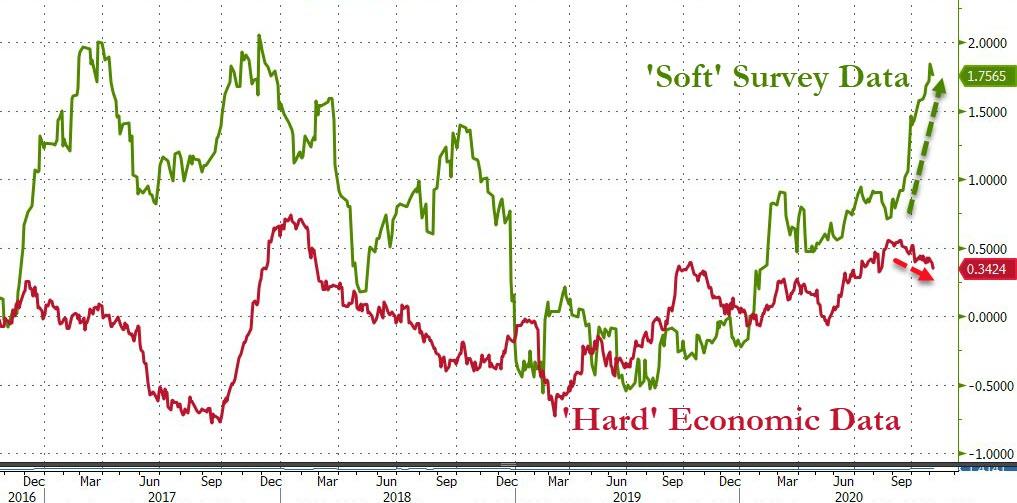
Of course, as great as this rally feels, we must be aware that much is hype and not based on economic fundamentals, as this separation of “soft” vs. “hard” survey data shows. Additionally, the SMART money is not participating at all, and has not since August, which is demonstrated in this chart.
That’s why our exit strategy will always be an ever-present component of our Trend Tracking strategy.
2. ETFs in the Spotlight
In case you missed the announcement and description of this section, you can read it here again.
It features some of the 10 broadly diversified domestic and sector ETFs from my HighVolume list as posted every Saturday. Furthermore, they are screened for the lowest MaxDD% number meaning they have been showing better resistance to temporary sell offs than all others over the past year.
The below table simply demonstrates the magnitude with which these ETFs are fluctuating above or below their respective individual trend lines (%+/-M/A). A break below, represented by a negative number, shows weakness, while a break above, represented by a positive percentage, shows strength.
For hundreds of ETF choices, be sure to reference Thursday’s StatSheet.
For this current domestic “Buy” cycle, here’s how some our candidates have fared:
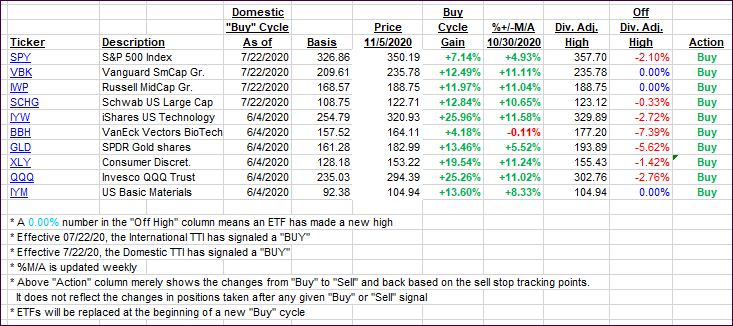
Click image to enlarge
Again, the %+/-M/A column above shows the position of the various ETFs in relation to their respective long-term trend lines, while the trailing sell stops are being tracked in the “Off High” column. The “Action” column will signal a “Sell” once the -8% point has been taken out in the “Off High” column. For more volatile sector ETFs, the trigger point is -10%.
3. Trend Tracking Indexes (TTIs)
Our TTIs jumped with today’s rally being broad-based.
This is how we closed 11/05/2020:
Domestic TTI: +12.04% above its M/A (prior close +9.91%)—Buy signal effective 07/22/2020
International TTI: +7.62% above its M/A (prior close +5.50%)—Buy signal effective 07/22/2020
Disclosure: I am obliged to inform you that I, as well as my advisory clients, own some of the ETFs listed in the above table. Furthermore, they do not represent a specific investment recommendation for you, they merely show which ETFs from the universe I track are falling within the specified guidelines.
Contact Ulli