Below, please find the latest High-Volume ETF Cutline report, which shows how far above or below their respective long-term trend lines (39-week SMA) my currently tracked ETFs are positioned.
This report covers the HV ETF Master List from Thursday’s StatSheet and includes 312 High Volume ETFs, defined as those with an average daily volume of more than $5 million, of which currently 243 (last week 243) are hovering in bullish territory. The yellow line separates those ETFs that are positioned above their trend line (%M/A) from those that have dropped below it.
In case you are not familiar with some of the terminology used in the reports, please read the Glossary of Terms. If you missed the original post about the Cutline approach, you can read it here.
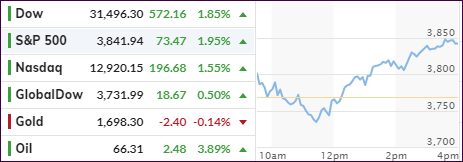
Another wild ride in the markets turned out to be positive, after an early pump was followed by a huge dump, which then formed the base to be a springboard for the ramp into the close.
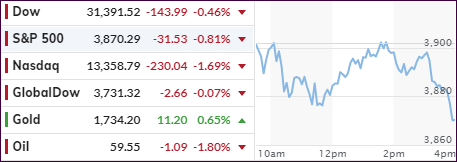
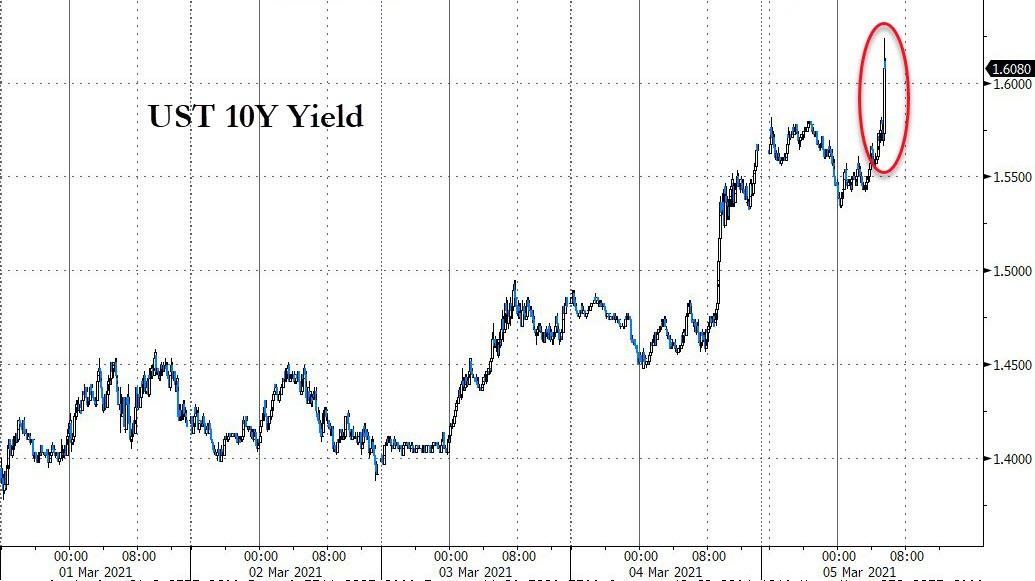
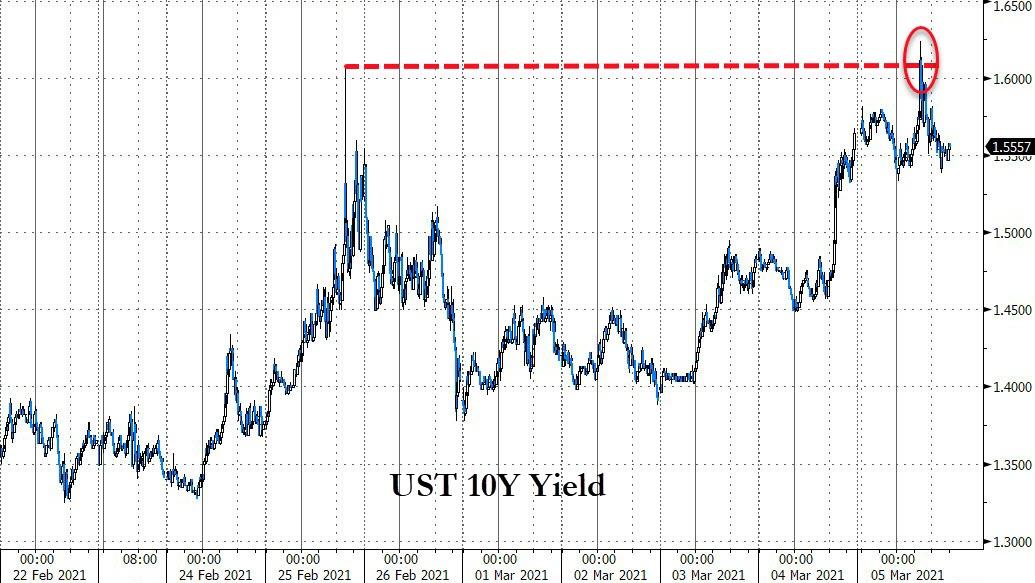
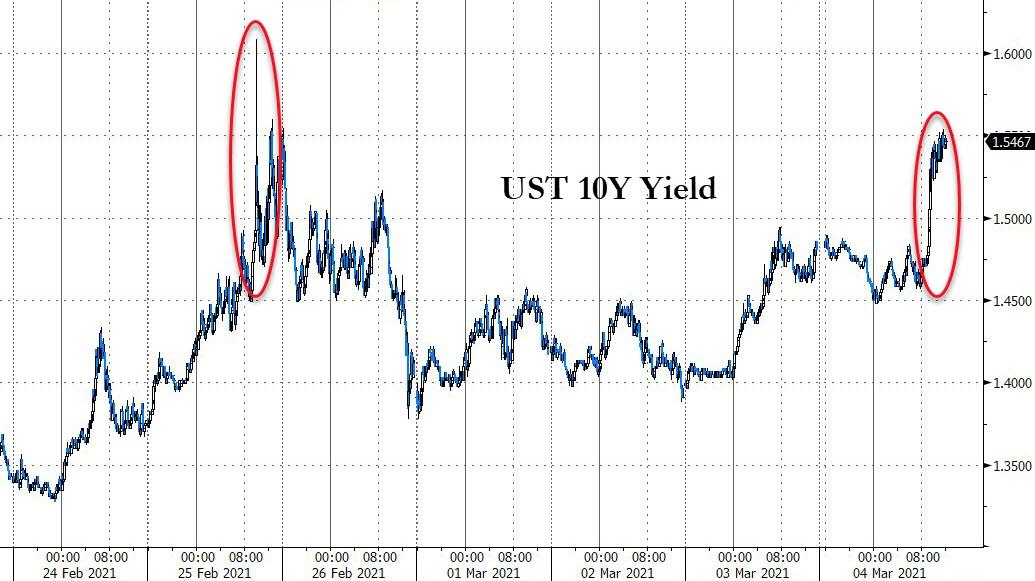
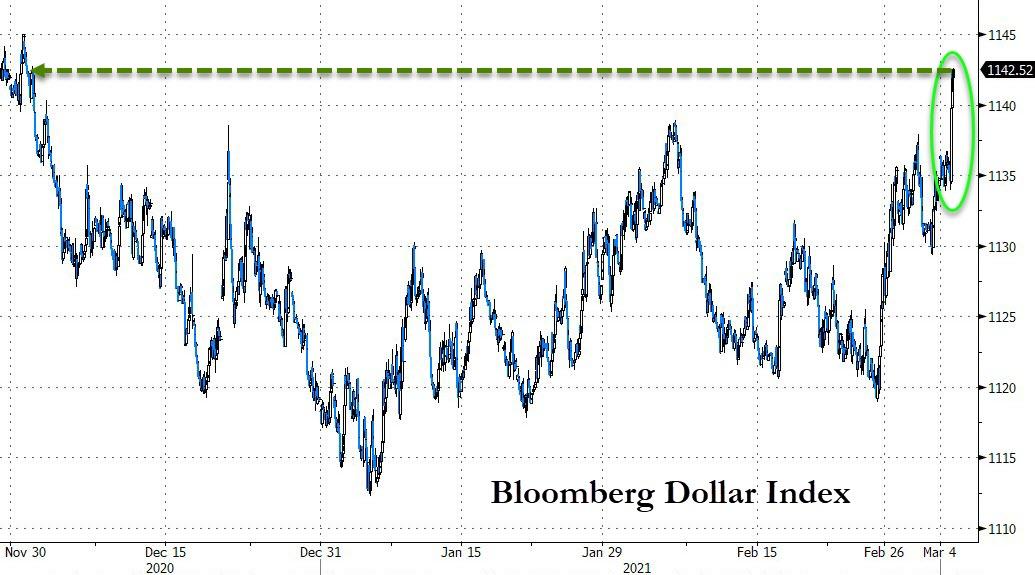
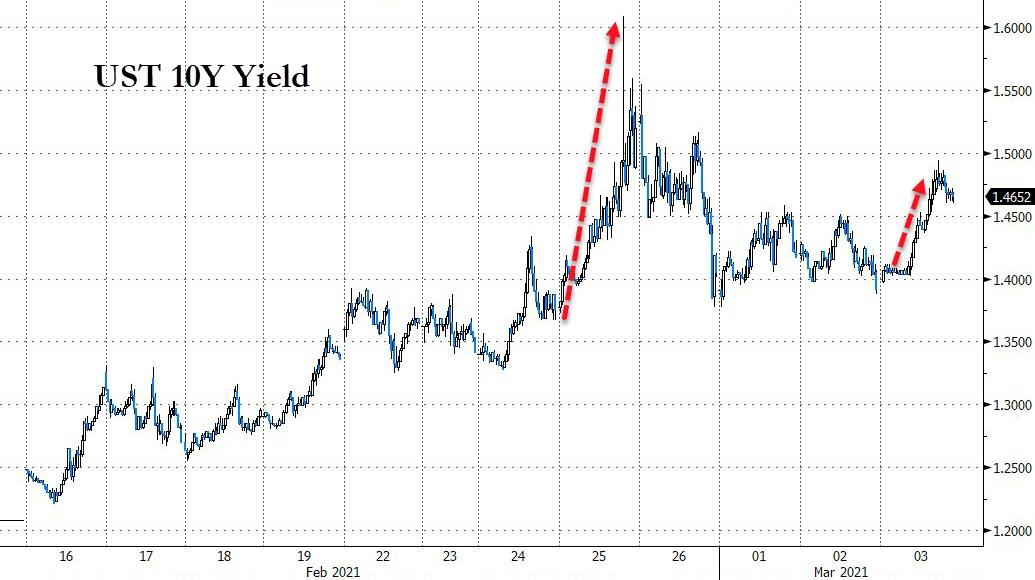
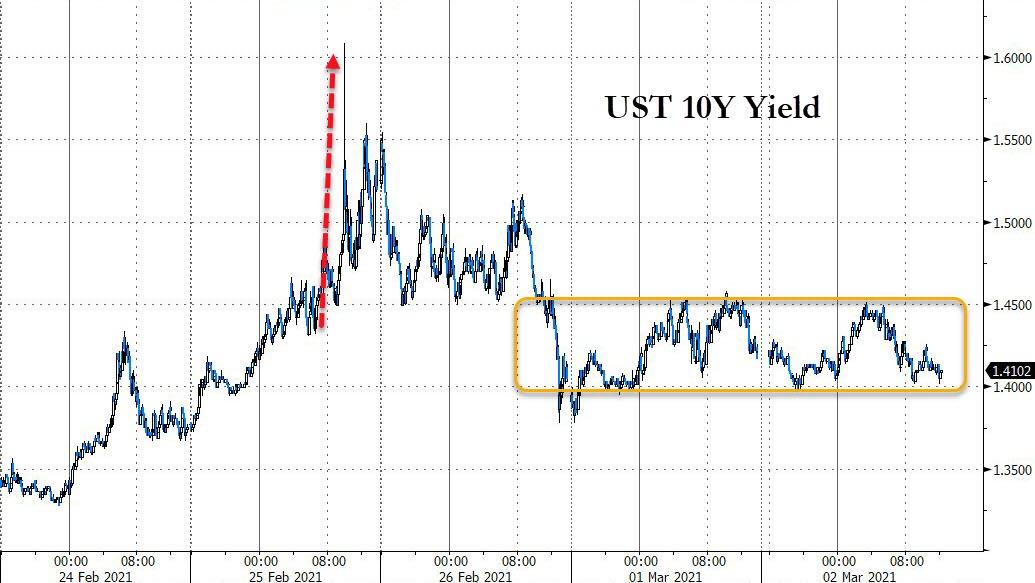
The early slam was the result of a better-than-expected improvement in the labor markets with the unemployment rate dipping to 6.2% and payrolls gaining 379k (good news), which is not what traders wanted to see. This news sent bond yields surging, with the 10-year spiking above the 1.60% level.
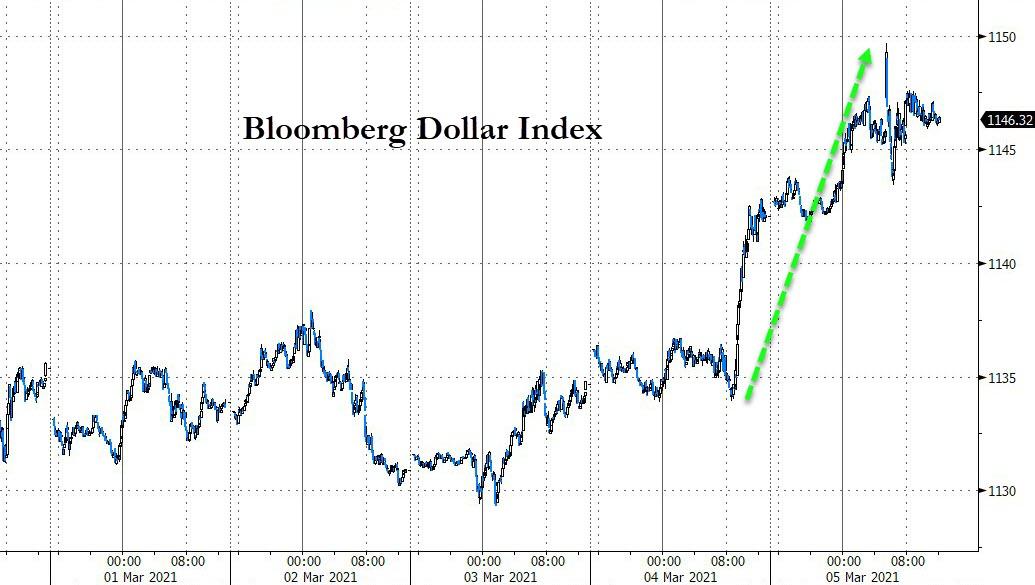
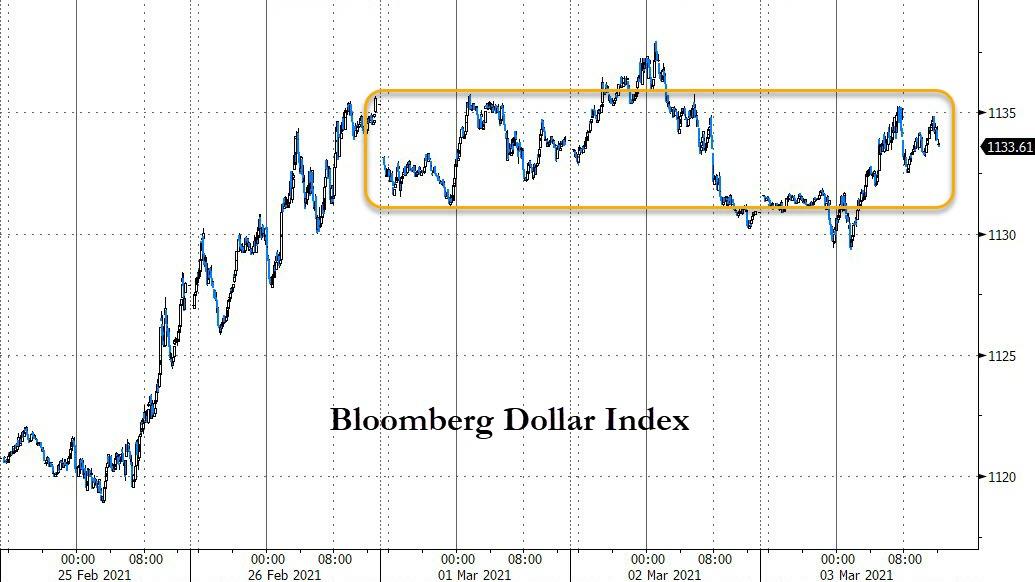
That in turn sent the US Dollar index sharply higher and triggered massive selling in stocks with the Nasdaq leading the way to the downside. One of our more volatile holdings, which had triggered its trailing sell stop yesterday, was liquidated, and will be replaced next week.
Our newly added SmallCap value ETF performed exceptionally well by adding +2.76%, thereby outperforming its “growth” cousin by a wide margin.
Easing bond yields around mid-session, with 10-year dropping to 1.56%, was enough of a motivator to drive the markets back up with all 3 major indexes ending the day close to their highs. Given the low level the Nasdaq had fallen to, it was its biggest intraday comeback in over a year.
Added ZH:
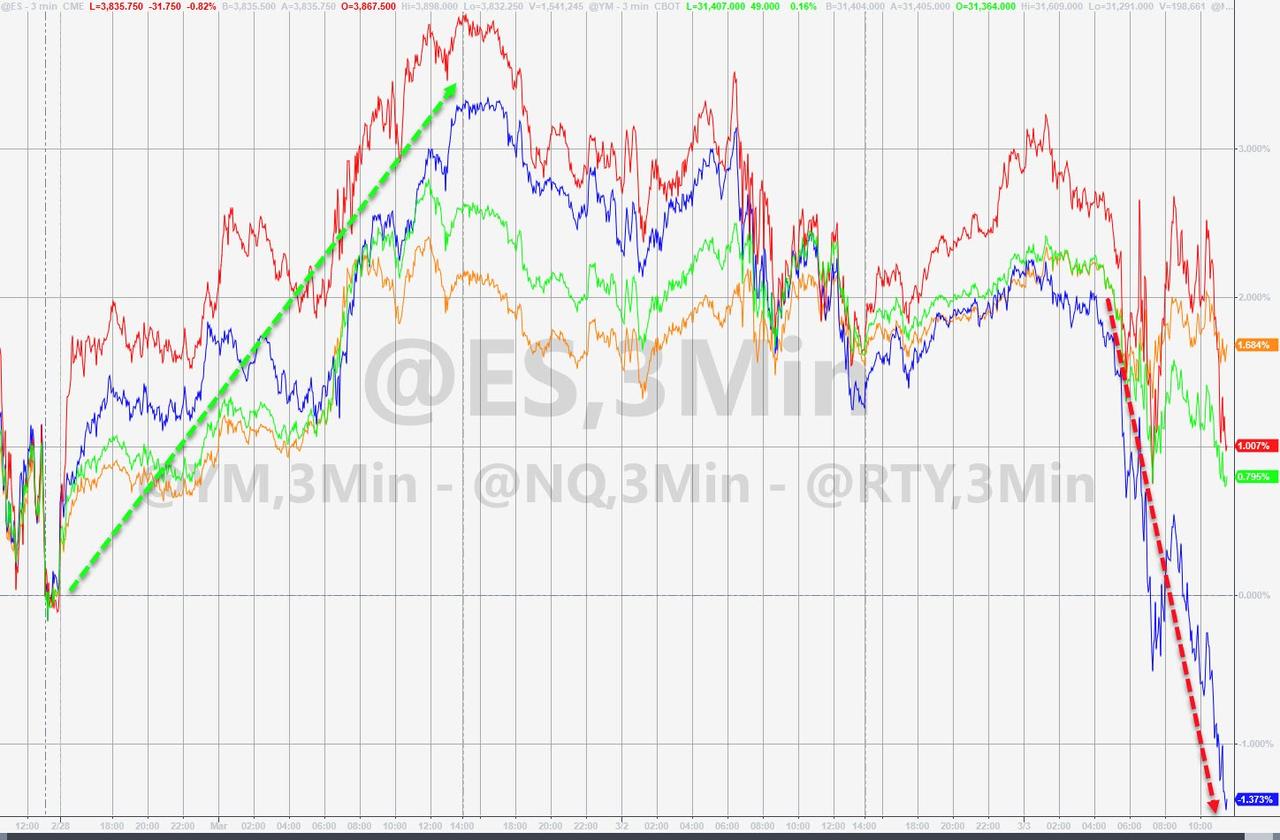
Today was utter chaos – just look at the swings in small caps! From +2% pre-open, to down 2.5% as SHTF, and back up to gains over 2% into the close…
The swings today were very technical nature – S&P ripped back up to test its 50DMA from below, Nasdaq bounced off its 100DMA, Dow bounced off its 50DMA, and Small Caps ripped back up above their 50DMA intraday…
Volatility exploded this week causing wild swings in all asset classes, in part due to Fed head Powell’s not very encouraging comments that that the economy sees “transitory increases in inflation…I expect that we will be patient.”
Hmm, makes me wonder if that type of meaningless jawboning will be enough to keep the markets calm and elevated.
1. From the universe of over 1,800 ETFs, I have selected only those with a trading volume of over $5 million per day (HV ETFs), so that liquidity and a small bid/ask spread are assured.
2. Trend Tracking Indexes (TTIs)
Buy or Sell decisions for Domestic and International ETFs (section 1 and 2), are made based on the respective TTI and its position either above or below its long-term M/A (Moving Average). A crossing of the trend line from below accompanied by some staying power above constitutes a “Buy” signal. Conversely, a clear break below the line constitutes a “Sell” signal. Additionally, I use a 7.5% trailing stop loss on all positions in these categories to control downside risk.
3. All other investment arenas do not have a TTI and should be traded based on the position of the individual ETF relative to its own respective trend line (%M/A). That’s why those signals are referred to as a “Selective Buy.” In other words, if an ETF crosses its own trendline to the upside, a “Buy” signal is generated. Since these areas tend to be more volatile, I recommend a wider trailing sell stop of 7.5%-10% depending on your risk tolerance.
If you are unfamiliar with some of the terminology, please see Glossary of Termsand new subscriber information in section 9.
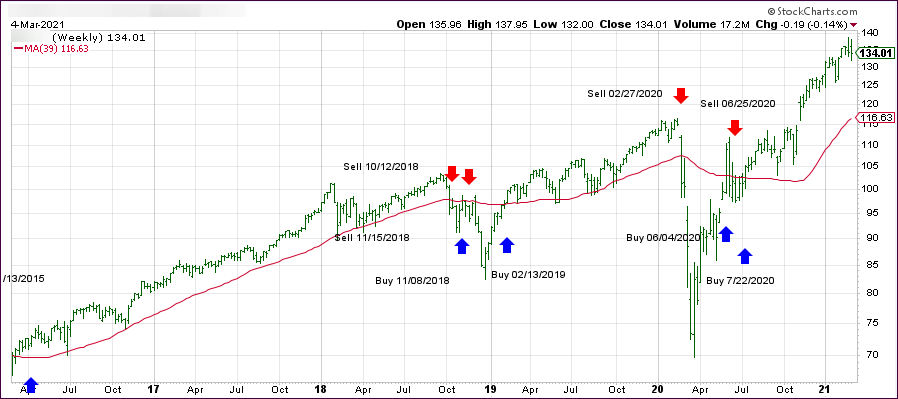
1. DOMESTIC EQUITY ETFs: BUY— since 07/22/2020
Click on chart to enlarge
Our main directional indicator, the Domestic Trend Tracking Index (TTI-green line in the above chart) has now rallied above its long-term trend line (red) by +15.54% and remains in “BUY” mode as posted.
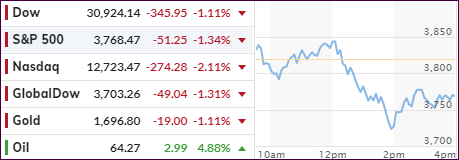
An opening puke in the markets gave way to a rebound back above the unchanged line, but that gain was short lived, and down we went in the afternoon session.
A last hour rebound reduced some of the losses, but the three major indexes ended up in the red with the Nasdaq producing the worst performance with a beating of -2.11%.
Much hope was given to Fed head Powell’s speech, but that turned into a nothing burger with no indication of any assistance, like how to deal with the recent bond volatility, that could have had a soothing effect on the bond market and by extension on the stock market.
General platitudes prevailed with only two sentences indicating something worthwhile, as ZH opined:
“We monitor a broad range of financial conditions and we think that we are a long way from our goals.”
“I would be concerned by disorderly conditions in markets or persistent tightening in financial conditions that threatens the achievement of our goals.”
That lack of specifics in the face of soaring bond yields, with the 10-year now well above 1.5%, and staying there, pulled equities back below the unchanged line and kept them down.
At the same time those rising yields also wiped out the early climb in gold, with the US Dollar giving the assist via a rally to November highs.
The major indexes have now slipped into the red for the year with the Nasdaq now in correction territory, which is defined as a 10% drop from its recent high.
In the end, the Fed failed to do what it does best, namely provide reassuring comments to investors. The lack of such makes we wonder if they have lost control, did not want to assist, or simply ran out ammunition for the time being.
The tech sector was spanked today, as rising bond yields raised concerns about high equity valuations and a potential increase in inflation. The benchmark 10-year bond yield jumped as much as 8 basis points intra-day to 1.49% but pulled back slightly and finished the session at 1.47%.
I have pointed to surging yields as the Achilles tendon of equities, which can bring this tech bull market to an end in a hurry. CNBC called it this way:
The continuous rise in bond yields is raising concerns about equity valuations and a pickup in inflation. Higher bond yields can hit technology stocks particularly hard as they have been relying on easy borrowing for superior growth.
Bucking the sell-off has been the value sector, which I discussed in my most recent client newsletter. Our latest portfolio addition, namely IJS, did exactly that today by advancing +1.28%, while all three major indexes ended in the red.
Especially the Nasdaq was hit hard, and its price dropped through the 50-day M/A resistance level with the index now being down some 5% from Monday’s exuberant highs.
In economic news, ADP reported that 117k new jobs were added in the private sector, which was far less than expectations of 225k.
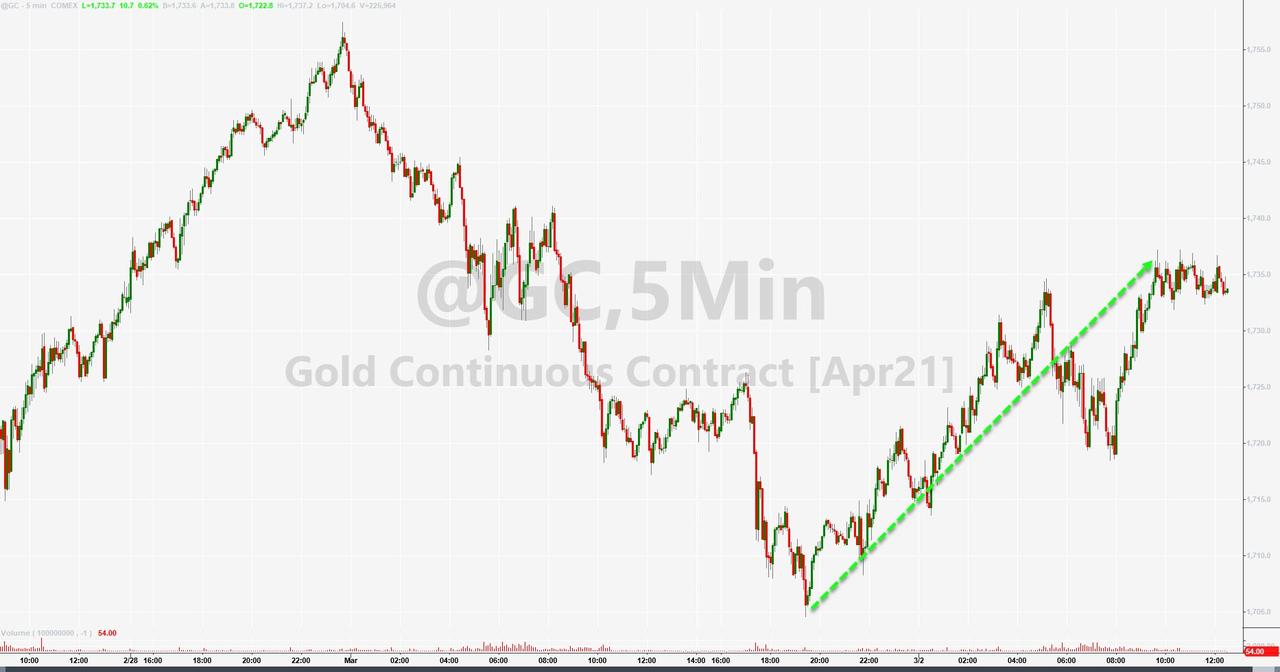
The US Dollar climbed as bond yields rose, thereby pushing precious metals down with Gold barely hanging on to its $1,700 level.
Despite Monday’s “feel good” rally (or was it a dead cat bounce?), volatility and uncertainty have increased with the markets being in a mess and impossible to read. That simply means that the next move has a 50/50 chance of being either up or down.
Have your trailing sell stops identified, and be ready to pull the trigger should the need arise.
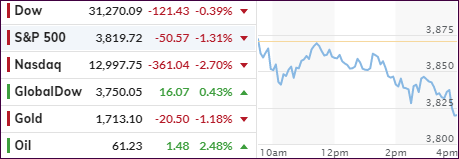
The futures markets got rattled early on by comments from China’s top banking regulator jawboning that “he’s very worried about risks emerging from bubbles in global financial markets and the nation’s property sector.”
That’s all it took to put the fears of further tightening, aka higher interest rates and bond yields, on the front burner with the effect that traders again started worrying about too much exposure to risk assets (stocks). And suddenly, yesterday’s warm and fuzzy feelings were gone, as no follow-through buying materialized.
As a result, the regular trading session started with a drop below the unchanged line, and despite various attempts to push the major indexes into the green, all efforts failed. In fact, the dive into the close and to the lows of the day does not indicate much confidence.
The Nasdaq, after being the leader in yesterday’s comeback fest, fared the worst and surrendered more than half of yesterday’s gains. Portfolio wise, Gold saved the day and ended up +0.57%, thanks to drops in the US Dollar and 10-year bond yields, which dipped below 1.41%.
Added CNBC:
Still, some investors believe it’s inevitable that yields will trend higher this year amid an economic recovery and potentially more fiscal stimulus, which could shrink stock multiples.
Another gigantic short-squeeze put the hurt on a “hedge fund VIP”, the damage of which is still unknown but rumors of liquidation abound. Look at this chart and imagine that you had a leveraged short position. Ouch!
Here again, when hedge funds are squeezed, and are forced to liquidate even their most favorite assets to raise cash to meet margin calls, early weakness in the markets can accelerate as it did today.
It’ll be interesting to see if there is more fallout to come, such as we’ve seen with the recent GME debacle.

