
- Moving the markets
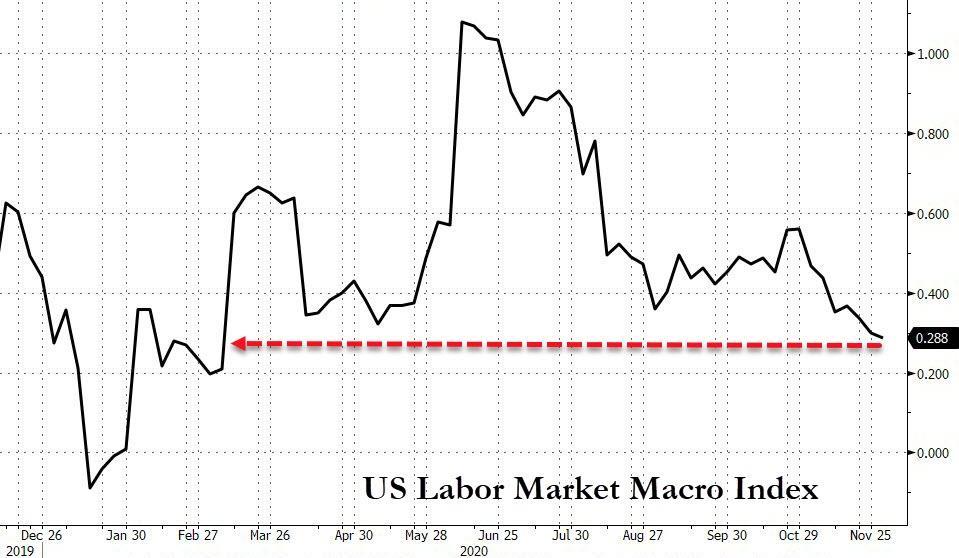
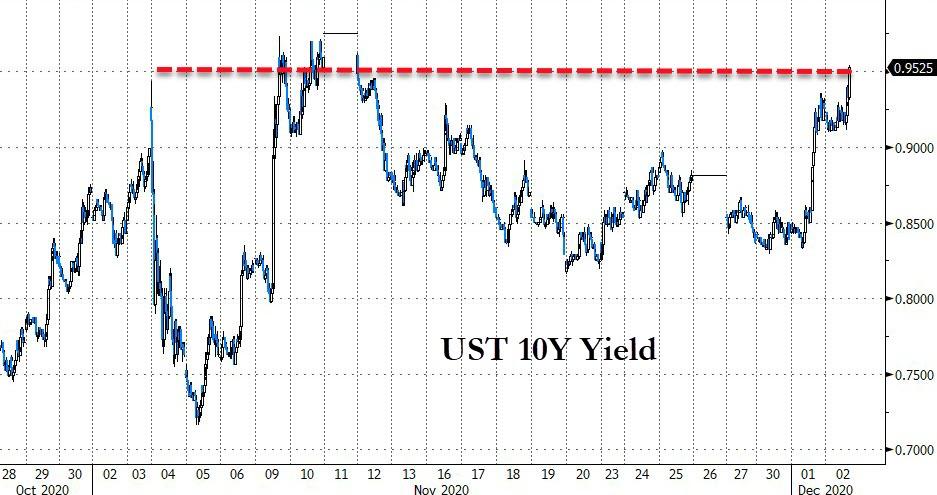
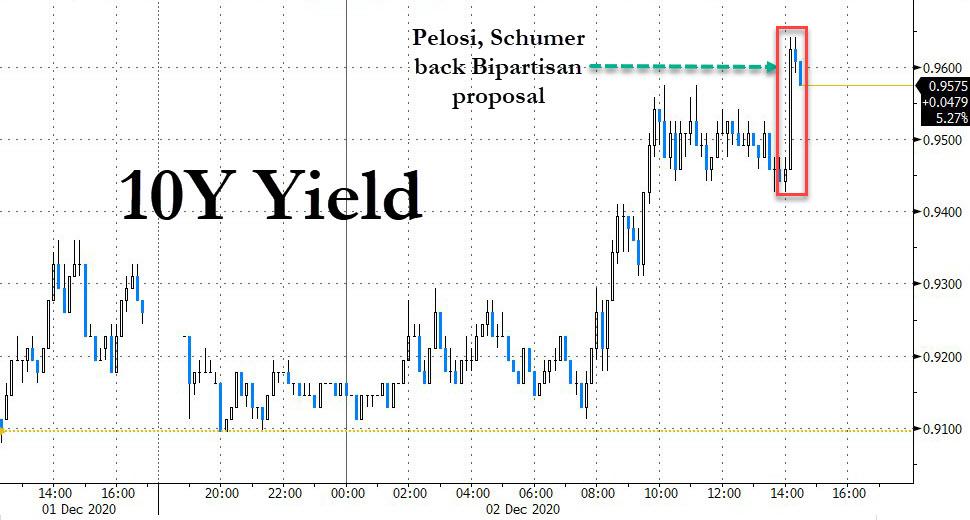
Expectations and reality were at odds this morning when the Labor Market Index weakened yet Bond yields spiked with the 10-year trading just above 0.95% and approaching critical resistance.
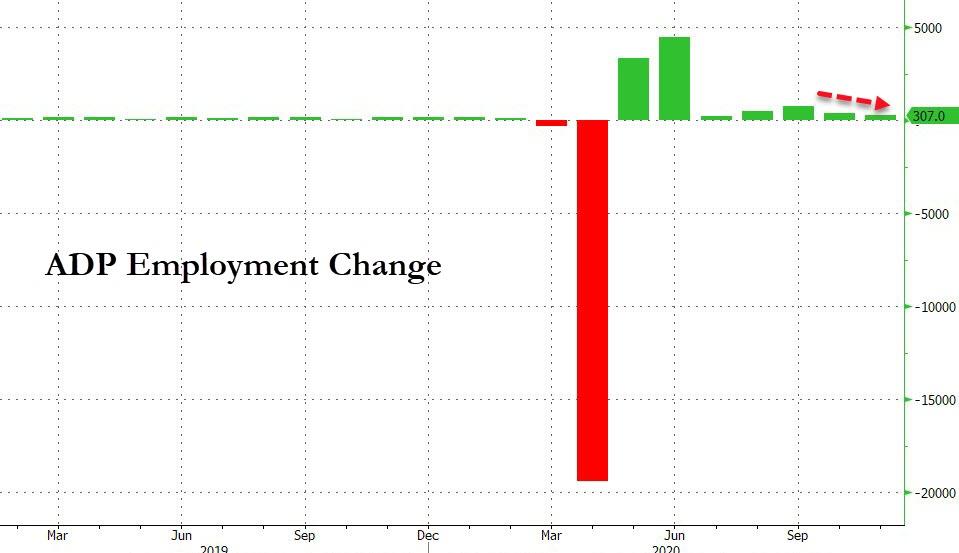
Sure, the weakening Labor Market Index was the result of the latest miss on ADP employment with data coming in at a disappointing 307k additions as opposed to 440k expected. But bond yields rising where they should have been falling makes me go “hmm,” and is just another sign of the upside-down world we’re living in.
The futures dropped, and the major indexes listlessly attempted to climb out of an early hole with traders ignoring the latest vaccine news, as it appeared that a new catalyst was needed to drive the markets.
The much-needed assist came via a mid-day headline that Pelosi and Schumer were backing a bipartisan $908 billion relief plan. That was enough to send bond yields soaring and equities rallying despite the counter parties Mnuchin and McConnell not having voiced any support.
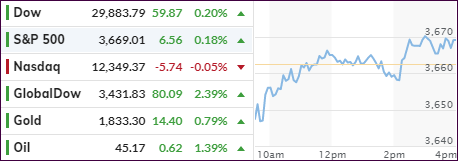
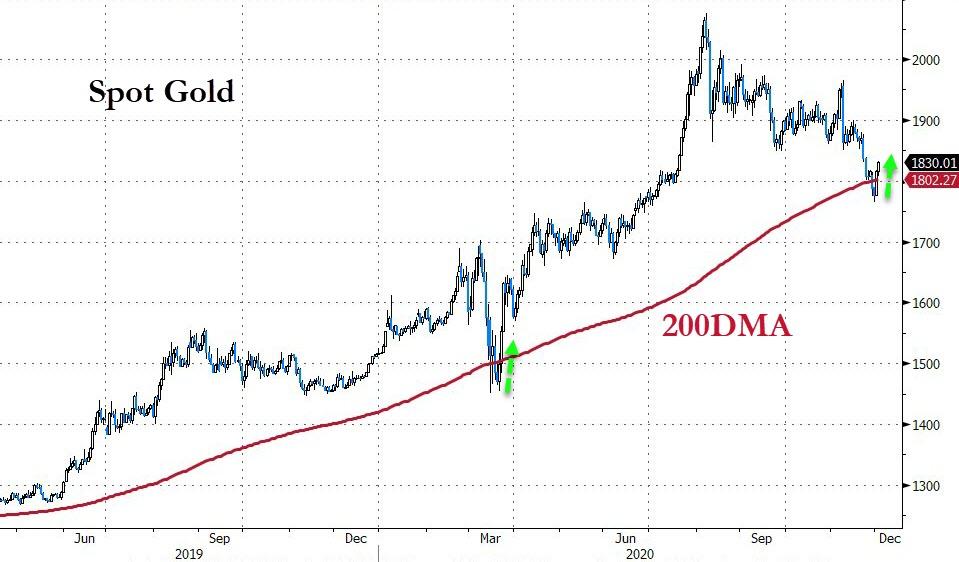
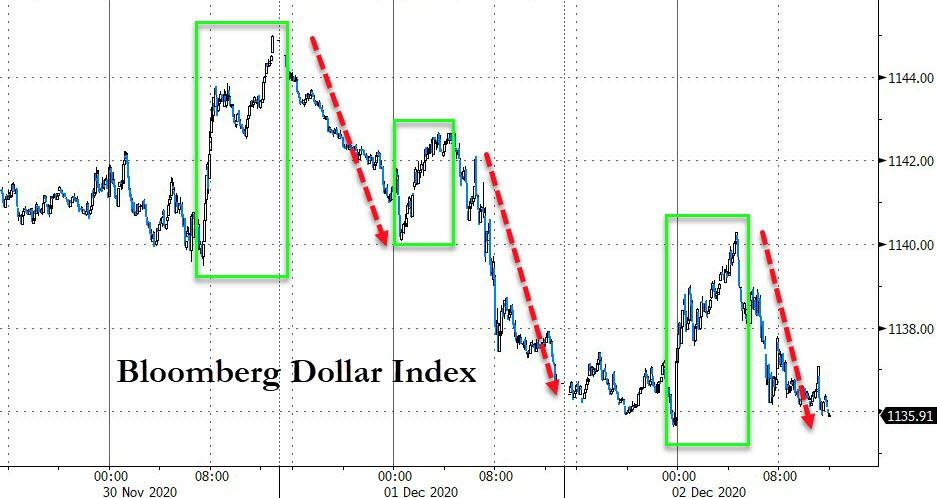
But those details do not matter, stocks got their initial catalyst, and up we went with the S&P 500 eking out a record close. There was no broad participation with Small and MidCaps dropping, while GLD held up well in the face of rising rates by gaining +0.79%, a move that was supported by a falling US dollar.
In the end, the biggest threat to equities right now are rising bond yields. Should the 10-year cross the 1% level to the upside, I am pondering whether that will shorten the lifespan of the current bull and favor a return to bearish sentiment?
2. ETFs in the Spotlight
In case you missed the announcement and description of this section, you can again.
It features some of the 10 broadly diversified domestic and sector ETFs from my HighVolume list as posted every Saturday. Furthermore, they are screened for the lowest MaxDD% number meaning they have been showing better resistance to temporary sell offs than all others over the past year.
The below table simply demonstrates the magnitude with which these ETFs are fluctuating above or below their respective individual trend lines (%+/-M/A). A break below, represented by a negative number, shows weakness, while a break above, represented by a positive percentage, shows strength.
For hundreds of ETF choices, be sure to reference Thursday’s StatSheet.
For this current domestic “Buy” cycle, here’s how some our candidates have fared:
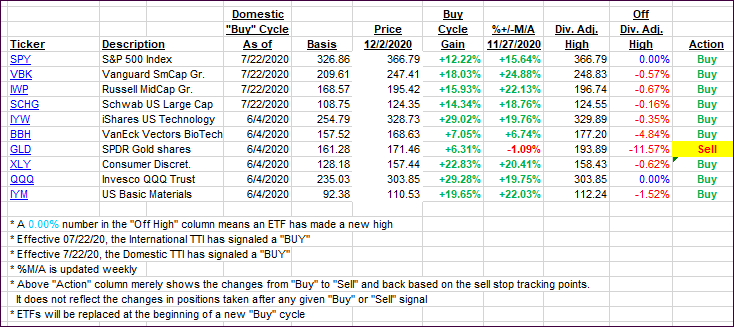
Click image to enlarge
Again, the %+/-M/A column above shows the position of the various ETFs in relation to their respective long-term trend lines, while the trailing sell stops are being tracked in the “Off High” column. The “Action” column will signal a “Sell” once the -8% point has been taken out in the “Off High” column. For more volatile sector ETFs, the trigger point is -10%.
3. Trend Tracking Indexes (TTIs)
Our TTIs headed higher with especially the international one showing more momentum.
This is how we closed 12/02/2020:
Domestic TTI: +20.79% above its M/A (prior close +20.45%)—Buy signal effective 07/22/2020
International TTI: +20.00% above its M/A (prior close +18.78%)—Buy signal effective 07/22/2020
Disclosure: I am obliged to inform you that I, as well as my advisory clients, own some of the ETFs listed in the above table. Furthermore, they do not represent a specific investment recommendation for you, they merely show which ETFs from the universe I track are falling within the specified guidelines.
Contact Ulli