
- Moving the markets
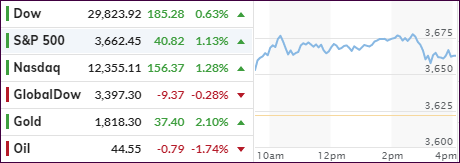
An early rally got cut down, especially in the Dow, but the major indexes managed to eke out solid gains to start the December by continuing the bullish theme of November. The S&P 500 and Nasdaq scored new record closing highs, but the Dow was not able to remain above its 30k level.
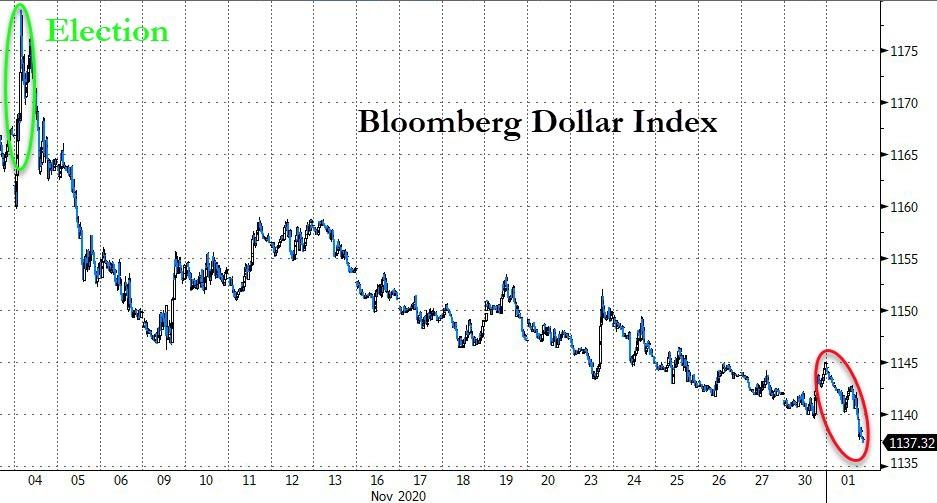
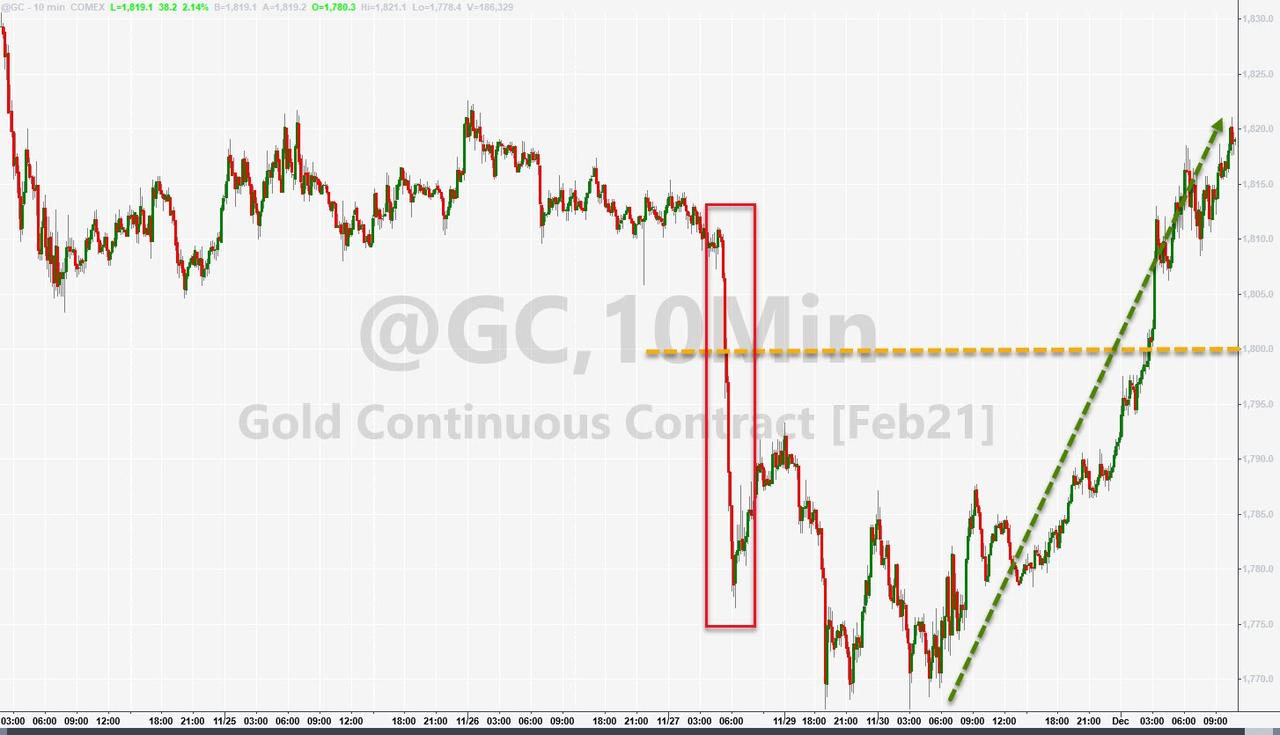
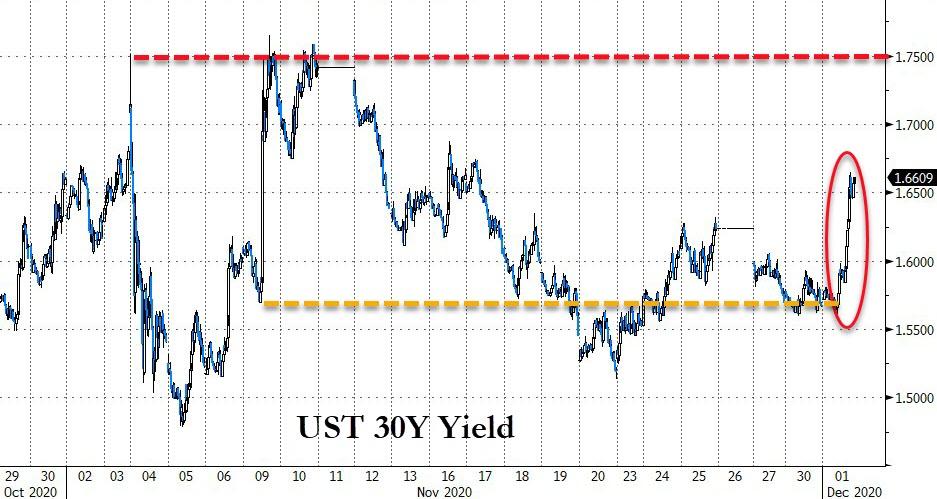
The US Dollar got slammed, which for a change helped gold to stage a rebound back above its recently lost $1,800 level. The victim from the dollar dump were bonds, which slipped as yields spiked severely with the 20-year ETF TLT losing -1.61%.
Market sentiment got a boost after the unveiling of a $908 billion stimulus plan, which assisted stocks early on and propelled the 10-year Treasury yield above 0.9%. However, all the hype evaporated, as the lawmakers engaged in their tug-of-war without any agreement, thereby continuing the stalemate.
Hope that the rally has legs and will last through the end of the year flourishes:
“December looks like it will be a very strong finish for 2020,” wrote Tom Lee of Fundstrat Global Advisors, who cited data that showed during bull markets when the S&P 500 was up more than 10% through November for the year, it always added to that gain in December.
Only time will tell if history repeats itself.
2. ETFs in the Spotlight
In case you missed the announcement and description of this section, you can again.
It features some of the 10 broadly diversified domestic and sector ETFs from my HighVolume list as posted every Saturday. Furthermore, they are screened for the lowest MaxDD% number meaning they have been showing better resistance to temporary sell offs than all others over the past year.
The below table simply demonstrates the magnitude with which these ETFs are fluctuating above or below their respective individual trend lines (%+/-M/A). A break below, represented by a negative number, shows weakness, while a break above, represented by a positive percentage, shows strength.
For hundreds of ETF choices, be sure to reference Thursday’s StatSheet.
For this current domestic “Buy” cycle, here’s how some our candidates have fared:

Click image to enlarge
Again, the %+/-M/A column above shows the position of the various ETFs in relation to their respective long-term trend lines, while the trailing sell stops are being tracked in the “Off High” column. The “Action” column will signal a “Sell” once the -8% point has been taken out in the “Off High” column. For more volatile sector ETFs, the trigger point is -10%.
3. Trend Tracking Indexes (TTIs)
Our TTIs jumped as December started with a bang.
This is how we closed 12/01/2020:
Domestic TTI: +20.45% above its M/A (prior close +19.35%)—Buy signal effective 07/22/2020
International TTI: +18.78% above its M/A (prior close +17.07%)—Buy signal effective 07/22/2020
Disclosure: I am obliged to inform you that I, as well as my advisory clients, own some of the ETFs listed in the above table. Furthermore, they do not represent a specific investment recommendation for you, they merely show which ETFs from the universe I track are falling within the specified guidelines.
Contact Ulli