
- Moving the markets
With both warring parties looking to find common ground for a stimulus package, demands had been considerably dropped from the original over $2 trillion to a far more modest $907 billion. Optimism prevailed early on when a more comfortable number of $600 billion was circulated.
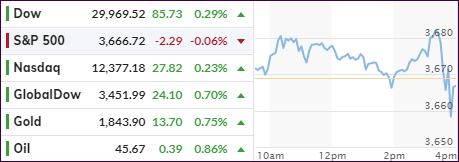
However, nothing was decided, but the markets were the beneficiaries nonetheless with the major indexes showing green numbers. But reality struck late in the day when Pfizer dialed back its vaccine rollout plan, as supply chain issues surfaced.
The S&P 500 immediately headed south and surrendered its gains but only closed moderately in the red, while the other two major indexes remained easily above their respective unchanged lines.
On the economic front, we learned that initial jobless claims dropped this week but still showed a disappointing 712k new filings vs. expectations of 775k. Looking at the big picture, there are still over 20 million Americans filing weekly for some kind of unemployment benefit, according to ZH. That said, it appears that tomorrow’s payroll print may be disappointing.
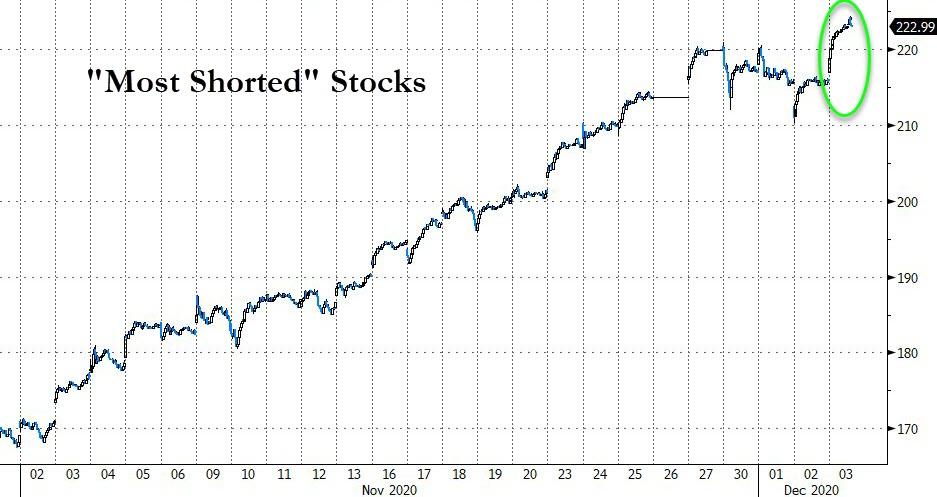
The big assist for equites came from none other than the biggest short-squeeze since September, as Bloomberg pointed out in this chart. Added ZH:
Most shorted stocks are up 17 of the last 22 days, and up a stunning 35% since the start of November.
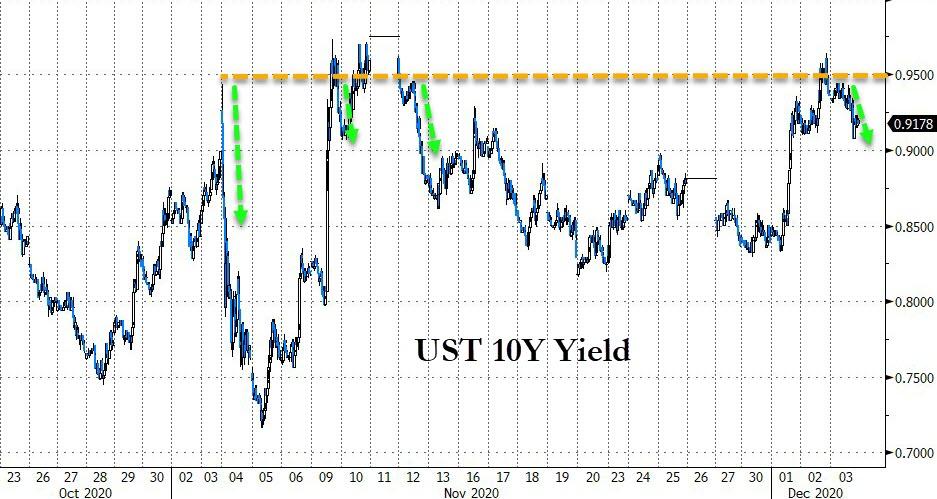
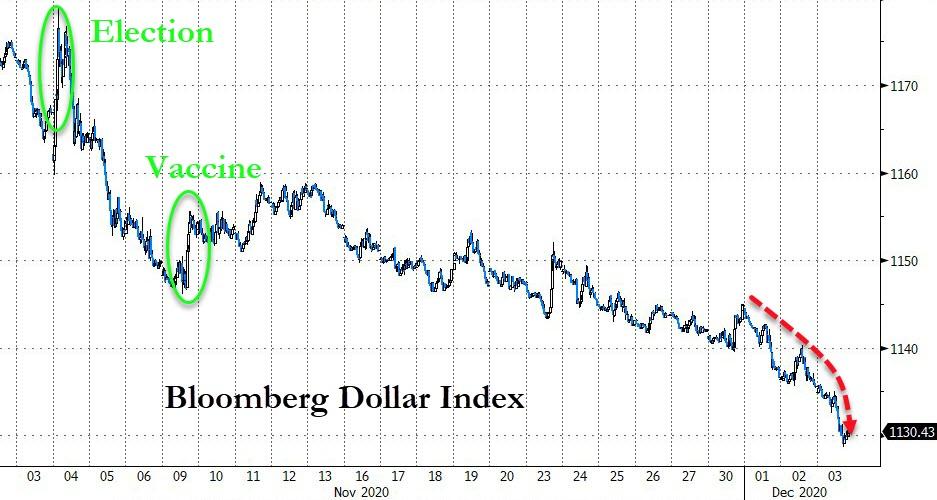
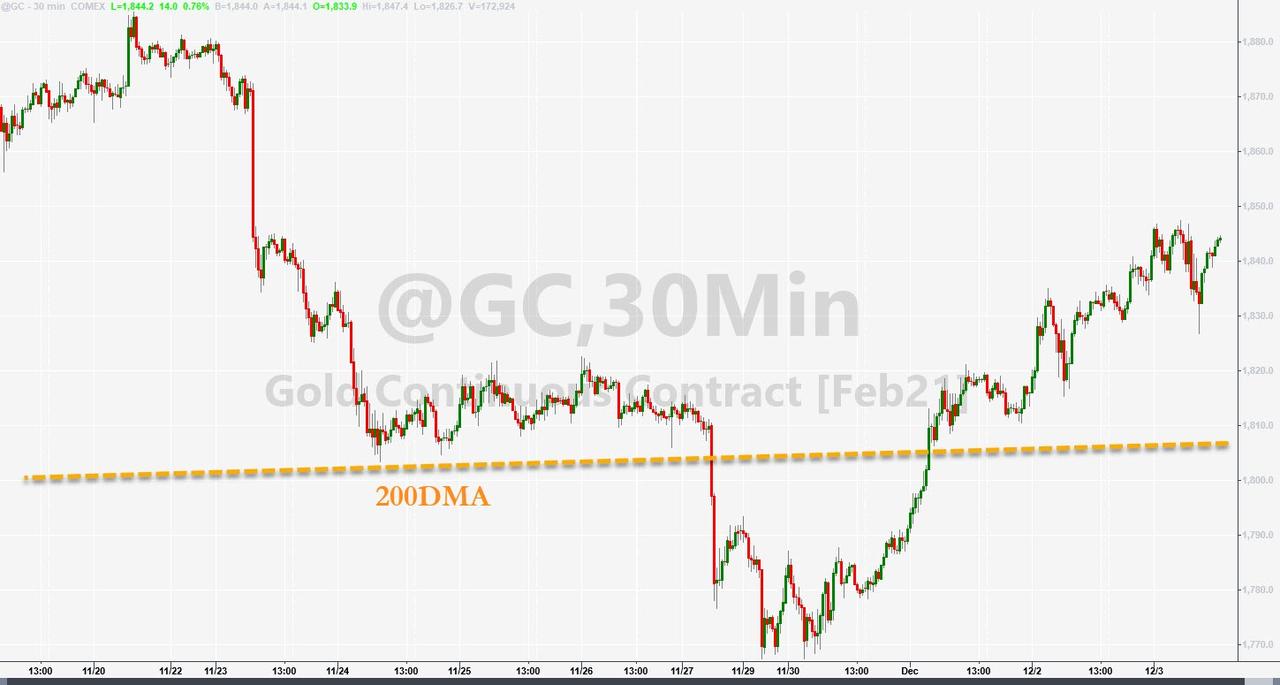
10-year Bond yields pulled back from their recent ascent towards the 1% level, at least for the time being. The US dollar continued its best imitation of a swan dive, thereby lending support to rising gold prices, which bounced off their 200-day M/A.
I will be out of town tomorrow and won’t be able to write the market commentary, but I will post the “ETFs on the Cutline” on Saturday morning.
2. ETFs in the Spotlight
In case you missed the announcement and description of this section, you can again.
It features some of the 10 broadly diversified domestic and sector ETFs from my HighVolume list as posted every Saturday. Furthermore, they are screened for the lowest MaxDD% number meaning they have been showing better resistance to temporary sell offs than all others over the past year.
The below table simply demonstrates the magnitude with which these ETFs are fluctuating above or below their respective individual trend lines (%+/-M/A). A break below, represented by a negative number, shows weakness, while a break above, represented by a positive percentage, shows strength.
For hundreds of ETF choices, be sure to reference Thursday’s StatSheet.
For this current domestic “Buy” cycle, here’s how some our candidates have fared:
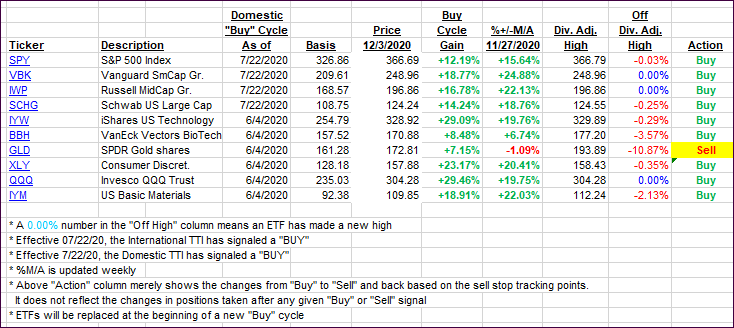
Click image to enlarge
Again, the %+/-M/A column above shows the position of the various ETFs in relation to their respective long-term trend lines, while the trailing sell stops are being tracked in the “Off High” column. The “Action” column will signal a “Sell” once the -8% point has been taken out in the “Off High” column. For more volatile sector ETFs, the trigger point is -10%.
3. Trend Tracking Indexes (TTIs)
Our TTIs edged up with both of them now being positioned over 20% above their respective trend lines.
This is how we closed 12/03/2020:
Domestic TTI: +21.47% above its M/A (prior close +20.79%)—Buy signal effective 07/22/2020
International TTI: +20.69% above its M/A (prior close +20.00%)—Buy signal effective 07/22/2020
Disclosure: I am obliged to inform you that I, as well as my advisory clients, own some of the ETFs listed in the above table. Furthermore, they do not represent a specific investment recommendation for you, they merely show which ETFs from the universe I track are falling within the specified guidelines.
Contact Ulli