
- Moving the markets
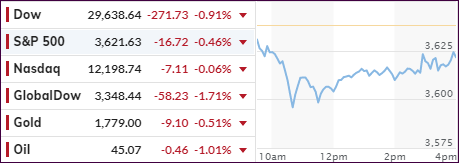
Despite the Dow having had its best month since 1987, the last day of November proved to be a downer with the major indexes slumping led by the Dow with the Nasdaq holding up the best.
This pretty much reflects this year’s performance when, despite the hype accompanying the Dow reaching the $30k level, the Nasdaq (QQQ) proved to be far superior by gaining +41.57% vs. the rather meager +3.86% of the Dow.
Opined JJ Kinahan, chief market strategist at TD Ameritrade:
“What’s really taken most people by surprise is that if anybody said to you in March, ‘Hey we’re going to have a year where really most businesses are working at not-full capacity, most restaurants may not even be open, people aren’t going to the office, and oh yeah, by the way, we’ll hit all-time highs,’ people would have thought you were nuts.”
“It’s been amazing.”
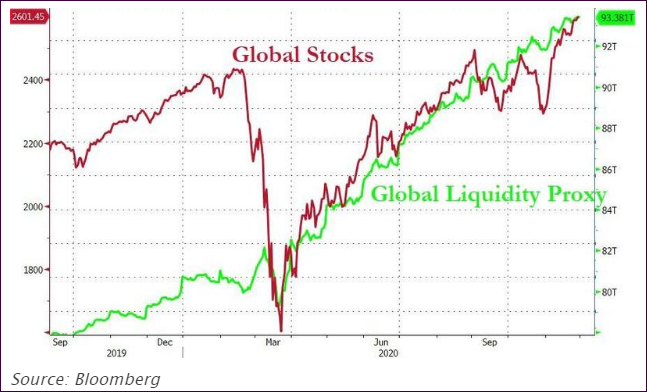
Yes, it has been JJ. But let’s not forget that the reason for this levitation has absolutely nothing to do with businesses working at full capacity or not, nor any other fundamentals, but it has everything to do with the $15 trillion rise in global liquidity, as I have posted ad nauseum:
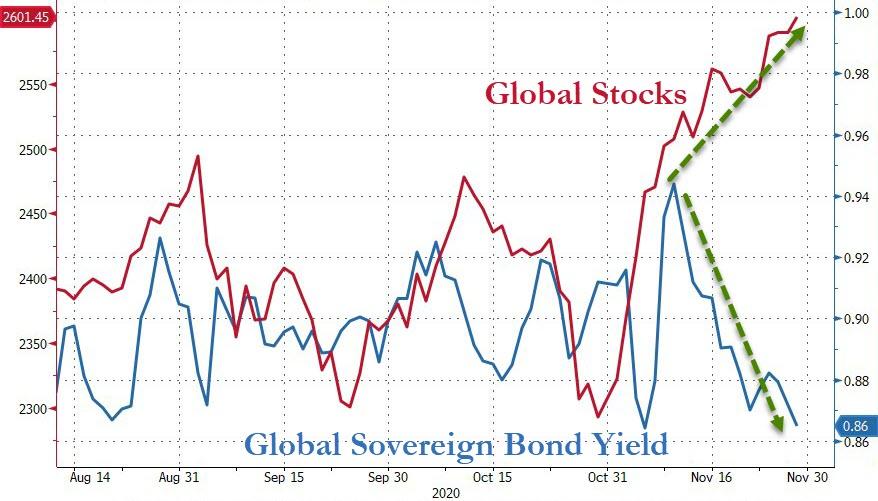
Because, if the reason for the rally had been one of improving fundamentals, we would not have seen the total disconnect between rising global stocks and tumbling bond yields, as Bloomberg shows in this chart. Increased liquidity and collapsing bond yields have made it possible to see stock markets rally in the face of sharply declining economies.
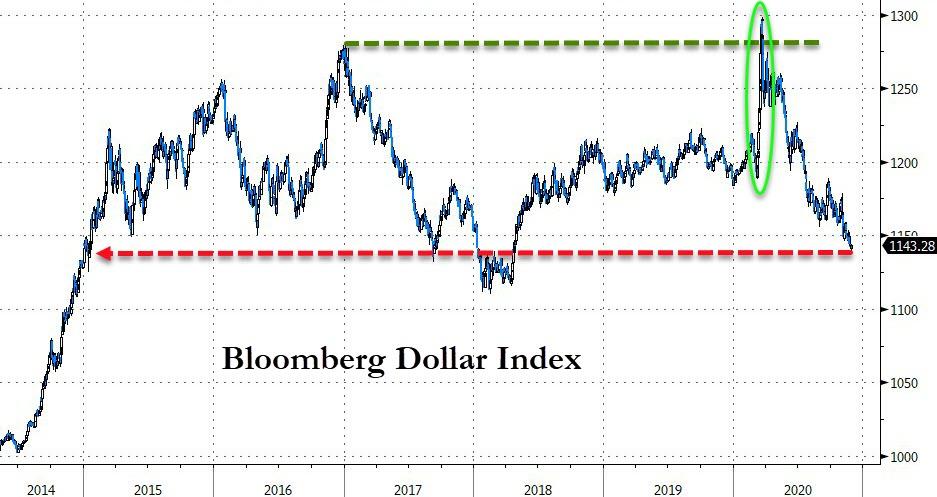
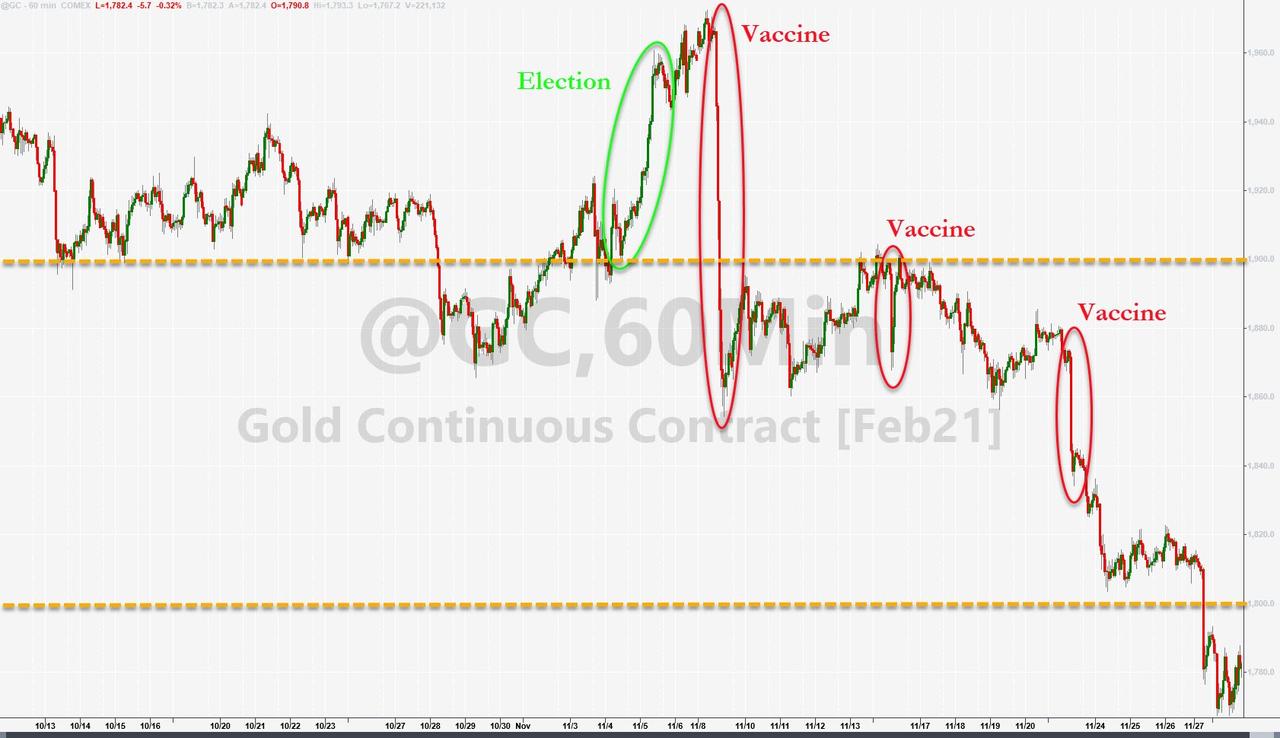
The oddity to me was that, despite the pummeling of the US Dollar, a corresponding rise in gold prices did not occur, which may be temporary but also could be troublesome. In my advisor practice, I have therefore reduced our gold holdings until such time that a new major uptrend can be established.
As far as the upcoming month of December is concerned, uncertainty will reign, and all options are on the table ranging from a melt-up in equities to a collapse. It’s important to have an exit strategy in place, should the latter occur.
2. ETFs in the Spotlight
In case you missed the announcement and description of this section, you can again.
It features some of the 10 broadly diversified domestic and sector ETFs from my HighVolume list as posted every Saturday. Furthermore, they are screened for the lowest MaxDD% number meaning they have been showing better resistance to temporary sell offs than all others over the past year.
The below table simply demonstrates the magnitude with which these ETFs are fluctuating above or below their respective individual trend lines (%+/-M/A). A break below, represented by a negative number, shows weakness, while a break above, represented by a positive percentage, shows strength.
For hundreds of ETF choices, be sure to reference Thursday’s StatSheet.
For this current domestic “Buy” cycle, here’s how some our candidates have fared:
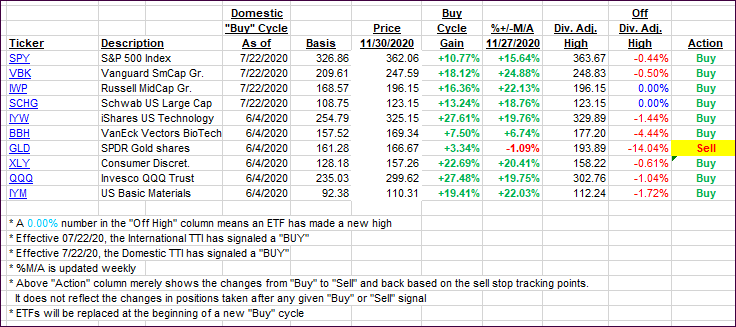
Click image to enlarge
Again, the %+/-M/A column above shows the position of the various ETFs in relation to their respective long-term trend lines, while the trailing sell stops are being tracked in the “Off High” column. The “Action” column will signal a “Sell” once the -8% point has been taken out in the “Off High” column. For more volatile sector ETFs, the trigger point is -10%.
3. Trend Tracking Indexes (TTIs)
Our TTIs slipped as a great month ended on a weak note.
This is how we closed 11/30/2020:
Domestic TTI: +19.35% above its M/A (prior close +20.64%)—Buy signal effective 07/22/2020
International TTI: +17.07% above its M/A (prior close +19.09%)—Buy signal effective 07/22/2020
Disclosure: I am obliged to inform you that I, as well as my advisory clients, own some of the ETFs listed in the above table. Furthermore, they do not represent a specific investment recommendation for you, they merely show which ETFs from the universe I track are falling within the specified guidelines.
Contact Ulli