
- Moving the markets
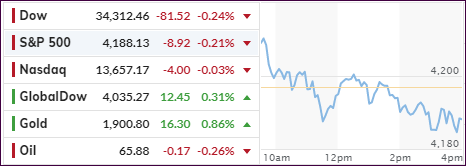
An early rally bit the dust, with the major indexes not being able to sustain the initial bullish momentum. The losses were small, less than 0.25%, and the Nasdaq ended just about unchanged.
Amazon came under pressure after a DC attorney launching a lawsuit on antitrust grounds, which, by affiliation, affected the entire tech sector. Airlines and cruise lines gave an assist and kept the broader market from sliding further.
Small Caps rode the rollercoaster today being up 1% at the onset and down 1.57% (IJS) at the close, thereby ending up worse than the major indexes.
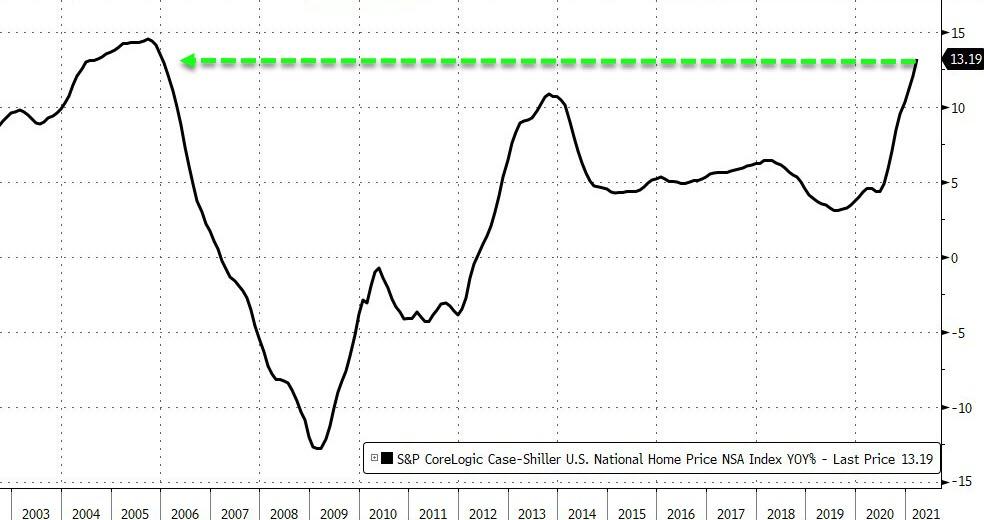
On the economic side, New Home Sales plunged, after a massive downward revision for March (from 20.7% to only 7.4%), with April showing a drop of 5.9% MoM. At the same time, US Home Prices exploded by rising 13.19% YoY, the fastest since 2005, according to ZeroHedge.
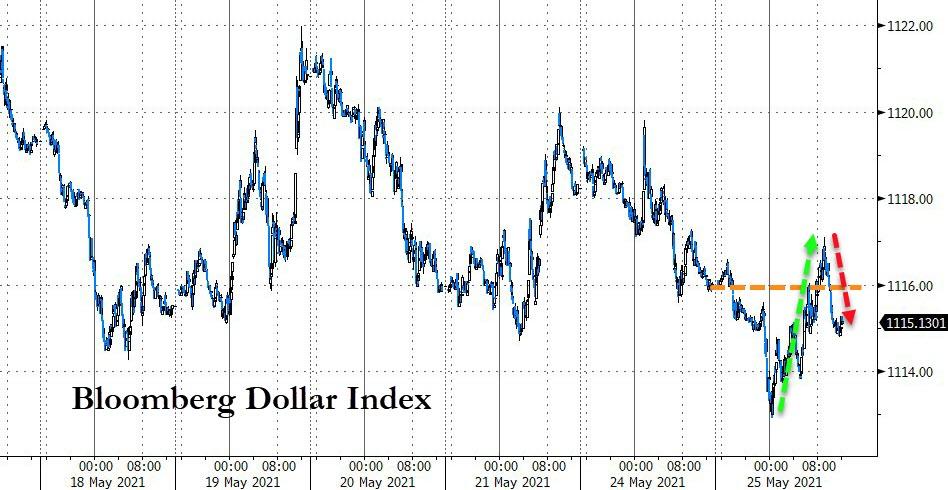
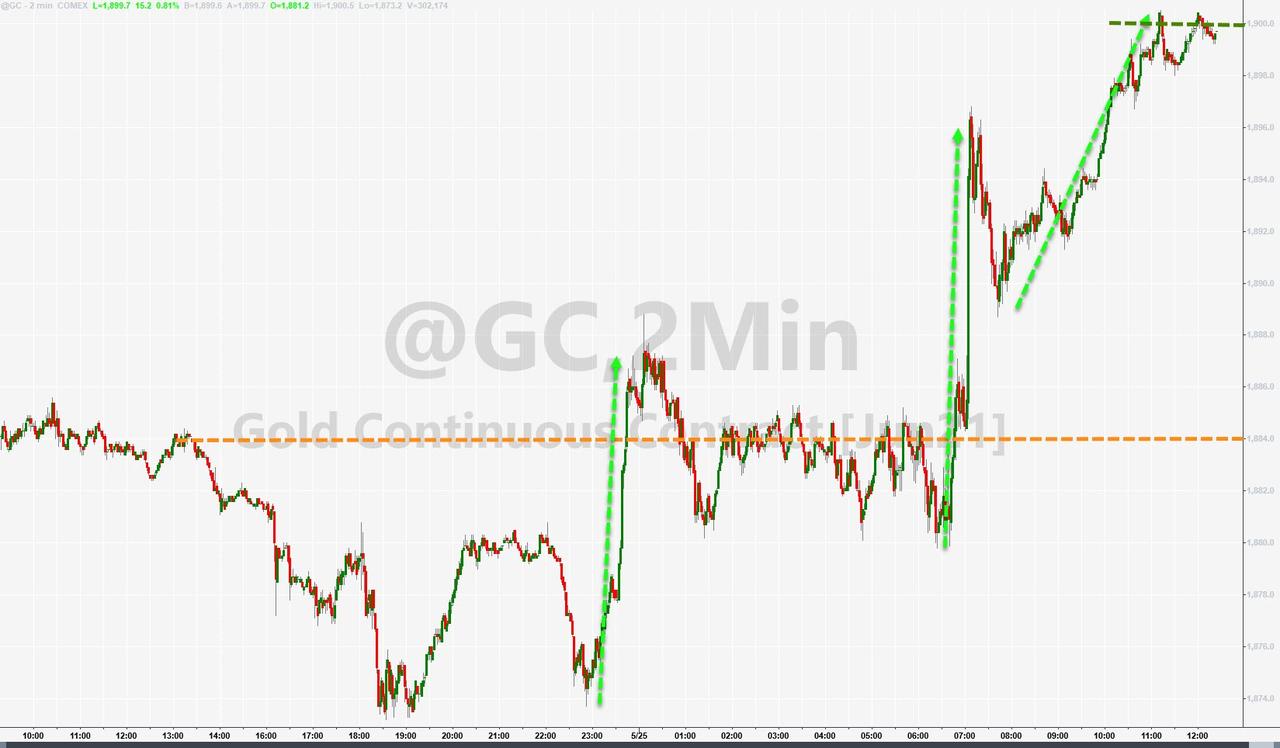
The US Dollar pumped and dumped and closed slightly lower. The 10-year bond yield retreated as well, thereby giving Gold a reason to rally, and the precious metal added not only +0.84% but also reclaimed its $1,900 level—although by only a small margin.
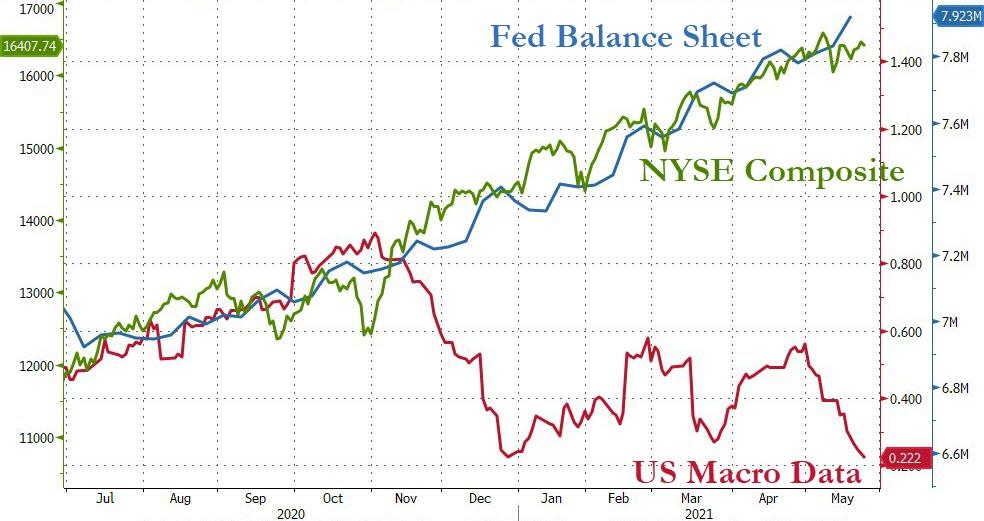
The Fed’s balance sheet keeps growing and remains the primary reason for equities to hover at these elevated levels, as this chart by Bloomberg clearly shows, while US Macro Data are heading in the opposite direction.
2. ETFs in the Spotlight
In case you missed the announcement and description of this section, you can read it here again.
It features some of the 10 broadly diversified domestic and sector ETFs from my HighVolume list as posted every Saturday. Furthermore, they are screened for the lowest MaxDD% number meaning they have been showing better resistance to temporary sell offs than all others over the past year.
The below table simply demonstrates the magnitude with which these ETFs are fluctuating above or below their respective individual trend lines (%+/-M/A). A break below, represented by a negative number, shows weakness, while a break above, represented by a positive percentage, shows strength.
For hundreds of ETF choices, be sure to reference Thursday’s StatSheet.
For this current domestic “Buy” cycle, here’s how some our candidates have fared:

Click image to enlarge.
Again, the %+/-M/A column above shows the position of the various ETFs in relation to their respective long-term trend lines, while the trailing sell stops are being tracked in the “Off High” column. The “Action” column will signal a “Sell” once the -8% point has been taken out in the “Off High” column. For more volatile sector ETFs, the trigger point is -10%.
3. Trend Tracking Indexes (TTIs)
Our TTIs both slipped a tad as the markets trod water.
This is how we closed 05/25/2021:
Domestic TTI: +16.78% above its M/A (prior close +17.29%)—Buy signal effective 07/22/2020.
International TTI: +15.37% above its M/A (prior close +15.56%)—Buy signals effective 07/22/2020.
Disclosure: I am obliged to inform you that I, as well as my advisory clients, own some of the ETFs listed in the above table. Furthermore, they do not represent a specific investment recommendation for you, they merely show which ETFs from the universe I track are falling within the specified guidelines.
All linked charts above are courtesy of Bloomberg via ZeroHedge.
Contact Ulli