
- Moving the markets
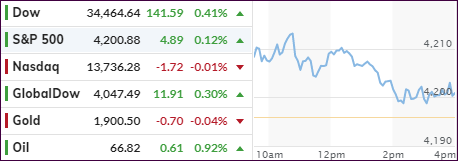
After an early rally, the major indexes spent the remainder of the session struggling to maintain their gains but were not able to with prices slipping and the Nasdaq dipping into the red. However, the Dow and S&P 500 were able to advance modestly.
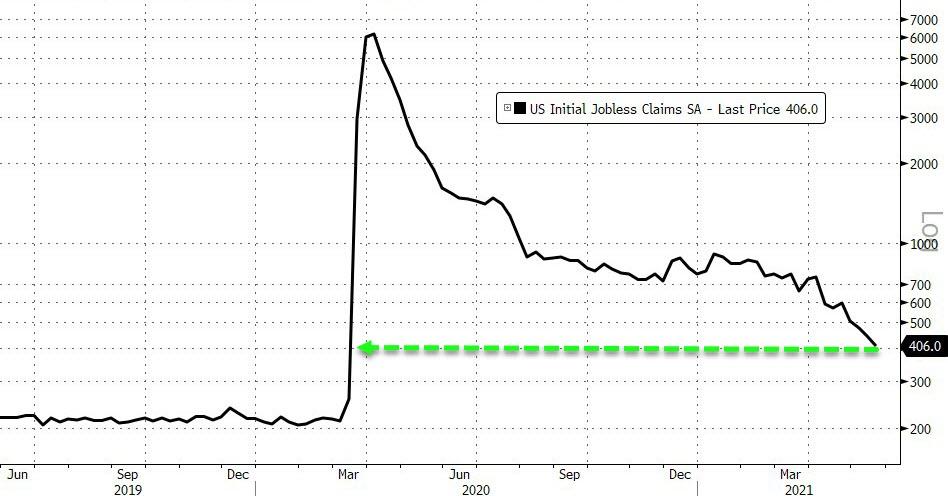
Better-than-expected Initial Jobless Claims provided the ammunition for the early surge. The Labor Department reported that these claims had tumbled to their lowest since the lockdown began, as “only” 406k Americans filed vs. 425k expected.
But, as ZeroHedge pointed out, that is still double the pre-pandemic norms and, despite this improvement, almost 16 million Americans area still on some form of government dole.
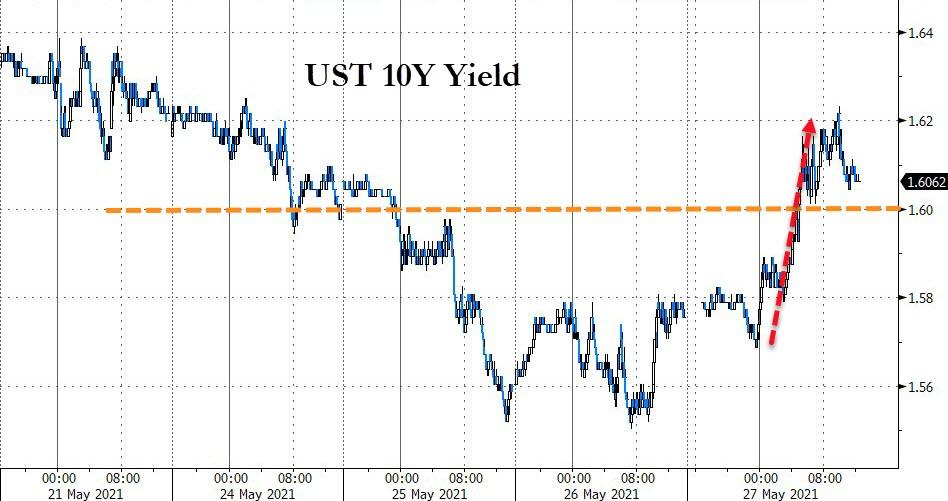
As news of Biden’s enormous budget hit the wires, bond yields spiked and stocks started to retreat, except Small Caps, which remained solidly in the green. So did the value ETF RPV, which had a strong showing of +1.22%, thereby clearly outperforming the “growth” sector.
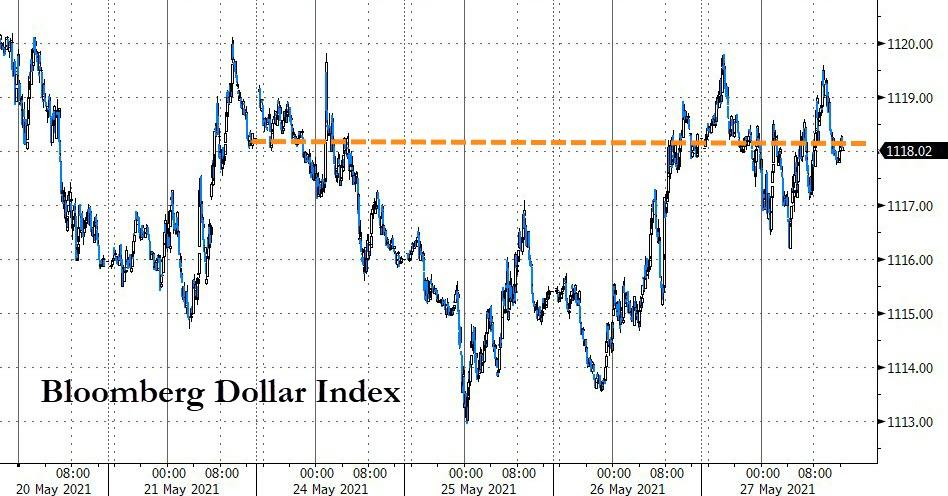
The US Dollar index rode the rollercoaster and ended just about unchanged, while the Gold ETF GLD managed to eke out a tiny gain in the face of rising bond yields.
For sure, we saw a slowdown in trading and volatility ahead of the long Memorial Day weekend. I expect more of that tomorrow with traders’ enthusiasm to bid up stocks ahead of a Holiday not being their priority number one.
2. ETFs in the Spotlight
In case you missed the announcement and description of this section, you can read it here again.
It features some of the 10 broadly diversified domestic and sector ETFs from my HighVolume list as posted every Saturday. Furthermore, they are screened for the lowest MaxDD% number meaning they have been showing better resistance to temporary sell offs than all others over the past year.
The below table simply demonstrates the magnitude with which these ETFs are fluctuating above or below their respective individual trend lines (%+/-M/A). A break below, represented by a negative number, shows weakness, while a break above, represented by a positive percentage, shows strength.
For hundreds of ETF choices, be sure to reference Thursday’s StatSheet.
For this current domestic “Buy” cycle, here’s how some our candidates have fared:
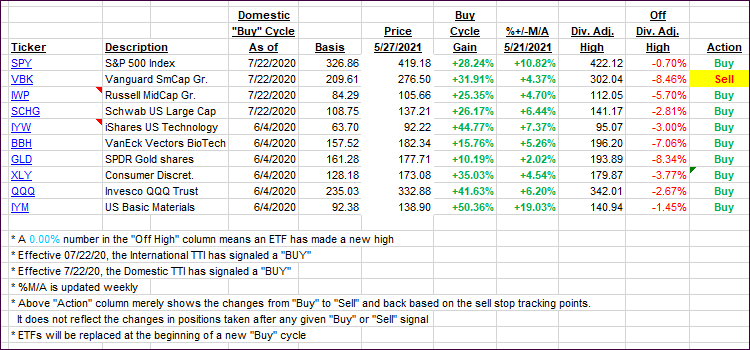
Click image to enlarge.
Again, the %+/-M/A column above shows the position of the various ETFs in relation to their respective long-term trend lines, while the trailing sell stops are being tracked in the “Off High” column. The “Action” column will signal a “Sell” once the -8% point has been taken out in the “Off High” column. For more volatile sector ETFs, the trigger point is -10%.
3. Trend Tracking Indexes (TTIs)
Our TTIs rebounded and posted modest gains.
This is how we closed 05/27/2021:
Domestic TTI: +17.75% above its M/A (prior close +17.18%)—Buy signal effective 07/22/2020.
International TTI: +15.72% above its M/A (prior close +15.33%)—Buy signals effective 07/22/2020.
Disclosure: I am obliged to inform you that I, as well as my advisory clients, own some of the ETFs listed in the above table. Furthermore, they do not represent a specific investment recommendation for you, they merely show which ETFs from the universe I track are falling within the specified guidelines.
All linked charts above are courtesy of Bloomberg via ZeroHedge.
Contact Ulli