
- Moving the markets
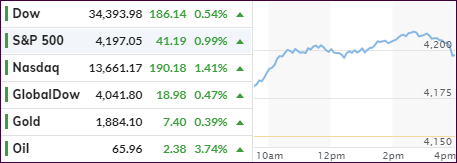
Right after the opening bell, the bulls took charge, after having lost the momentum battle last week, with the major indexes climbing solidly led by the embattled tech sector. Positive news about the continued economic reopening provided the ammunition for the Nasdaq to advance solidly after the recent spanking.
Throughout the session, there was no hesitancy as to market direction with minor pullbacks being quickly bought, as this week got off to a good start. I guess traders were re-thinking the Fed’s hawkish FOMC minutes from last week and decided that “buying the dip” was the way to go, a mentality that has provided support throughout this year and prevented corrections from becoming more serious.
So far, only the Dow is on track to score a gain for May, while the S&P 500 may snap its three-month winning streak. The Nasdaq, which is still down some 3% for the month, may finally break its 6-month winning streak. But there are still four trading days left…
With the US Dollar Index down, and 10-year bond yield retreating, Gold was the beneficiary again by gaining 0.33%.
With tech taking the lead for the day, the S&P 500 (SPY) outperformed its “value” cousin RPV by a good spread, yet on a YTD basis, the latter is ahead by a huge margin, namely +31% vs. 12.5%.
2. ETFs in the Spotlight
In case you missed the announcement and description of this section, you can read it here again.
It features some of the 10 broadly diversified domestic and sector ETFs from my HighVolume list as posted every Saturday. Furthermore, they are screened for the lowest MaxDD% number meaning they have been showing better resistance to temporary sell offs than all others over the past year.
The below table simply demonstrates the magnitude with which these ETFs are fluctuating above or below their respective individual trend lines (%+/-M/A). A break below, represented by a negative number, shows weakness, while a break above, represented by a positive percentage, shows strength.
For hundreds of ETF choices, be sure to reference Thursday’s StatSheet.
For this current domestic “Buy” cycle, here’s how some our candidates have fared:
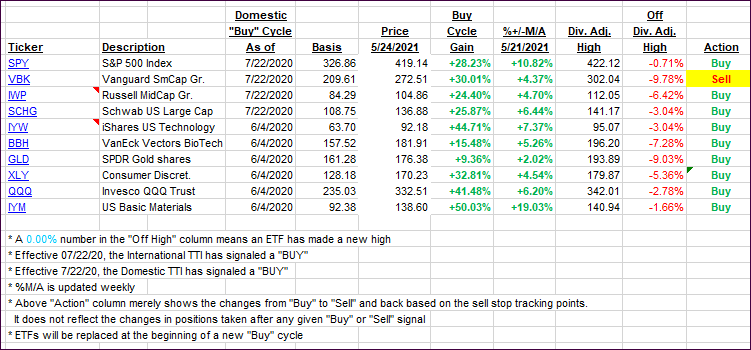
Click image to enlarge.
Again, the %+/-M/A column above shows the position of the various ETFs in relation to their respective long-term trend lines, while the trailing sell stops are being tracked in the “Off High” column. The “Action” column will signal a “Sell” once the -8% point has been taken out in the “Off High” column. For more volatile sector ETFs, the trigger point is -10%.
3. Trend Tracking Indexes (TTIs)
Our TTIs bounced as the bulls found some upward momentum.
This is how we closed 05/24/2021:
Domestic TTI: +17.29% above its M/A (prior close +16.60%)—Buy signal effective 07/22/2020.
International TTI: +15.56% above its M/A (prior close +15.00%)—Buy signals effective 07/22/2020.
Disclosure: I am obliged to inform you that I, as well as my advisory clients, own some of the ETFs listed in the above table. Furthermore, they do not represent a specific investment recommendation for you, they merely show which ETFs from the universe I track are falling within the specified guidelines.
All linked charts above are courtesy of Bloomberg via ZeroHedge.
Contact Ulli