
- Moving the markets
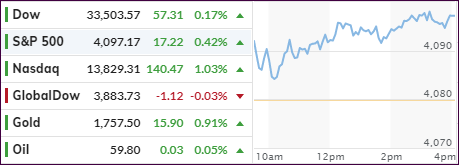
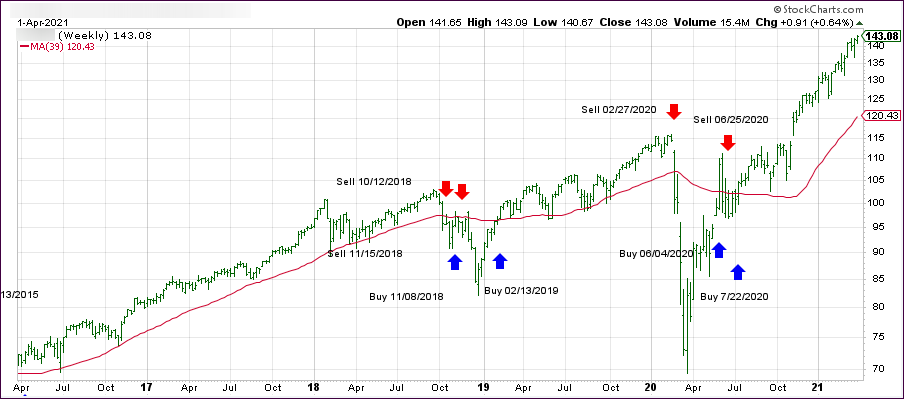
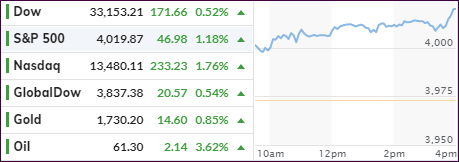
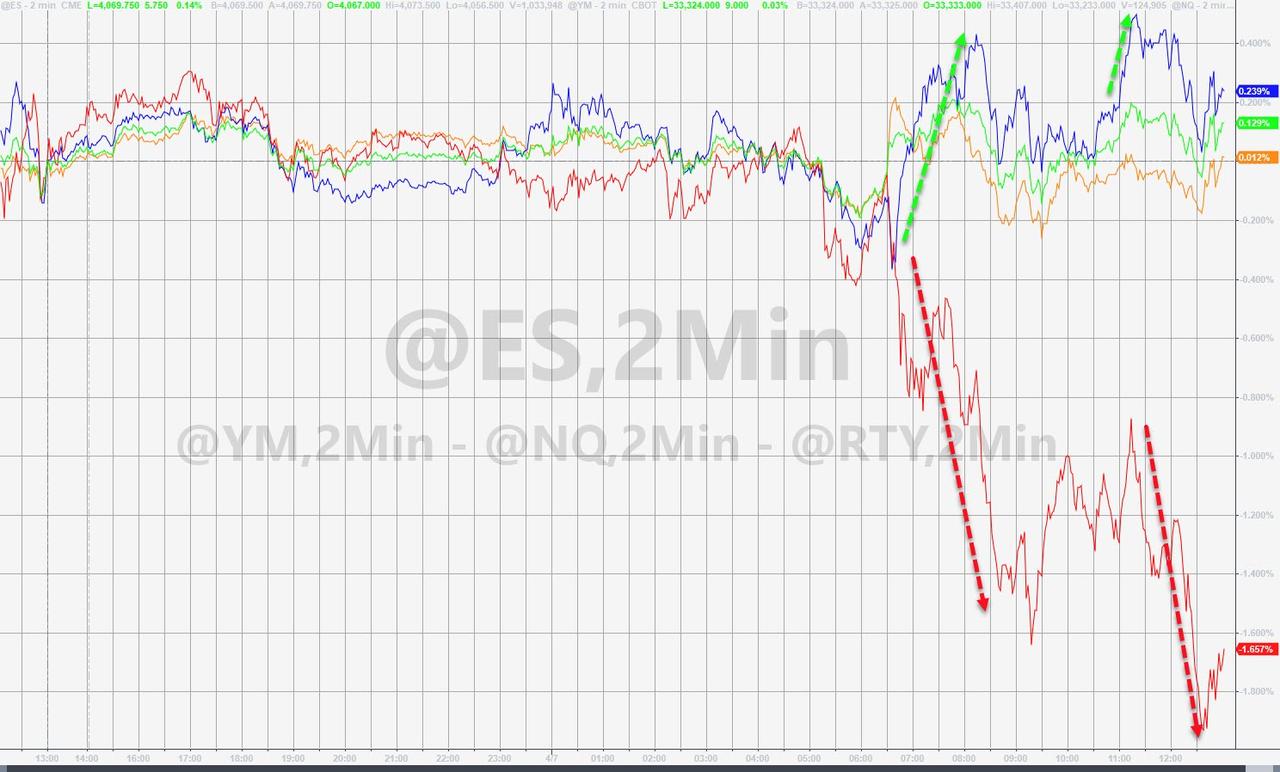
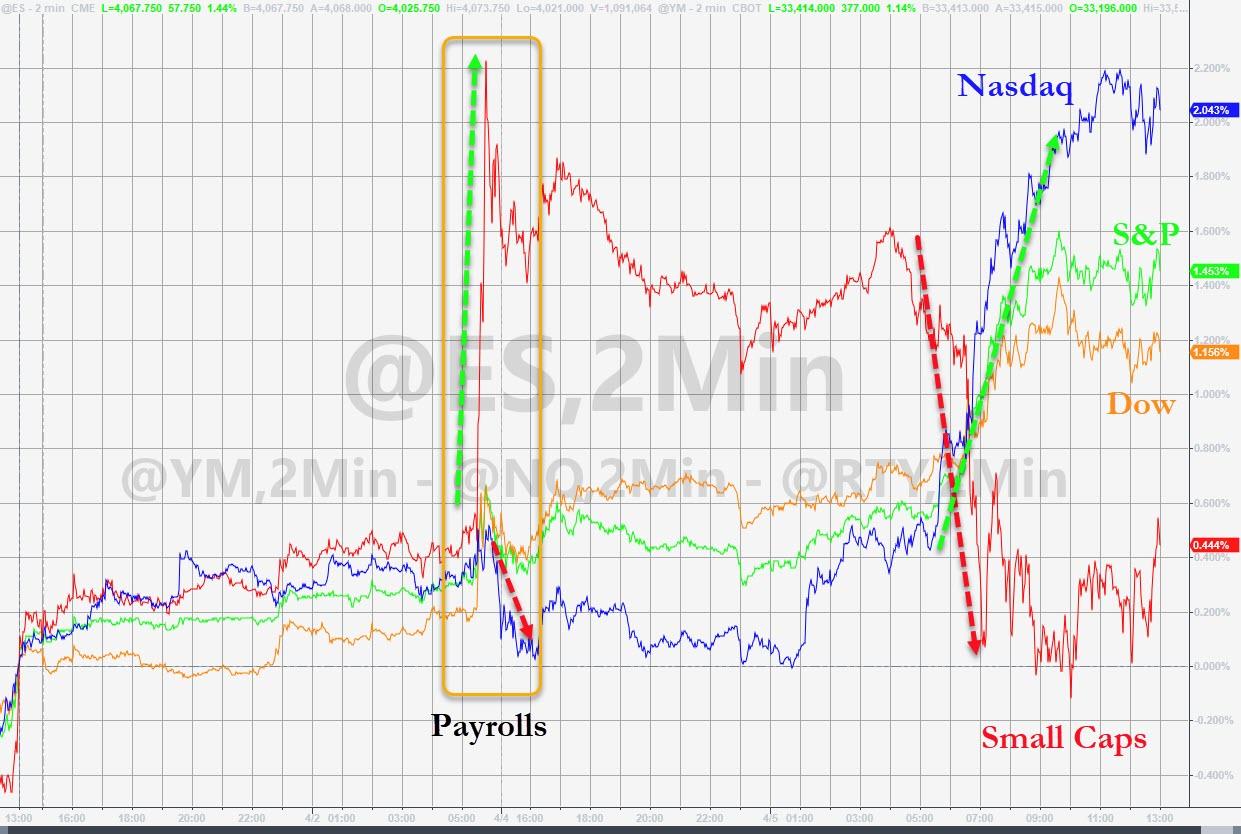
After two days of aimless sideways meandering, the markets broke out to the upside although in moderate fashion. Nevertheless, it was enough of a spurt for the S&P 500 to score a new record high, while the index stopped just short of breaking through the 4,100 level.
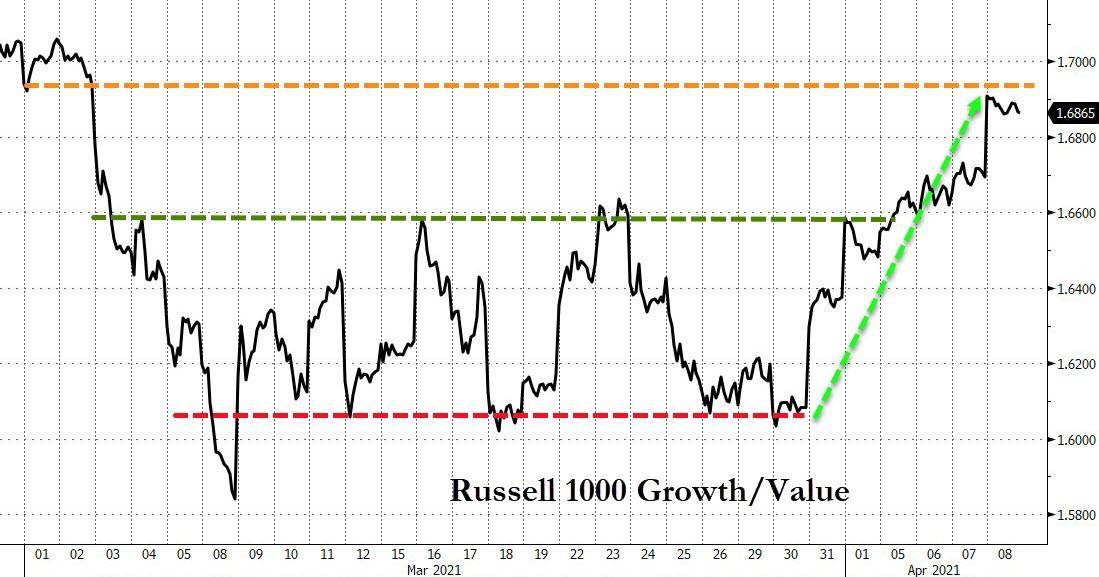
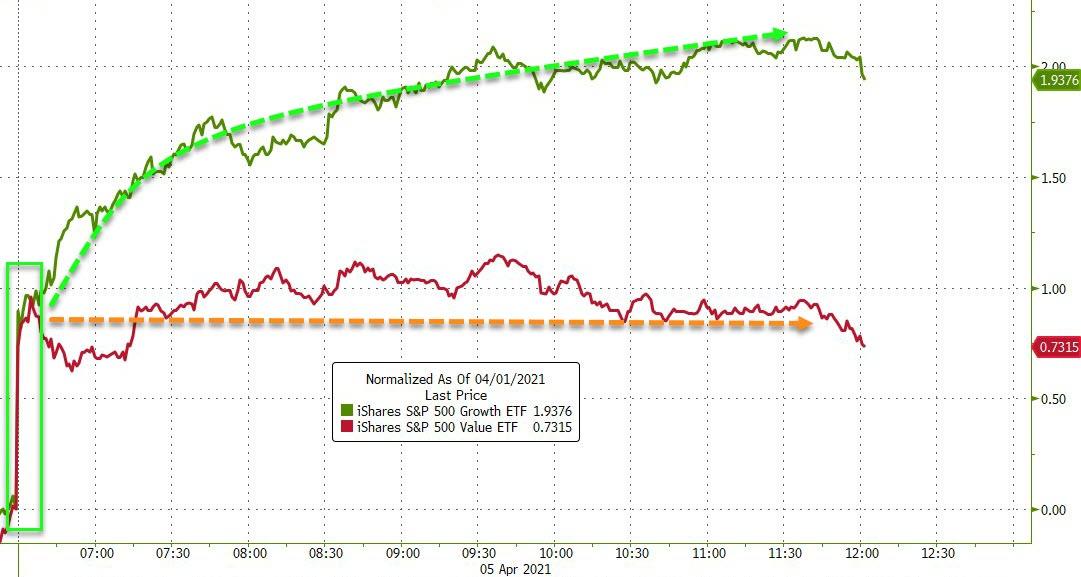
“Growth” outperformed “value” by a wide margin leaving some analysts wondering if the value surge has come to an end in favor of growth. However, these swings can reverse at any time, and it’s wise to be exposed to both.
Initial Jobless Claims disappointed again with 744k Americans filing for new unemployment benefits for the first time, far worse than the expected 694k. When looking at the bigger picture, it’s revealed that over 18 million Americans are still on government benefits, despite broad re-openings across the country.
Still, optimism runs rampant that the next few months will see huge job gains with some forecasting that employment will return to pre-pandemic levels by the end of the year. I am not sure if that view is simply designed to keep the market pumped up, because that does not seem realistic to me, as the recovery is spotty or uneven at best.
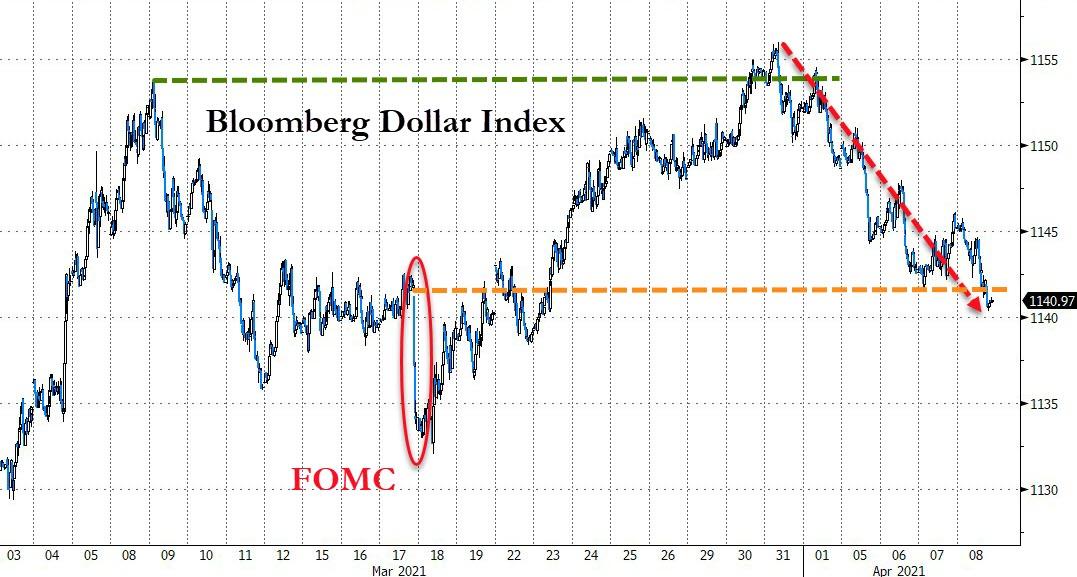
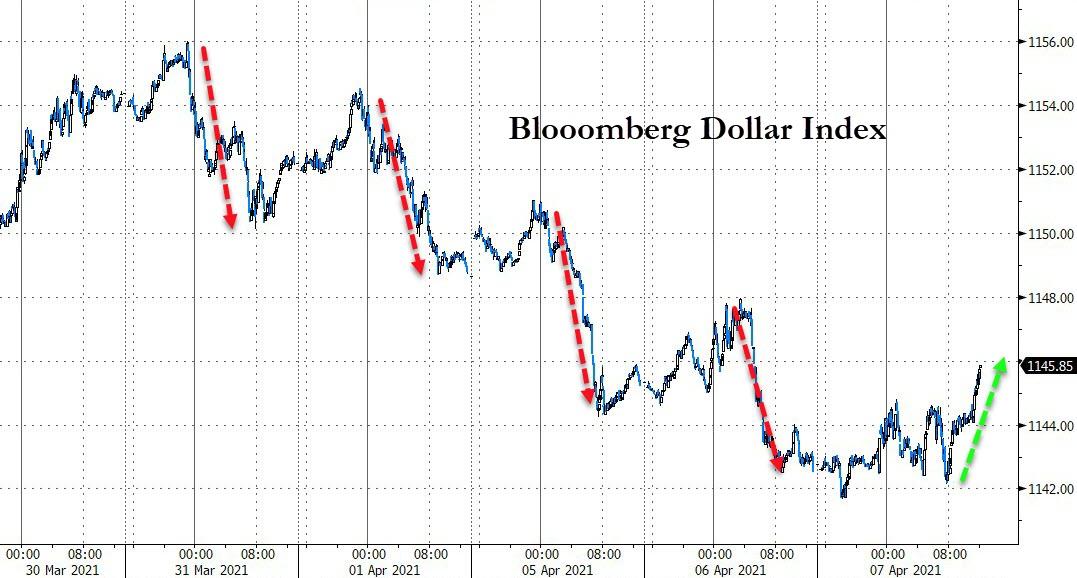
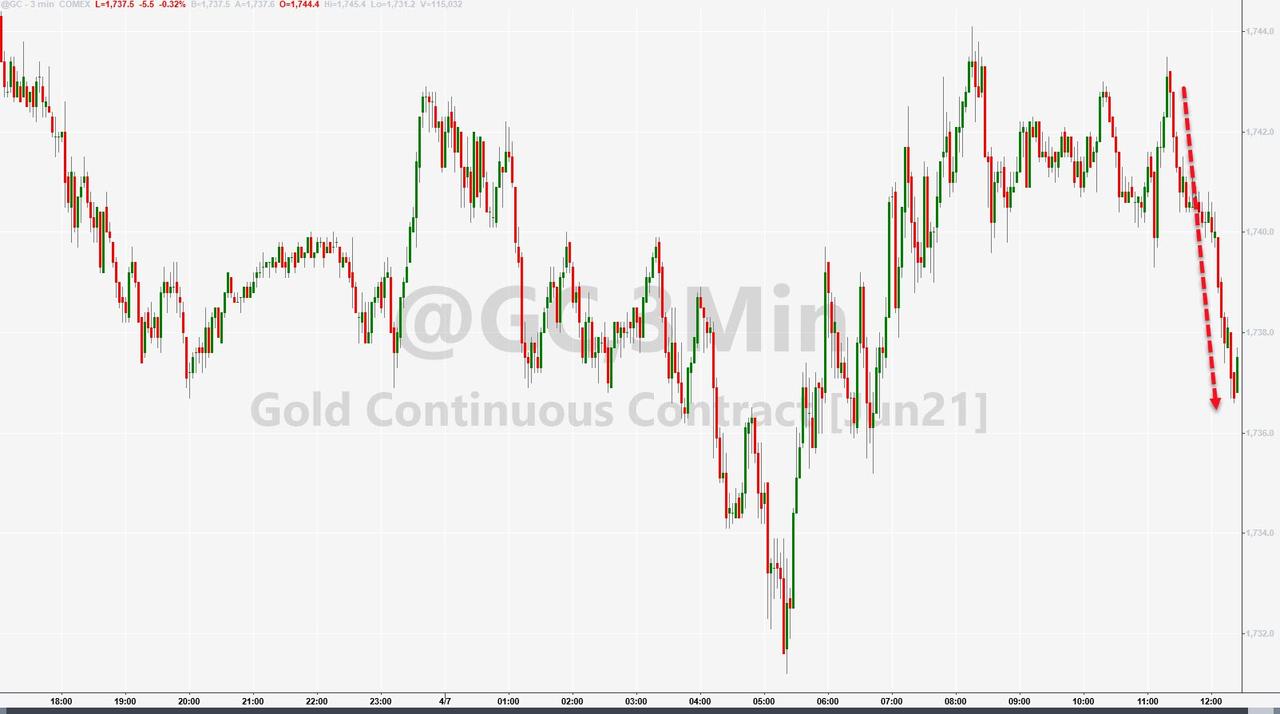
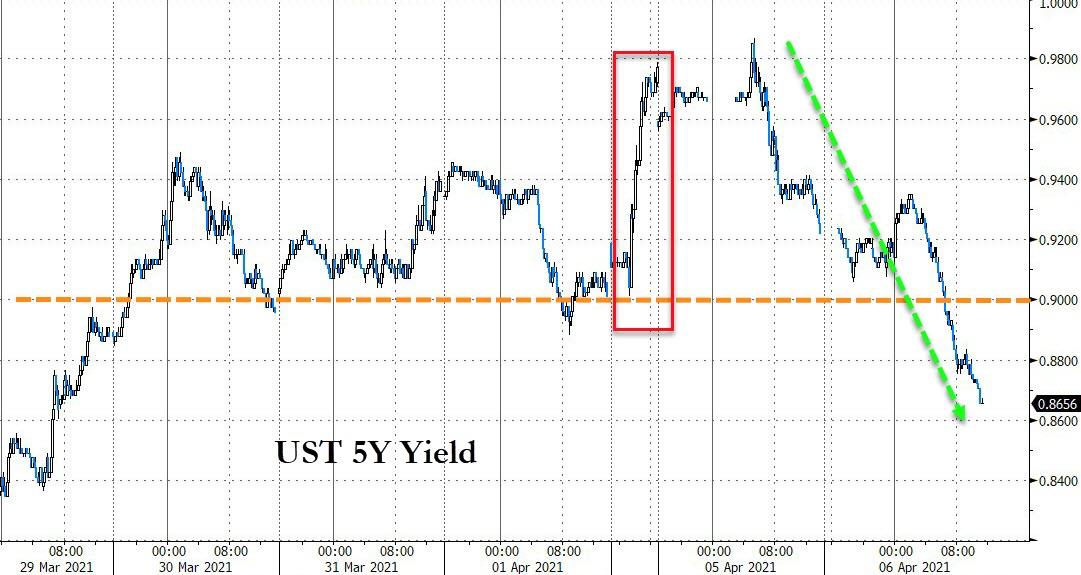
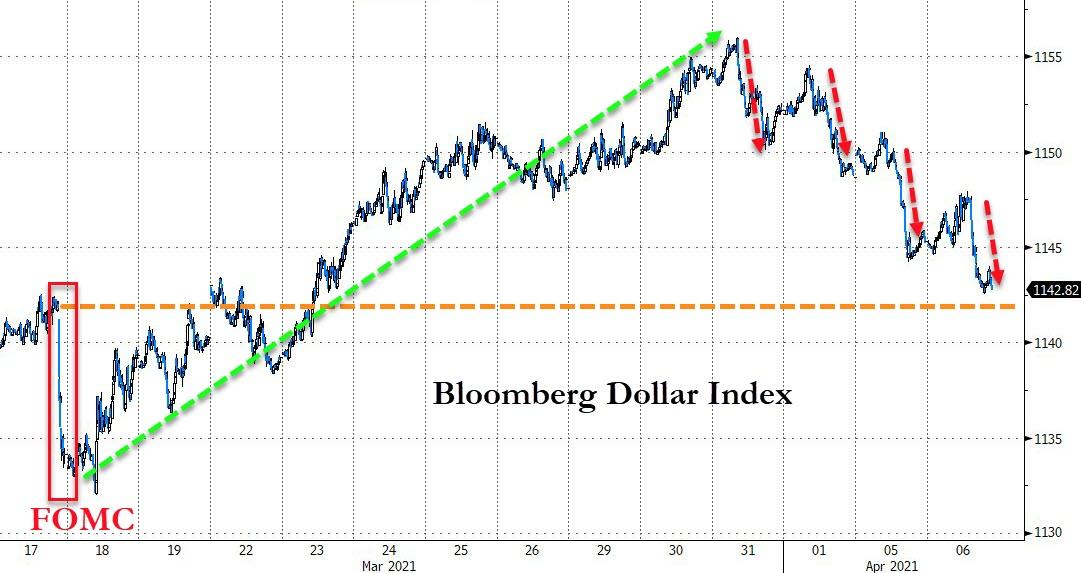
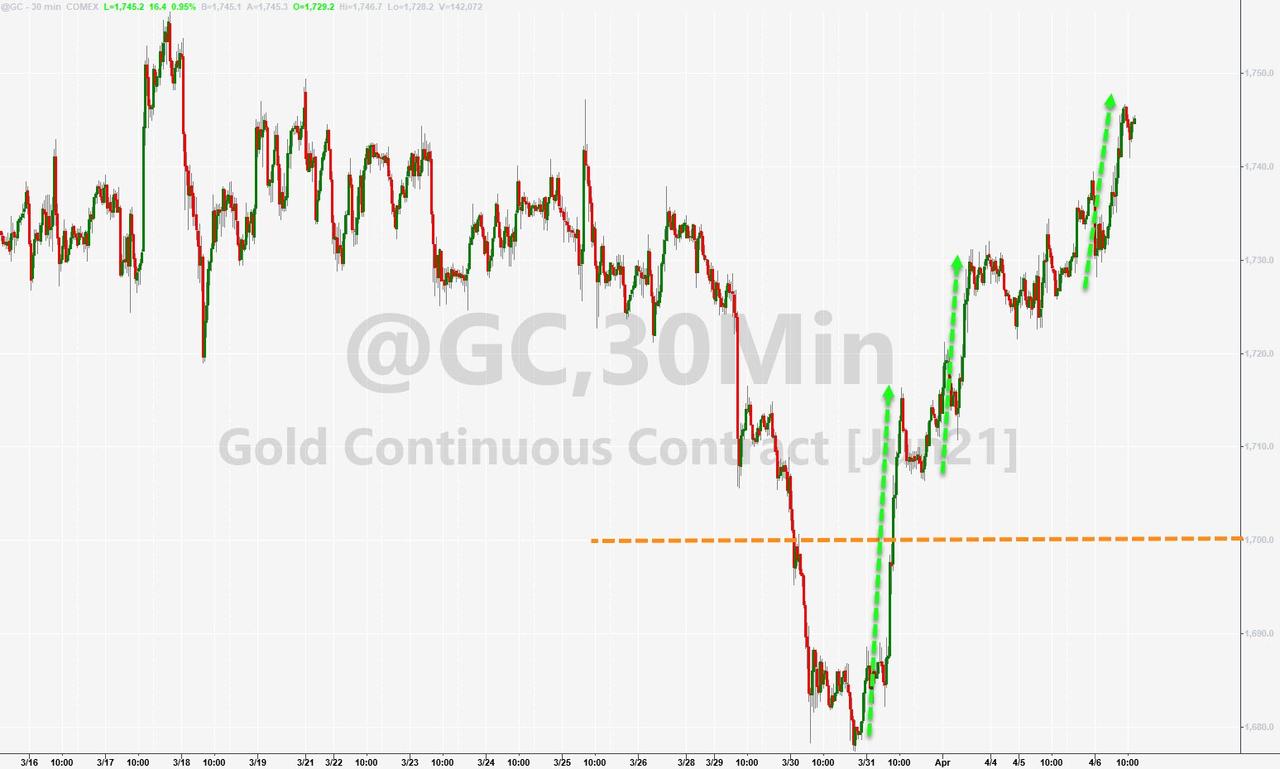
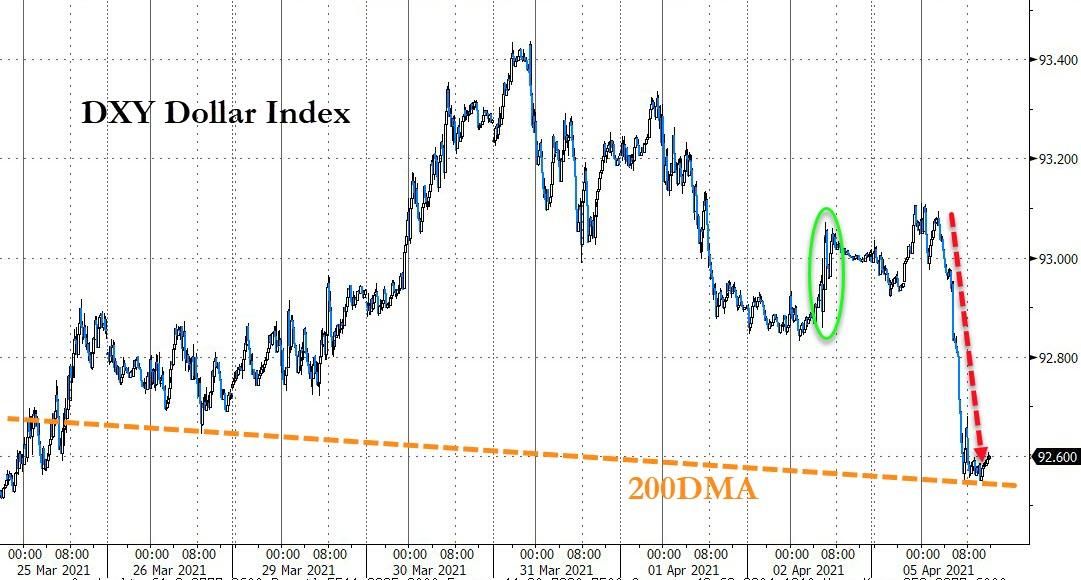
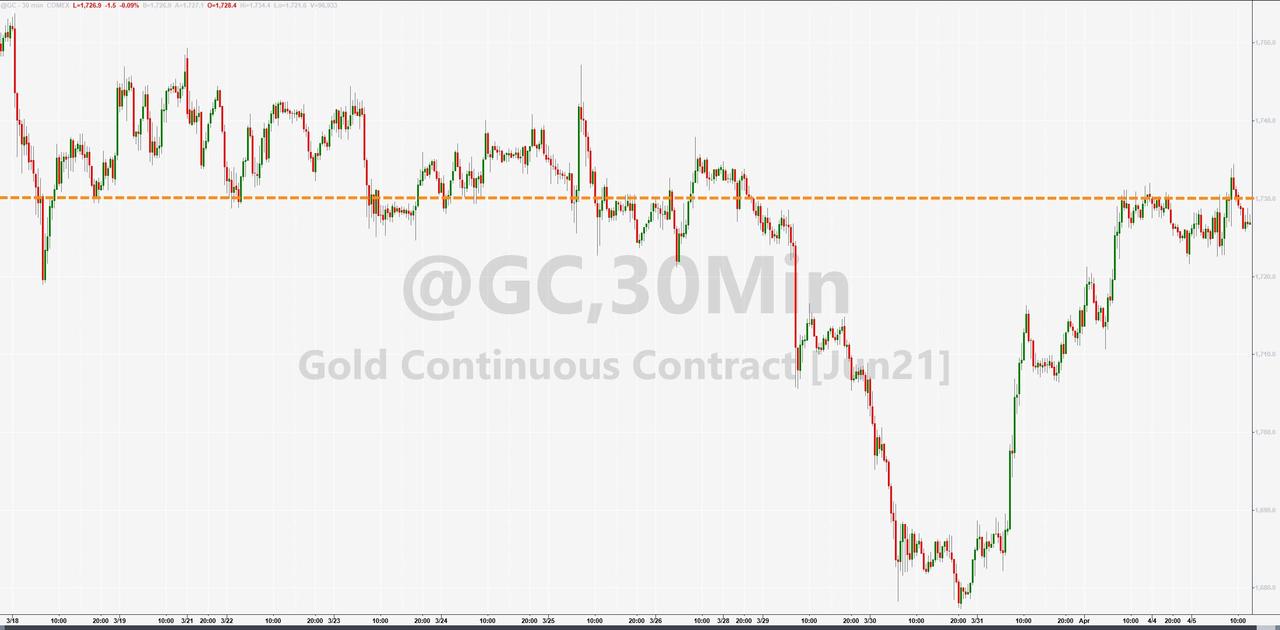
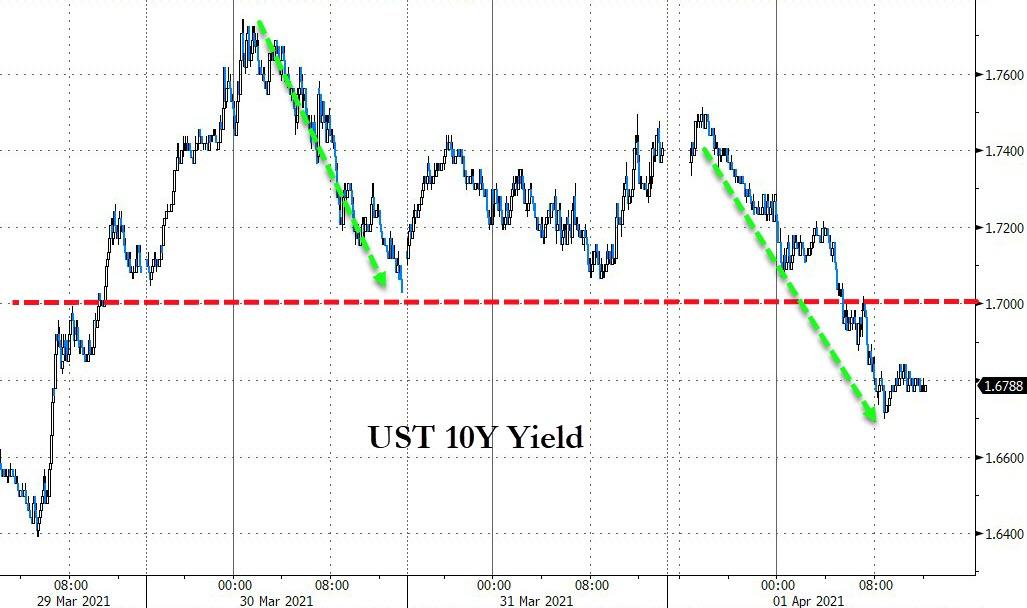
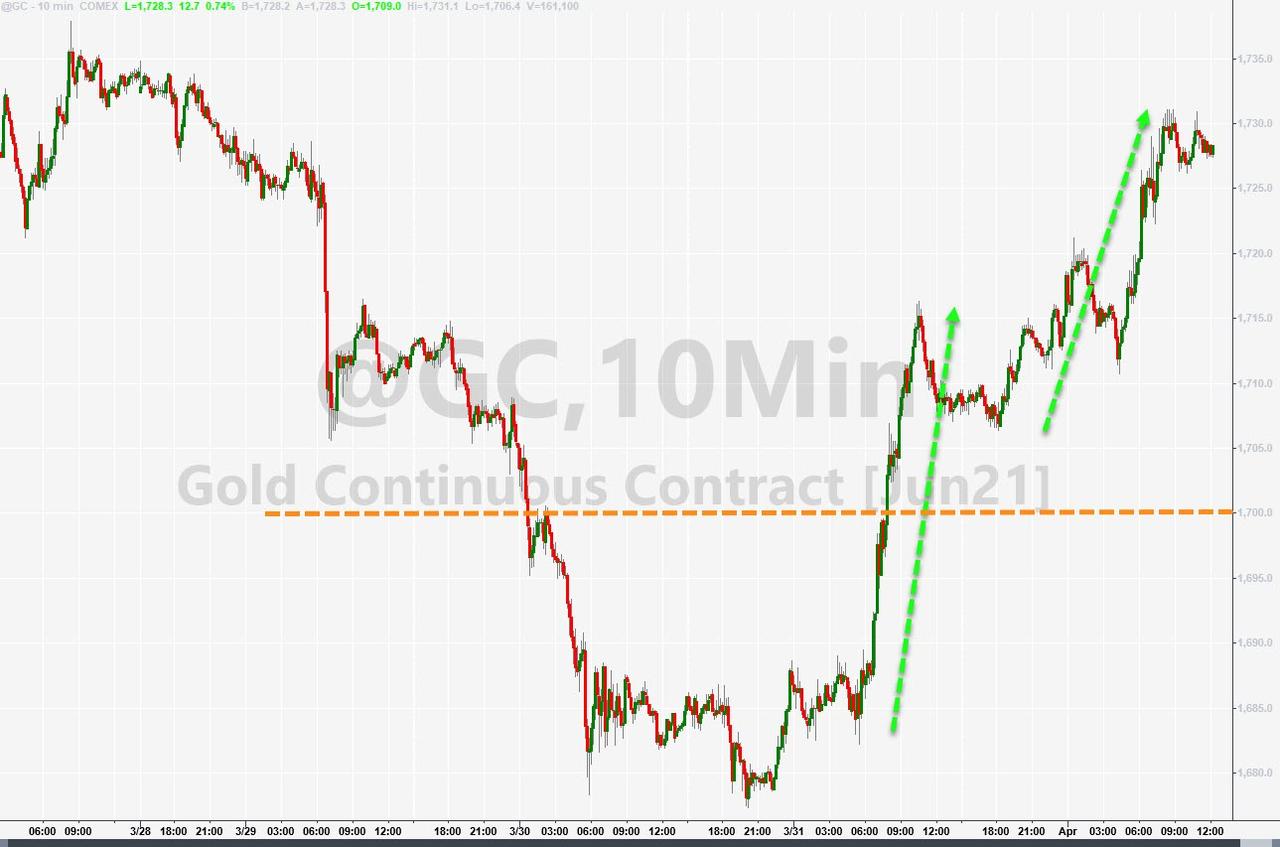
The US Dollar resumed its downward trend, while 10-year bond yields slipped again to reach 1.65%. This combo helped the gold ETF GLD to bounce nicely by gaining +1.06%, on par with the Nasdaq advance.
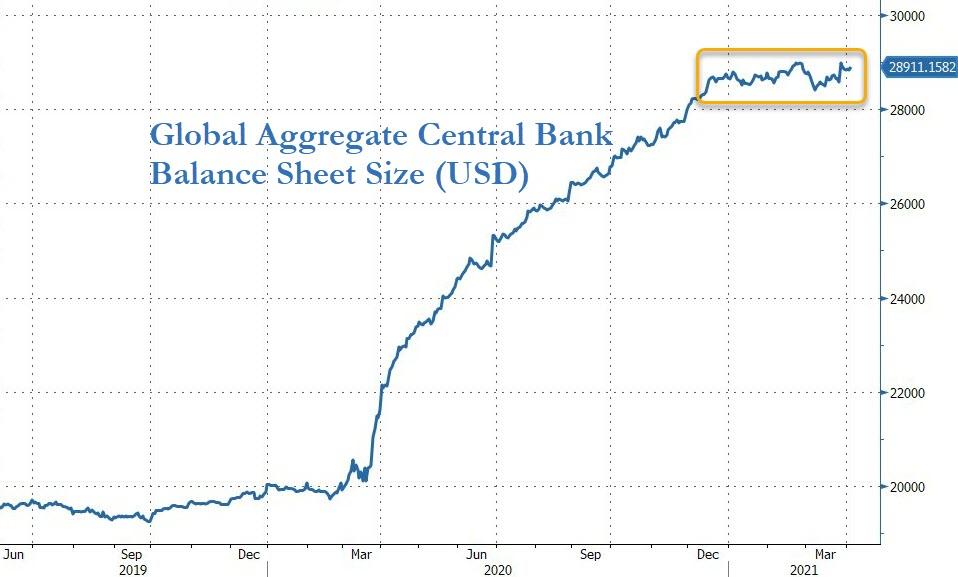
As we go forward, financial support via fiscal policy, and continued asset purchases by the Fed, will be the foundation for further advances.
Read More
