
- Moving the markets
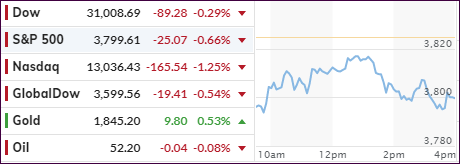
The futures market already indicated a negative bias with US equities and global stocks dropping off their record highs on Friday. A sense of caution dashed across trading desks, as questionable economic data, hopes for more stimulus, political turmoil and the continued barrage of Covid-19 cases combined to give the bears something to cheer about.
For sure, the first week of 2021 was a strong one for equities, so it’s no surprise to see a pullback in the making, which clobbered the Nasdaq more than the other two major indexes. TSLA and TWTR were the biggest losers with the latter reaping the “rewards” of having banned 1,000s of subscribers.
Gold was in for a wild ride, up some 2.5% in the futures markets, then dumping into the red, recovering nicely to catch up to its early gains, but fading into the close but with a +0.56% profit. Unfortunately, the Gold ETF GLD did not keep up and ended down -0.18%.
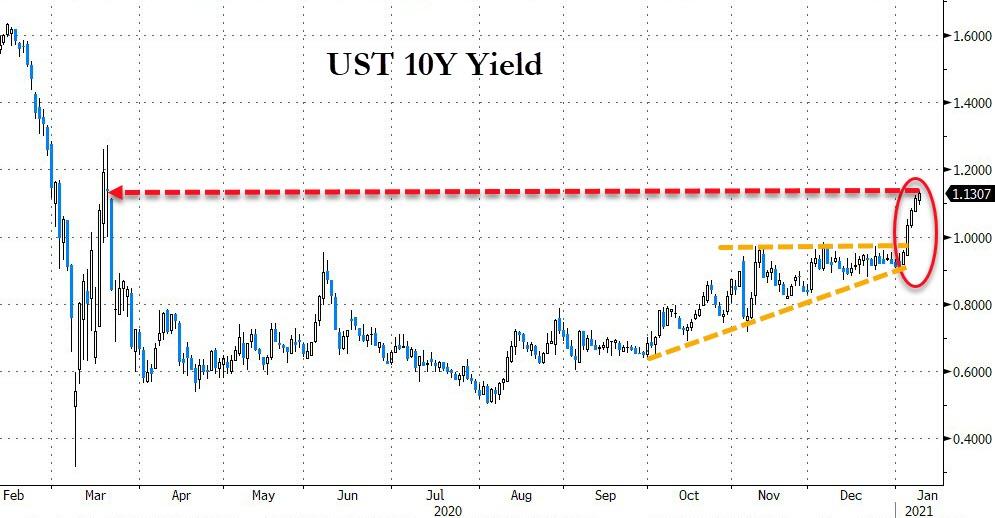
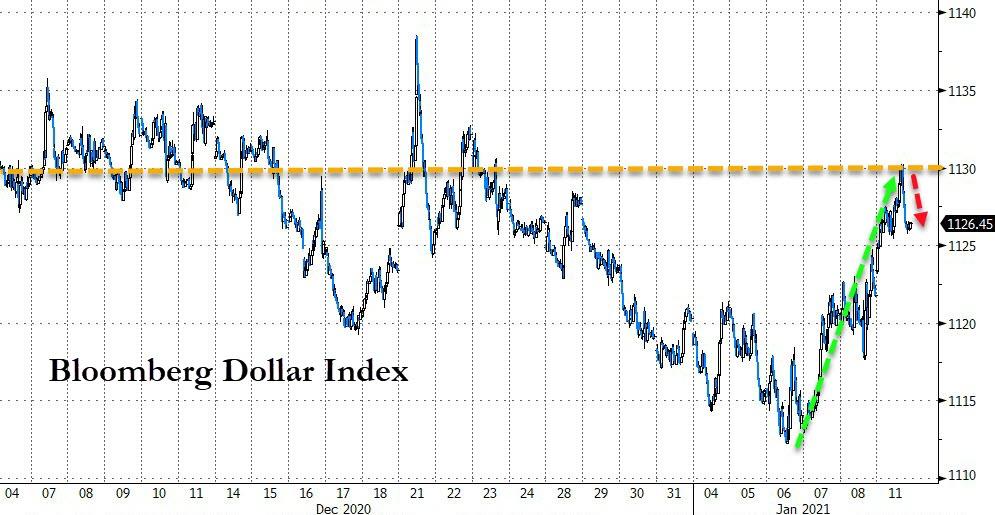
The precious metal’s roller coaster was triggered by spiking bond yields with the 10-year now having clearly busted through the 1% level and settling at 1.13%. The US Dollar continued its ascent out of the basement and surged higher today but faded into the close.
Of course, the political grandstanding gave an assist to today’s weakness:
“When you listen to the speaker of the House … basically just saying the president is the most dangerous man, you got a week of danger and the markets don’t like it,” CNBC’s Jim Cramer said on “Squawk on the Street.”
It promises to be a week of uncertainty and volatility.
2. ETFs in the Spotlight
In case you missed the announcement and description of this section, you can read it here again.
It features some of the 10 broadly diversified domestic and sector ETFs from my HighVolume list as posted every Saturday. Furthermore, they are screened for the lowest MaxDD% number meaning they have been showing better resistance to temporary sell offs than all others over the past year.
The below table simply demonstrates the magnitude with which these ETFs are fluctuating above or below their respective individual trend lines (%+/-M/A). A break below, represented by a negative number, shows weakness, while a break above, represented by a positive percentage, shows strength.
For hundreds of ETF choices, be sure to reference Thursday’s StatSheet.
For this current domestic “Buy” cycle, here’s how some our candidates have fared:
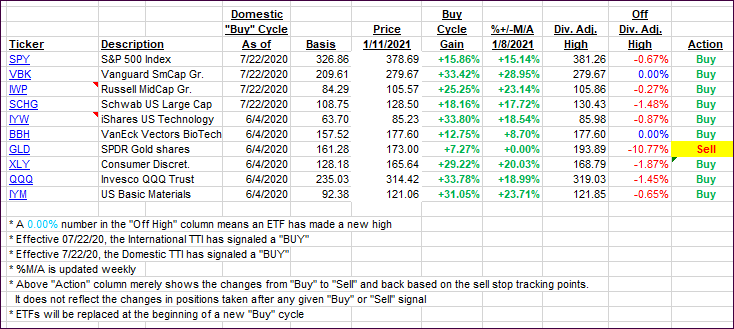
Click image to enlarge.
Again, the %+/-M/A column above shows the position of the various ETFs in relation to their respective long-term trend lines, while the trailing sell stops are being tracked in the “Off High” column. The “Action” column will signal a “Sell” once the -8% point has been taken out in the “Off High” column. For more volatile sector ETFs, the trigger point is -10%.
3. Trend Tracking Indexes (TTIs)
Our TTIs slipped of their highs, after the markets corrected moderately.
This is how we closed 1/11/2021:
Domestic TTI: +20.36% above its M/A (prior close +20.50%)—Buy signal effective 07/22/2020.
International TTI: +19.40% above its M/A (prior close +19.90%)—Buy signal effective 07/22/2020.
Disclosure: I am obliged to inform you that I, as well as my advisory clients, own some of the ETFs listed in the above table. Furthermore, they do not represent a specific investment recommendation for you, they merely show which ETFs from the universe I track are falling within the specified guidelines.
Contact Ulli