
- Moving the markets
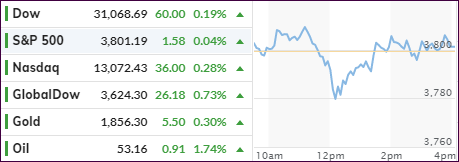
After yesterday’s modest pullback, the major indexes continued to aimlessly vacillate around their respective unchanged lines throughout most of the session. A last hour push created enough upward momentum to assure a green close.
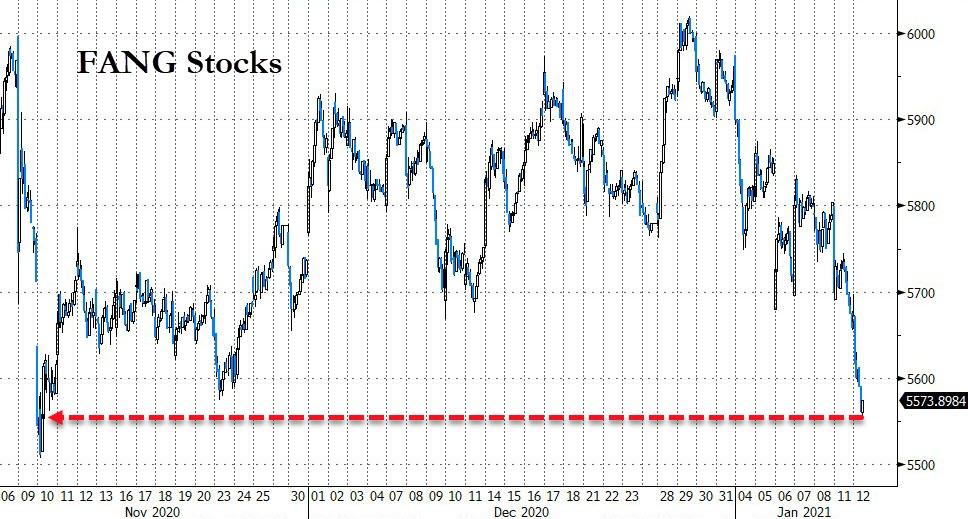
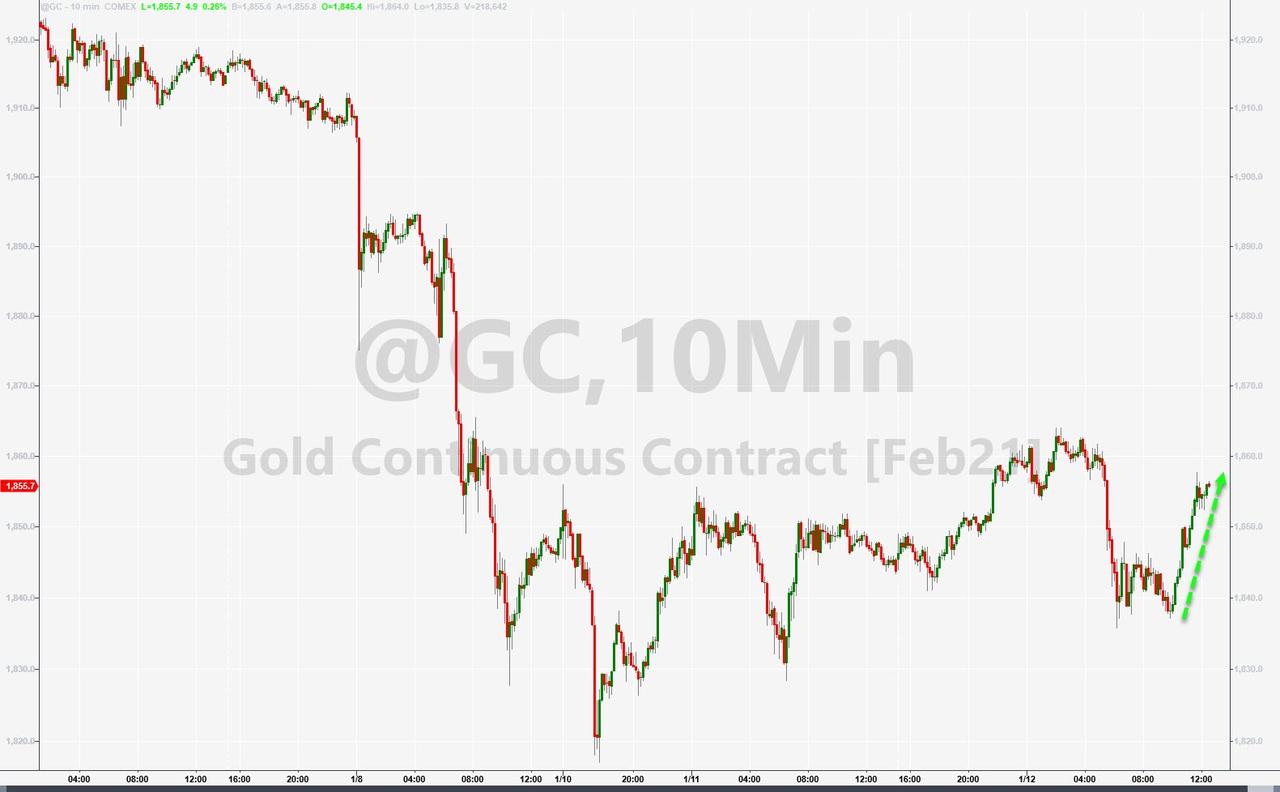
The Nasdaq led the charge with a gain +0.28%, despite the FANGs tanking. But, as has been the case lately, SmallCaps ruled jumping +1.56%, which was closely followed by MidCaps sporting a solid +0.85%. Even GLD, which had slipped during the recent past, finally managed to score +0.62%.
That means for the year, the Nasdaq is about unchanged while SmallCaps are the “dominator” with a chest pounding advance of +7.5%.
Assisting the move higher was the 2021 short squeeze, which appears to continue unabated and seems to be a most reliable tool by the algos to shove the markets higher, as the shorts need to cover, thereby assisting the levitation.
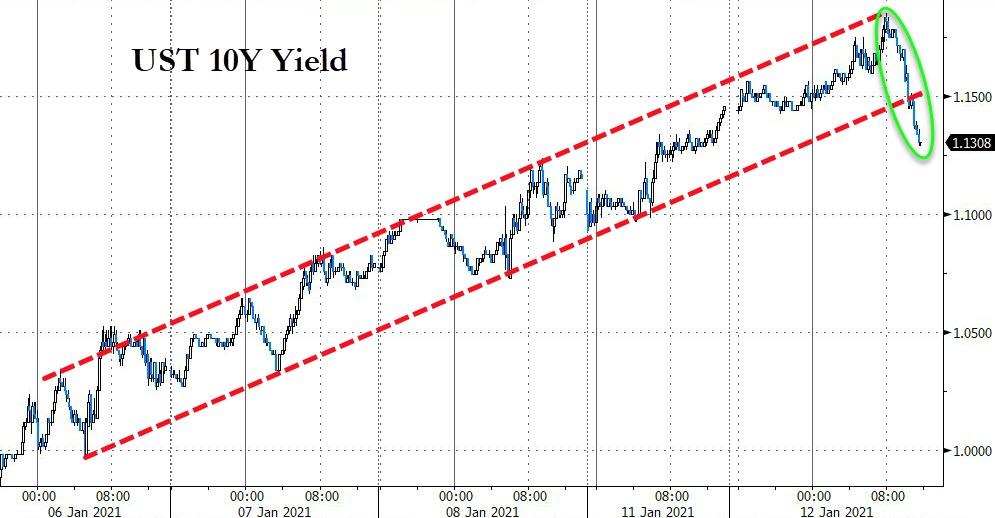
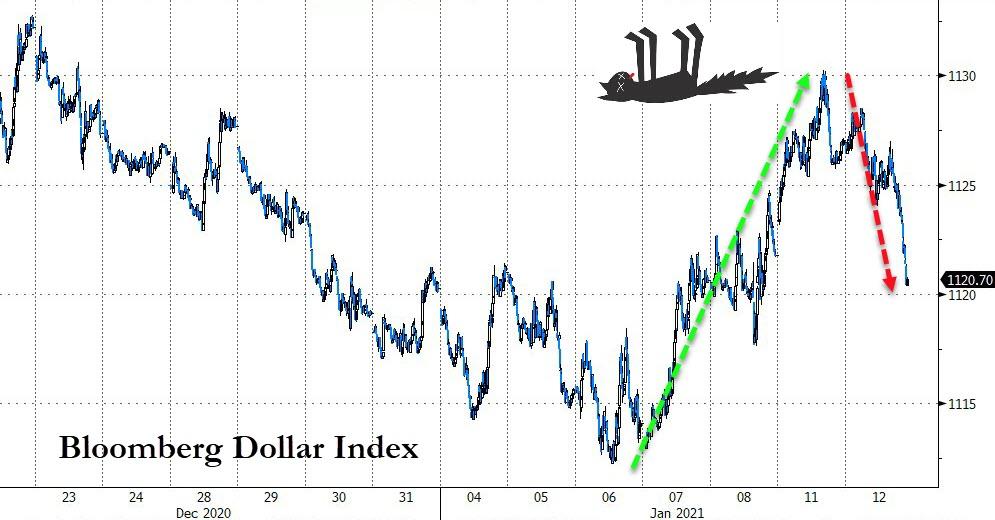
Bond yields were in a world of their own when, after an early bounce higher, the bottom fell out and yields tumbled and broke below a crucial but short-term uptrend channel. That’s what kept GLD in the green late in the session, while a collapsing US Dollar lent a helping hand as well.
I always enjoy Bloomberg’s comparisons of current to past market events. Most will not align with history, but it remains to be seen, if the latest one will:
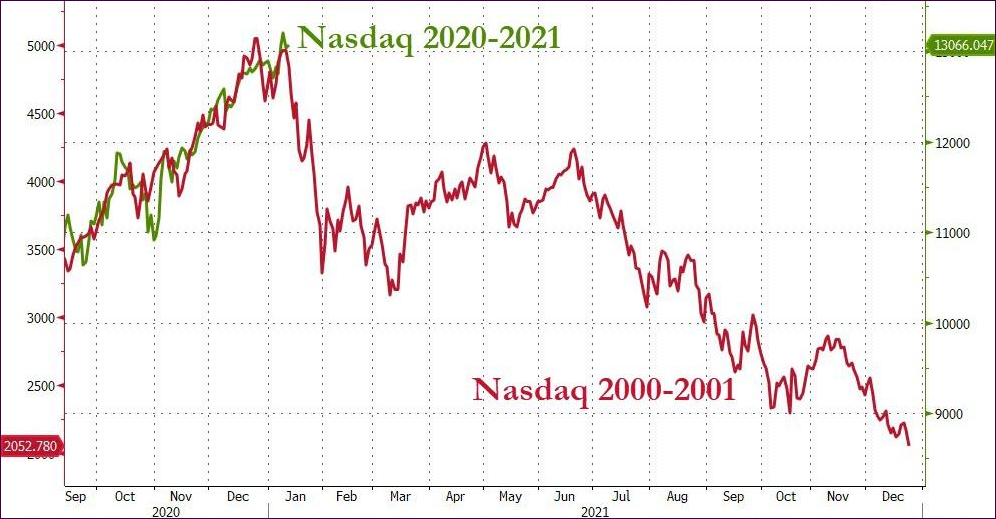
For sure, if this scenario plays out, would it not be a really good idea to have an exit strategy?
2. ETFs in the Spotlight
In case you missed the announcement and description of this section, you can read it here again.
It features some of the 10 broadly diversified domestic and sector ETFs from my HighVolume list as posted every Saturday. Furthermore, they are screened for the lowest MaxDD% number meaning they have been showing better resistance to temporary sell offs than all others over the past year.
The below table simply demonstrates the magnitude with which these ETFs are fluctuating above or below their respective individual trend lines (%+/-M/A). A break below, represented by a negative number, shows weakness, while a break above, represented by a positive percentage, shows strength.
For hundreds of ETF choices, be sure to reference Thursday’s StatSheet.
For this current domestic “Buy” cycle, here’s how some our candidates have fared:
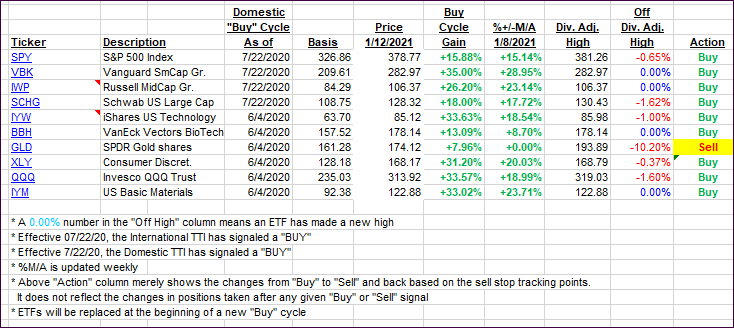
Click image to enlarge.
Again, the %+/-M/A column above shows the position of the various ETFs in relation to their respective long-term trend lines, while the trailing sell stops are being tracked in the “Off High” column. The “Action” column will signal a “Sell” once the -8% point has been taken out in the “Off High” column. For more volatile sector ETFs, the trigger point is -10%.
3. Trend Tracking Indexes (TTIs)
Our TTIs rebounded from yesterday’s pullback.
This is how we closed 1/12/2021:
Domestic TTI: +21.31% above its M/A (prior close +20.36%)—Buy signal effective 07/22/2020.
International TTI: +20.23% above its M/A (prior close +19.40%)—Buy signal effective 07/22/2020.
Disclosure: I am obliged to inform you that I, as well as my advisory clients, own some of the ETFs listed in the above table. Furthermore, they do not represent a specific investment recommendation for you, they merely show which ETFs from the universe I track are falling within the specified guidelines.
Contact Ulli