
- Moving the markets
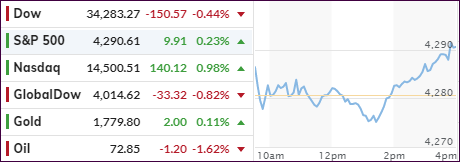
The overall market struggled for direction except for the Nasdaq, which started the week strong and pushed the index to another all-time high.
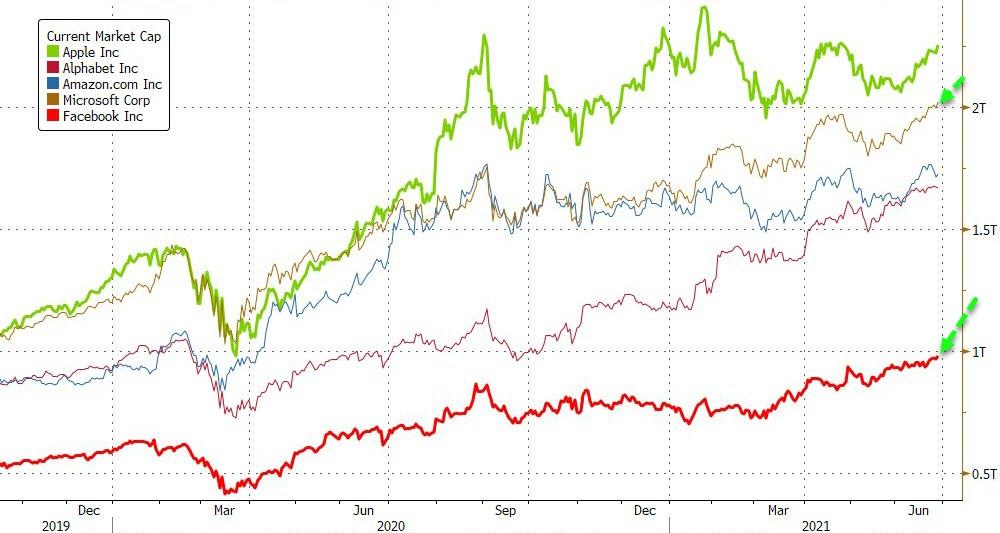
The tech sector dominated with Facebook contributing via a 4% jump, after a US court dismissed an antitrust suit against the company.
Semiconductors also showed signs of life, while Boeing headed the wrong way, after issues with regulators could not be resolved, thereby keeping the Dow in the red throughout the session.
The S&P 500 meandered around its unchanged line all day, without making much headway, until a last hour boost pushed the index not only into the green but also into record territory.
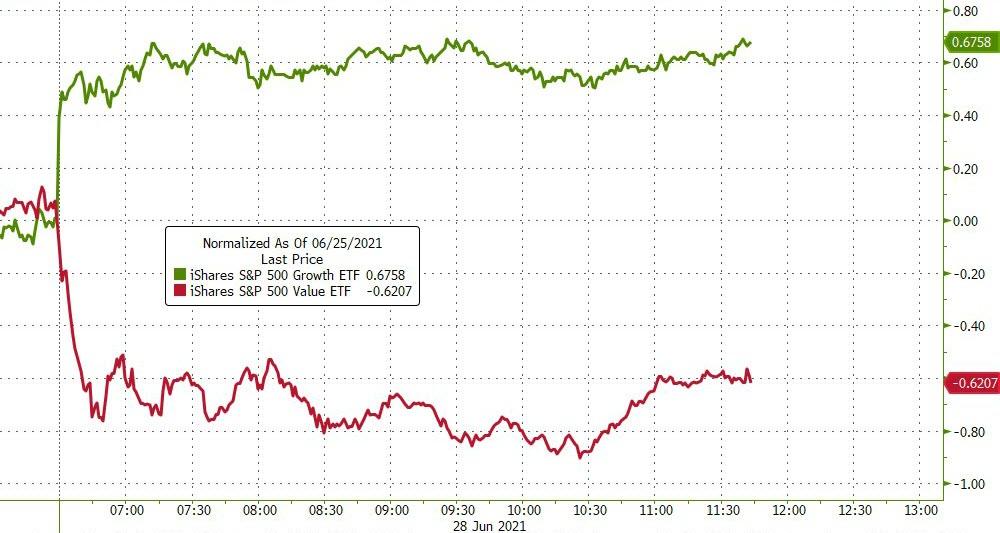
Today, “value” got skunked and “growth” got pumped, with RPV giving back some 1.44%, as bond yields plunged after Friday’s spike, a move which totally unraveled today.
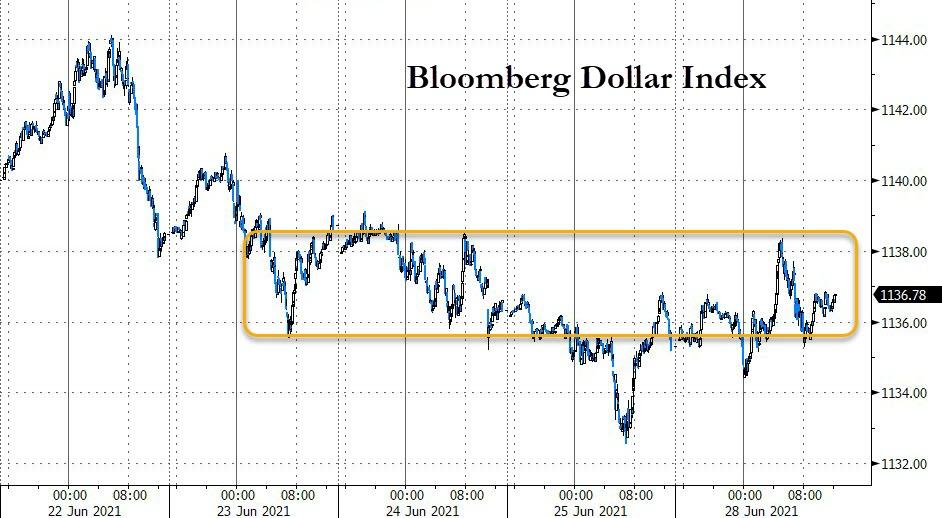
The US Dollar Index did not go anywhere and, in combination with sinking yields helped gold to some early gains, but in the end, it turned more or less into a break even scenario.
With two more trading days to go in June, it looks likely the S&P 500 will score another winning month, despite having briefly dipped into the negative on the 18th, a pullback which was quickly recovered.
2. ETFs in the Spotlight
In case you missed the announcement and description of this section, you can read it here again.
It features some of the 10 broadly diversified domestic and sector ETFs from my HighVolume list as posted every Saturday. Furthermore, they are screened for the lowest MaxDD% number meaning they have been showing better resistance to temporary sell offs than all others over the past year.
The below table simply demonstrates the magnitude with which these ETFs are fluctuating above or below their respective individual trend lines (%+/-M/A). A break below, represented by a negative number, shows weakness, while a break above, represented by a positive percentage, shows strength.
For hundreds of ETF choices, be sure to reference Thursday’s StatSheet.
For this current domestic “Buy” cycle, here’s how some our candidates have fared:
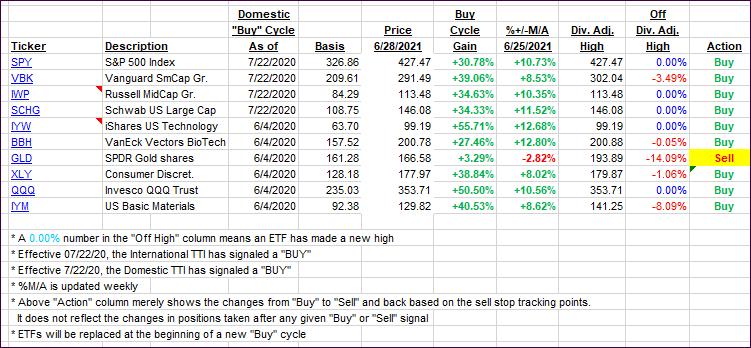
Click image to enlarge.
Again, the %+/-M/A column above shows the position of the various ETFs in relation to their respective long-term trend lines, while the trailing sell stops are being tracked in the “Off High” column. The “Action” column will signal a “Sell” once the -8% point has been taken out in the “Off High” column. For more volatile sector ETFs, the trigger point is -10%.
3. Trend Tracking Indexes (TTIs)
Our TTIs pulled back despite the S&P 500 and Nasdaq scoring new highs.
This is how we closed 06/28/2021:
Domestic TTI: +13.05% above its M/A (prior close +13.53%)—Buy signal effective 07/22/2020.
International TTI: +10.66% above its M/A (prior close +11.53%)—Buy signals effective 07/22/2020.
Disclosure: I am obliged to inform you that I, as well as my advisory clients, own some of the ETFs listed in the above table. Furthermore, they do not represent a specific investment recommendation for you, they merely show which ETFs from the universe I track are falling within the specified guidelines.
All linked charts above are courtesy of Bloomberg via ZeroHedge.
Contact Ulli