
ETF Tracker StatSheet
You can view the latest version here.
THE BULLISH BEAT GOES ON
- Moving the markets
Last Friday’s market plunge is now being looked at as a vanishing point in the rearview mirror with stocks having picked up their bullish momentum and the S&P 500 rising to another record, while closing out its best week since April.
Despite a slowdown during mid-week, momentum picked up, and we rallied into the weekend supported by traders’ belief that higher inflation will be temporary, as the economy continues to make strides toward a recovery from Covid-19.
Added one senior analyst from Commonwealth Financial:
“This provided support to the Fed’s argument that inflation is transitory and will help allay fears that we are witnessing runaway inflation and should continue to provide support to risk assets such as equities.”
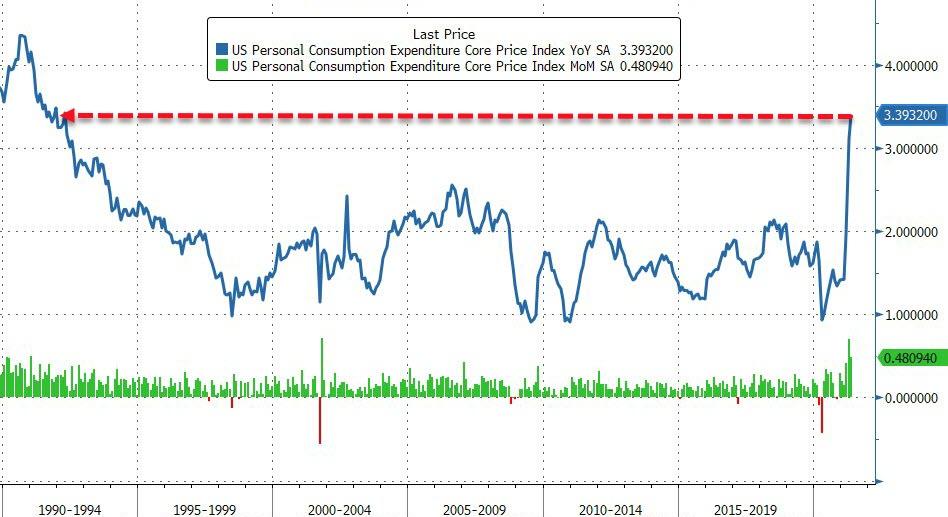
Questioning the accuracy of that belief is Bloomberg’s chart showing that the Fed’s favorite inflation indicator hit a 30-year high, which makes me disagree with the continued jawboning of inflation being transitory.
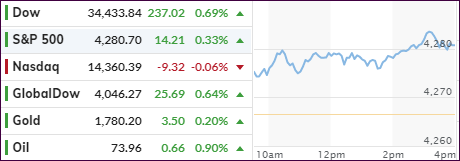
Be that as it may, what matters is that the markets appear to be in tune with bullish sentiment causing the rally to go on. The major indexes are all up for the week, with the S&P 500 and Dow adding 2.6% each, while the Nasdaq led with 3.2%.
Bank shares received support from the Fed’s announcement that the banking industry could easily withstand a severe recession, as their annual stress test showed that 23 institutions remain well above minimum capital levels, as CNBC reported. As a result, the financial sector ETF (XLF) rallied 1.21% on the day.
“Value” outperformed “growth” this week, but both showed strong tendencies and flip-flopped back and forth. Bond yields went sideways mid-week and spiked today, as the PCE (Personal Consumption Index) soared.
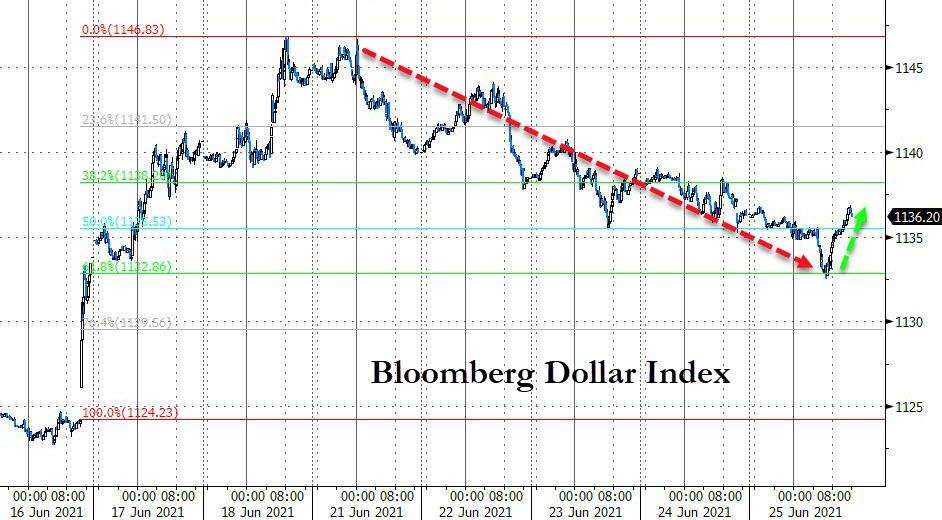
The US Dollar index has been retreating all week but managed to bounce today, yet it was not enough of a move to pull down gold. The precious metal managed to eke out a tiny gain of +0.19%.
With three more trading days left, it looks like the widely cited adage “sell in May and go away” may not materialize in June.
2. ETFs in the Spotlight
In case you missed the announcement and description of this section, you can read it here again.
It features some of the 10 broadly diversified domestic and sector ETFs from my HighVolume list as posted every Saturday. Furthermore, they are screened for the lowest MaxDD% number meaning they have been showing better resistance to temporary sell offs than all others over the past year.
The below table simply demonstrates the magnitude with which these ETFs are fluctuating above or below their respective individual trend lines (%+/-M/A). A break below, represented by a negative number, shows weakness, while a break above, represented by a positive percentage, shows strength.
For hundreds of ETF choices, be sure to reference Thursday’s StatSheet.
For this current domestic “Buy” cycle, here’s how some our candidates have fared:
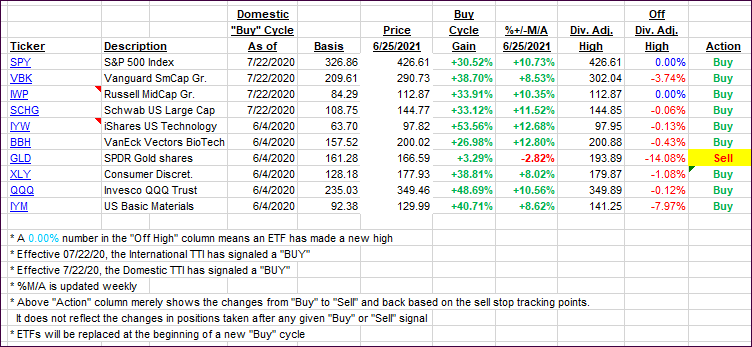
Click image to enlarge.
Again, the %+/-M/A column above shows the position of the various ETFs in relation to their respective long-term trend lines, while the trailing sell stops are being tracked in the “Off High” column. The “Action” column will signal a “Sell” once the -8% point has been taken out in the “Off High” column. For more volatile sector ETFs, the trigger point is -10%.
3. Trend Tracking Indexes (TTIs)
Our TTIs barely changed from yesterday’s advance.
This is how we closed 06/25/2021:
Domestic TTI: +13.53% above its M/A (prior close +13.42%)—Buy signal effective 07/22/2020.
International TTI: +11.53% above its M/A (prior close +11.78%)—Buy signals effective 07/22/2020.
Disclosure: I am obliged to inform you that I, as well as my advisory clients, own some of the ETFs listed in the above table. Furthermore, they do not represent a specific investment recommendation for you, they merely show which ETFs from the universe I track are falling within the specified guidelines.
All linked charts above are courtesy of Bloomberg via ZeroHedge.
———————————————————-
WOULD YOU LIKE TO HAVE YOUR INVESTMENTS PROFESSIONALLY MANAGED?
Do you have the time to follow our investment plans yourself? If you are a busy professional who would like to have his portfolio managed using our methodology, please contact me directly or get more details here.
———————————————————
Back issues of the ETF Tracker are available on the web.
Contact Ulli