
- Moving the markets
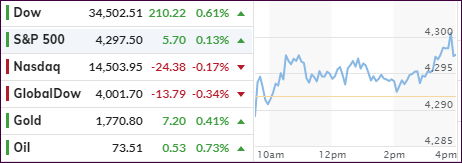
The major indexes continued to vacillate around record territory, as the last day of the month and quarter ended. The Dow took the lead with the S&P 500 lagging and the Nasdaq sinking slightly into the red.
For June, the S&P 500 managed to eke out again of some 2.2%, despite having dropped into the red during mid-month, yet in the end, the index closed the quarter at a new high. At the same time, it recorded its fifth positive month in a row.
It’s been interesting to observe how traders and investors have simply shrugged off the ever-present and seemingly worsening inflation numbers. All based on the assumption that the economic comeback will proceed as hoped, while the Fed is assumed to continue throwing assists via its loose monetary policies.
So, what usually happens after the markets close out a good first half of the year? CNBC added this comment:
Good first halves for the market usually bode well for the rest of the year. Whenever there has been a double-digit gain in the first half, the Dow and S&P 500 have never ended that year with an annual decline, according to Refinitiv data going back to 1950.
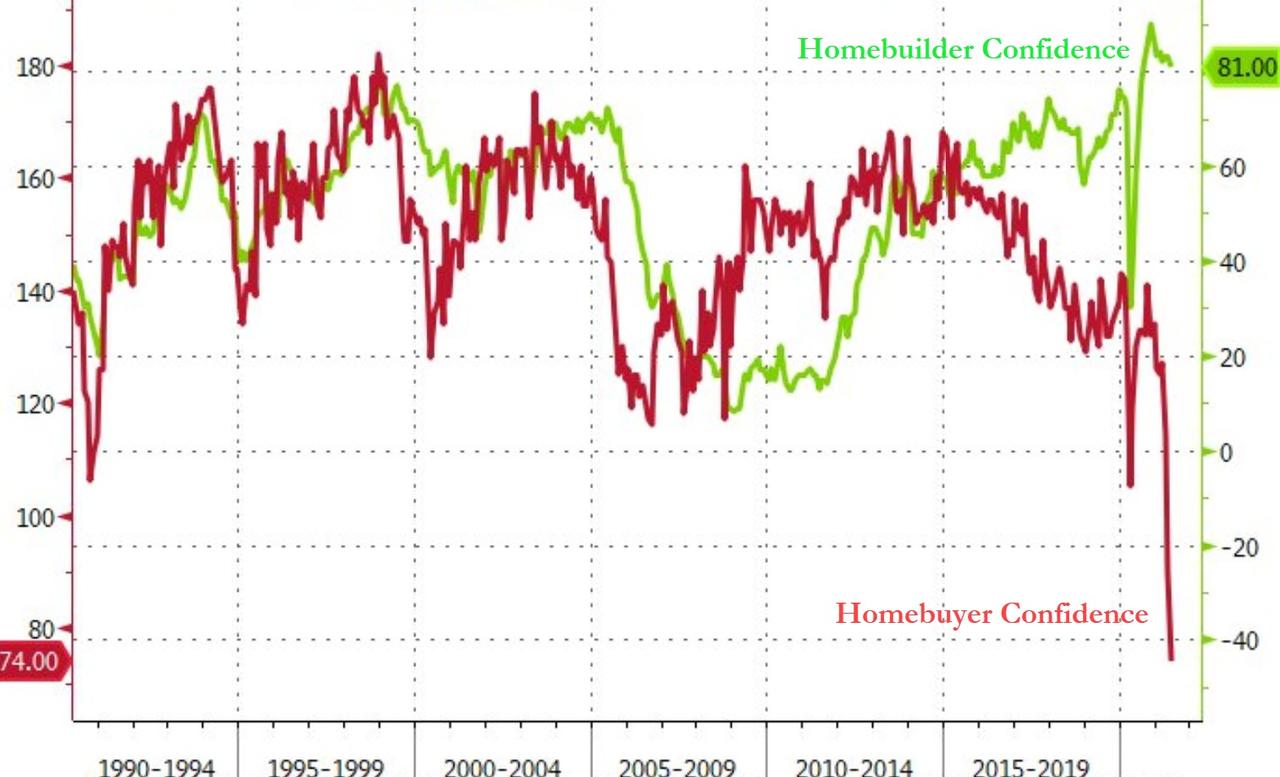
On the economic front, Pending Home Sales picked up some pace and surged in May. However, Mortgage Applications crashed, as we witnessed two opposing forces at work, namely rising Homebuilder Confidence and collapsing Homebuyer Confidence, a battle that most likely will be won by the Homebuyers.
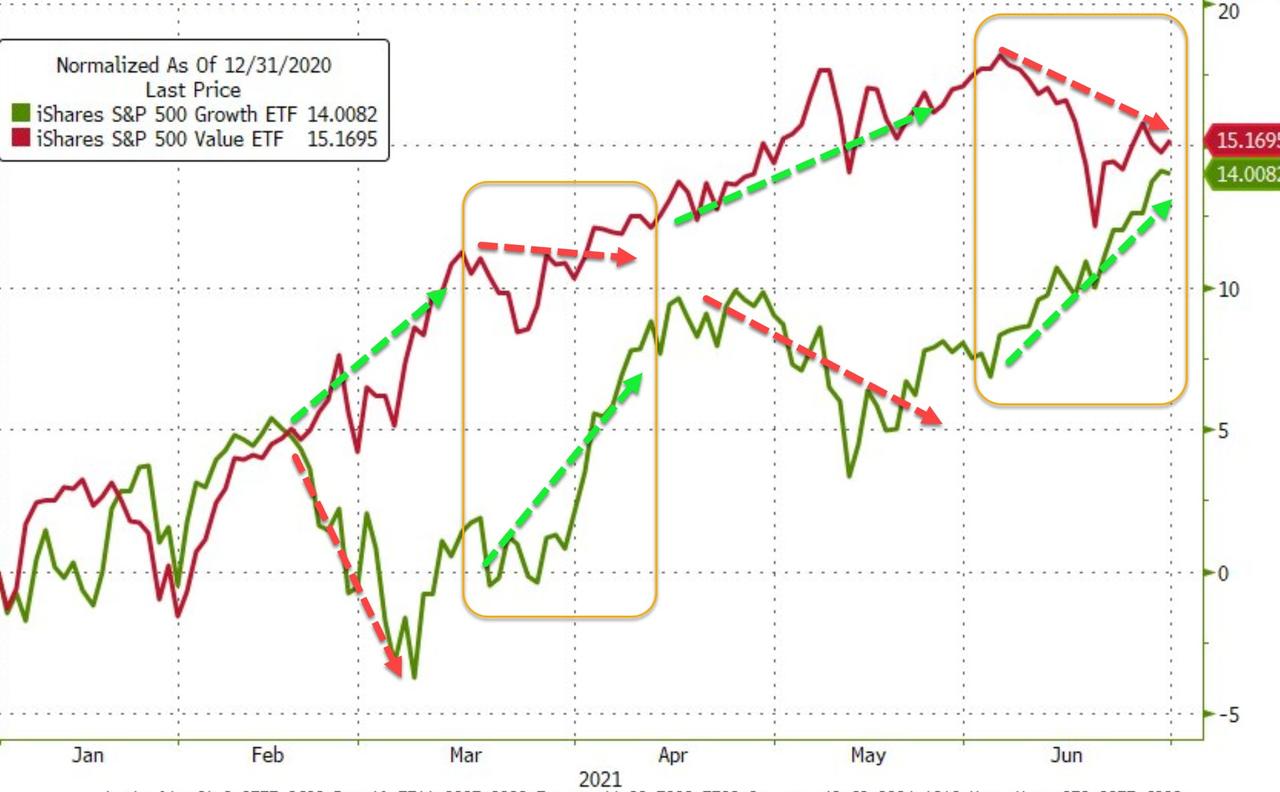
“Growth” and “Value” have been in a skirmish all year with “Value” leading but “Growth” catching up, as Bloomberg’s chart shows.
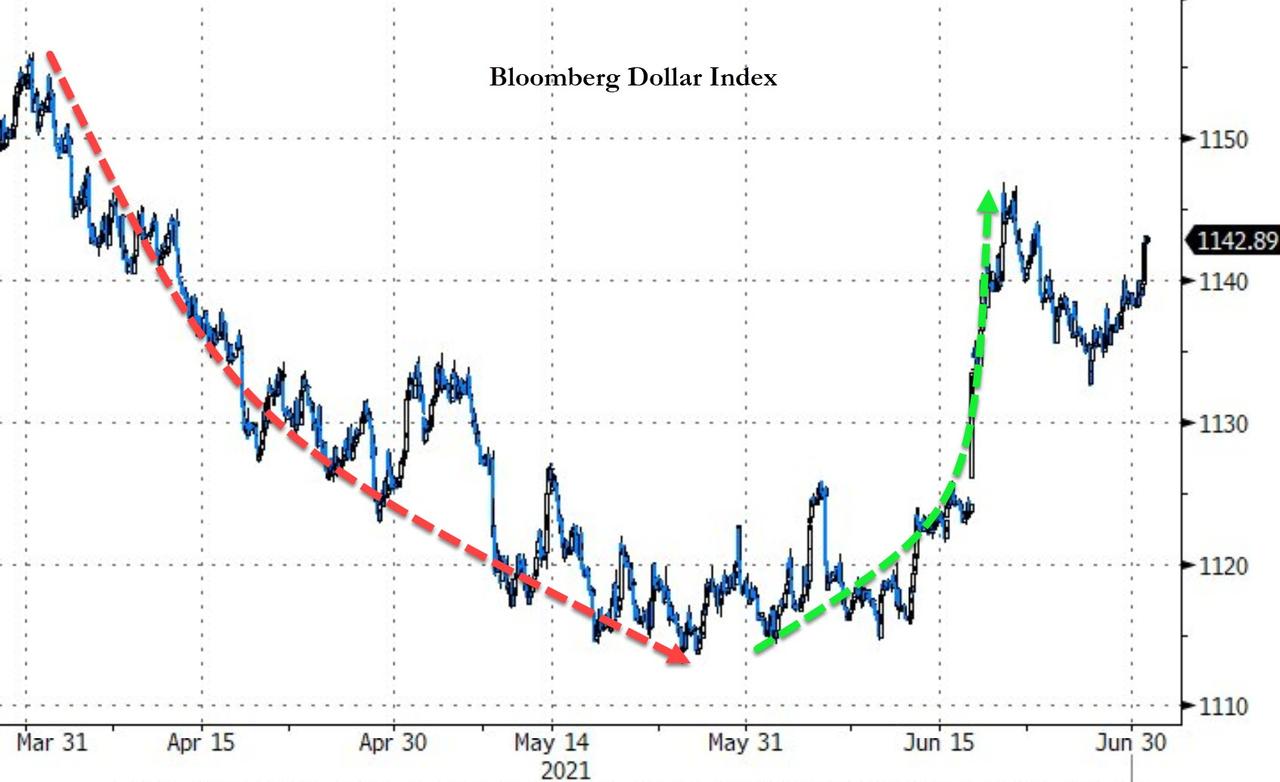
Bond yields offered a mixed picture for this quarter, as the 30-year yield took a dive while the 2-year yield spiked. The US Dollar ended lower for the quarter, despite showing a strong rebound in June.
The question in my mind when looking to the upcoming 3rd quarter is this one: “Will worsening inflation finally force the Fed’s hand to raise interest rates?
Only time will tell.
2. ETFs in the Spotlight
In case you missed the announcement and description of this section, you can read it here again.
It features some of the 10 broadly diversified domestic and sector ETFs from my HighVolume list as posted every Saturday. Furthermore, they are screened for the lowest MaxDD% number meaning they have been showing better resistance to temporary sell offs than all others over the past year.
The below table simply demonstrates the magnitude with which these ETFs are fluctuating above or below their respective individual trend lines (%+/-M/A). A break below, represented by a negative number, shows weakness, while a break above, represented by a positive percentage, shows strength.
For hundreds of ETF choices, be sure to reference Thursday’s StatSheet.
For this current domestic “Buy” cycle, here’s how some our candidates have fared:
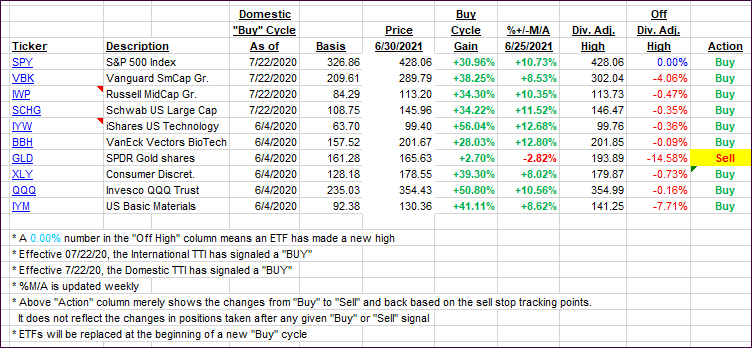
Click image to enlarge.
Again, the %+/-M/A column above shows the position of the various ETFs in relation to their respective long-term trend lines, while the trailing sell stops are being tracked in the “Off High” column. The “Action” column will signal a “Sell” once the -8% point has been taken out in the “Off High” column. For more volatile sector ETFs, the trigger point is -10%.
3. Trend Tracking Indexes (TTIs)
Our TTIs were mixed with the Domestic one slightly gaining, while the International one slipped.
This is how we closed 06/30/2021:
Domestic TTI: +13.22% above its M/A (prior close +12.97%)—Buy signal effective 07/22/2020.
International TTI: +10.31% above its M/A (prior close +10.43%)—Buy signals effective 07/22/2020.
Disclosure: I am obliged to inform you that I, as well as my advisory clients, own some of the ETFs listed in the above table. Furthermore, they do not represent a specific investment recommendation for you, they merely show which ETFs from the universe I track are falling within the specified guidelines.
All linked charts above are courtesy of Bloomberg via ZeroHedge.
Contact Ulli