Sliding Into Earnings Season

Ulli Market Commentary Contact

[Chart courtesy of MarketWatch.com]

  1. Moving the markets

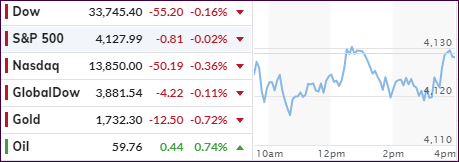
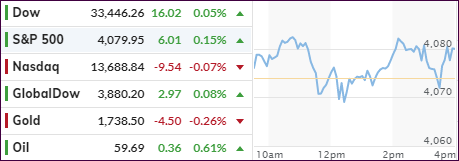
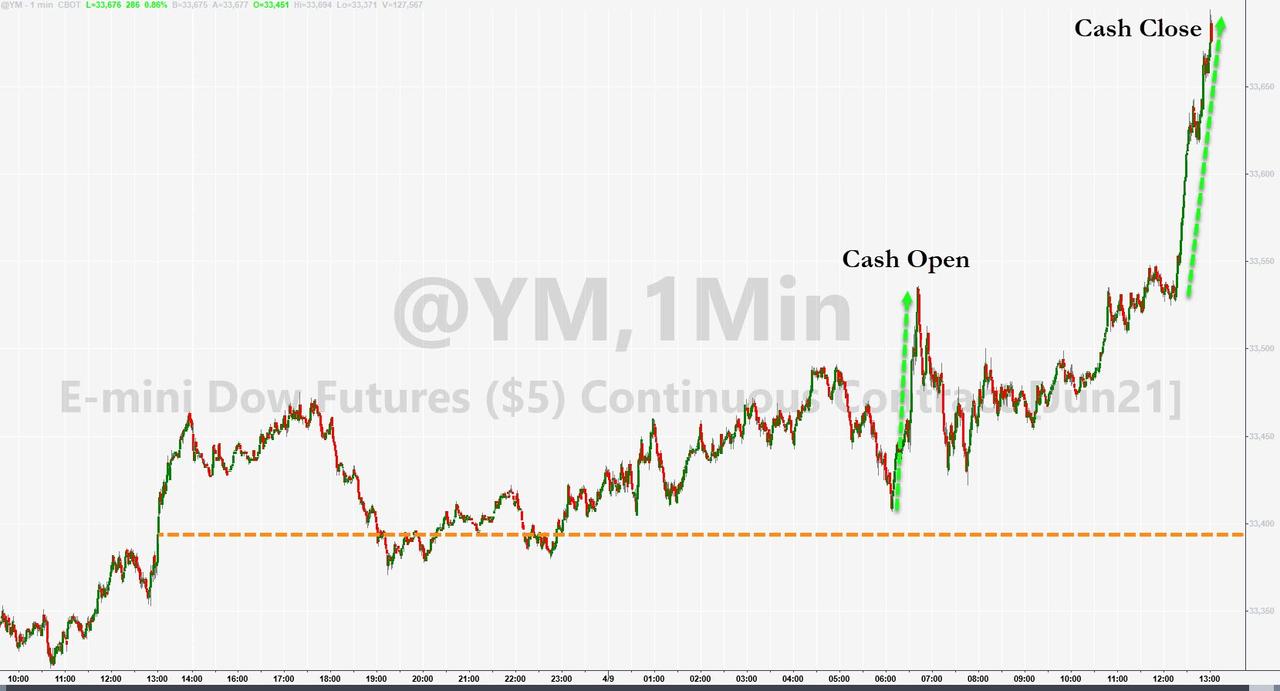
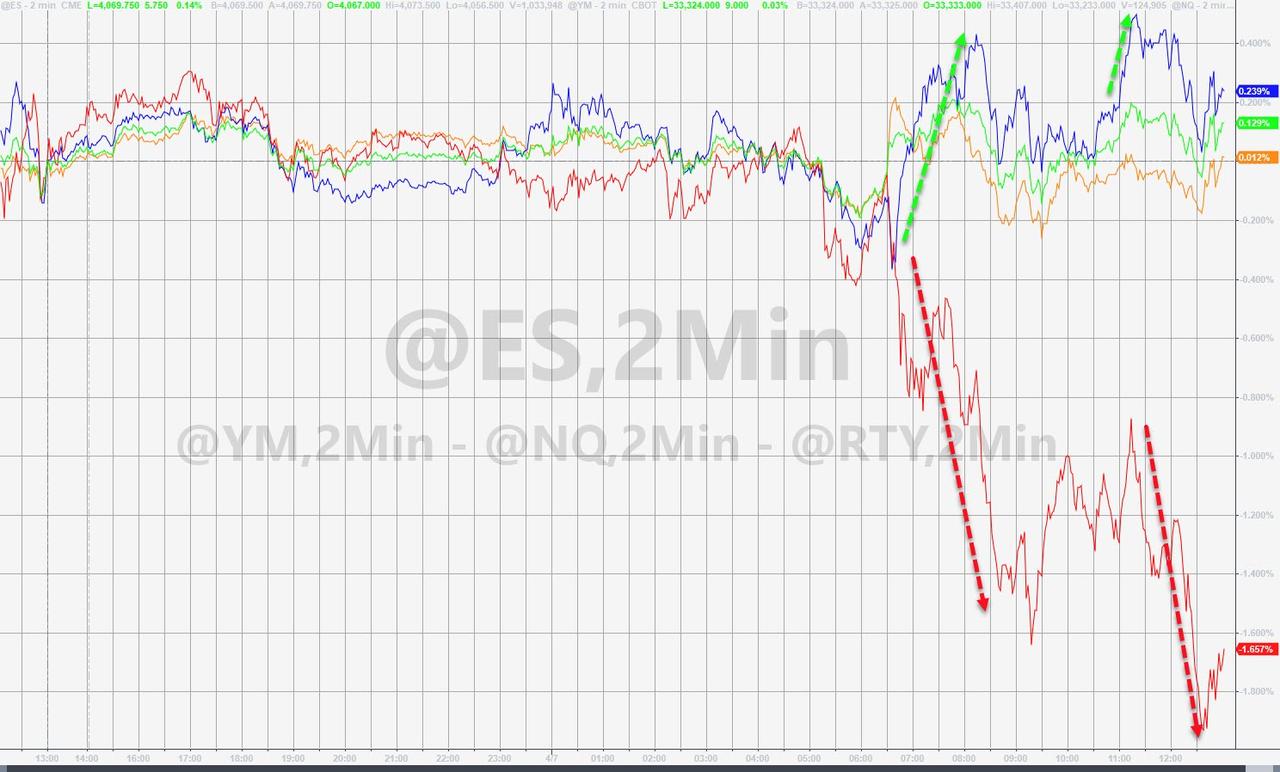
Subdued trading best describes today’s session during which the major indexes operated within a tight range. Despite a red close, the losses were minor, and the activity resembled a lack of motivation due to key inflation data and first quarter earnings awaiting on deck.

Market volatility continued to decline, as seen by the S&P 500 having now traded within a 1% range for the fifth session in a row. Reopening optimism was a major contributor with the VIX “fear” gauge trading below 18, a level last seen over a year ago.

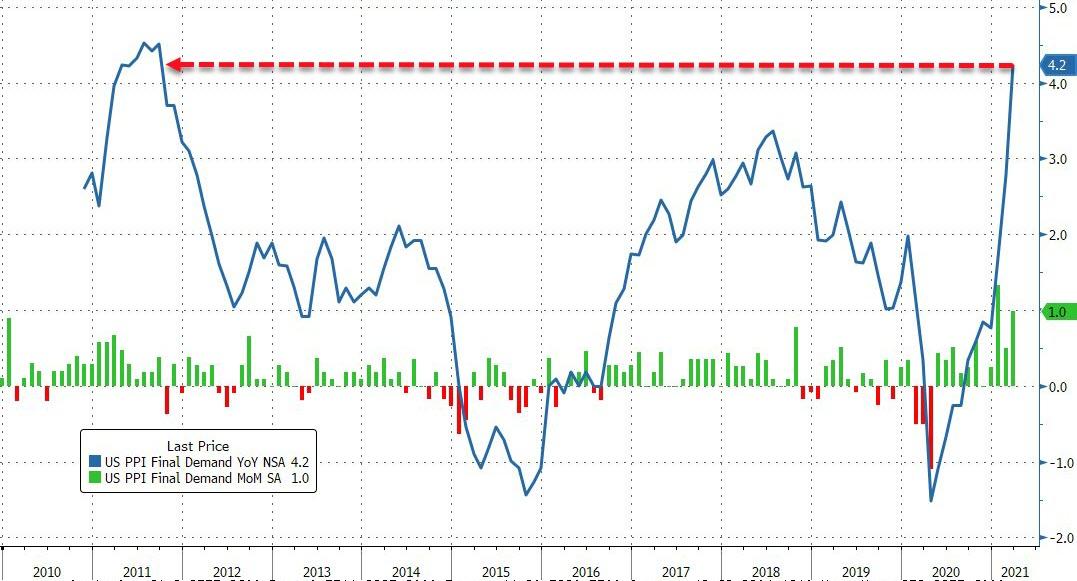
The current focus is on tomorrow’s CPI release, which is considered the benchmark for measuring inflation, although the index is faulty in that it does not include day-to-day items that we all know have increased in price.  

Fed chair Powell made an appearance on “60 Minutes” last night and had the following to say:

We want to see inflation move up to 2% — and we mean that on a sustainable basis, we don’t mean just tap the base once, but then we’d also like to see it on track to move moderately above 2% for some time.

And then what? I disagree with his statement, because it makes you think that inflation can be controlled or simply turned off, once it exceeds or reaches a desired number. Unfortunately, history is riddled with evidence showing that once the genie, aka inflation, is out of the bottle, you can’t put it back in.

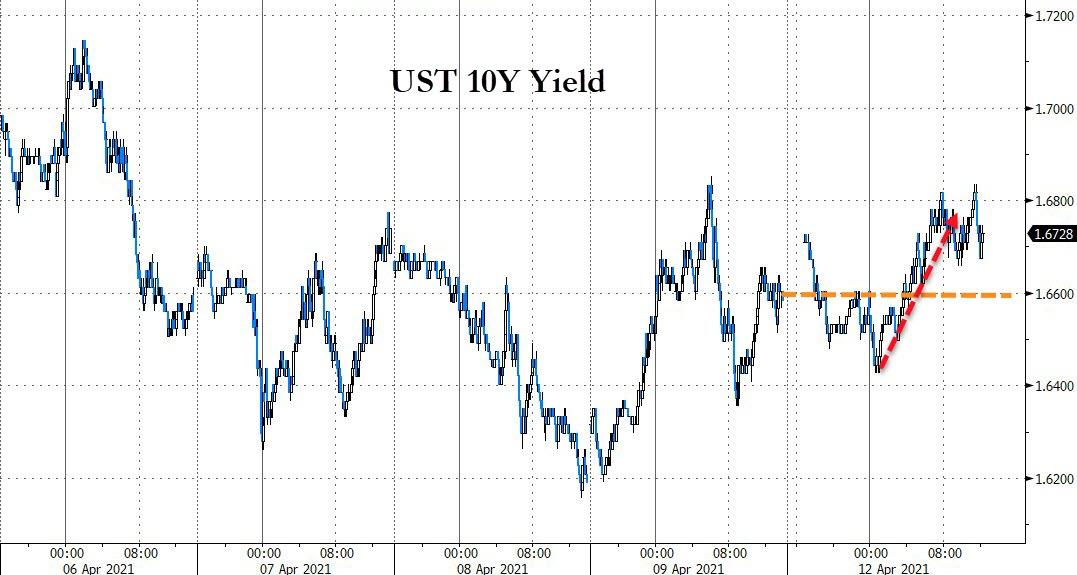
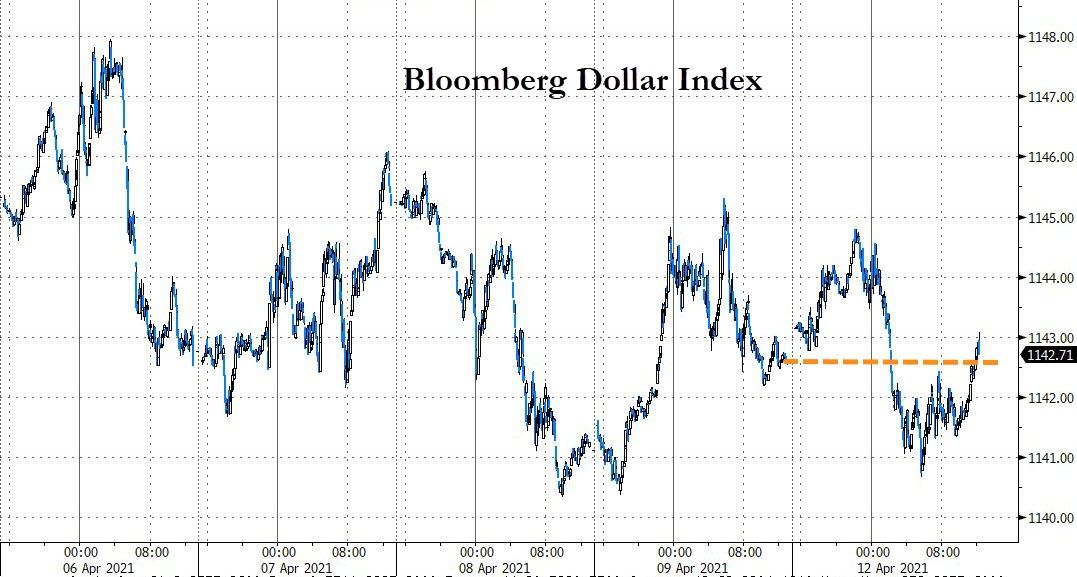
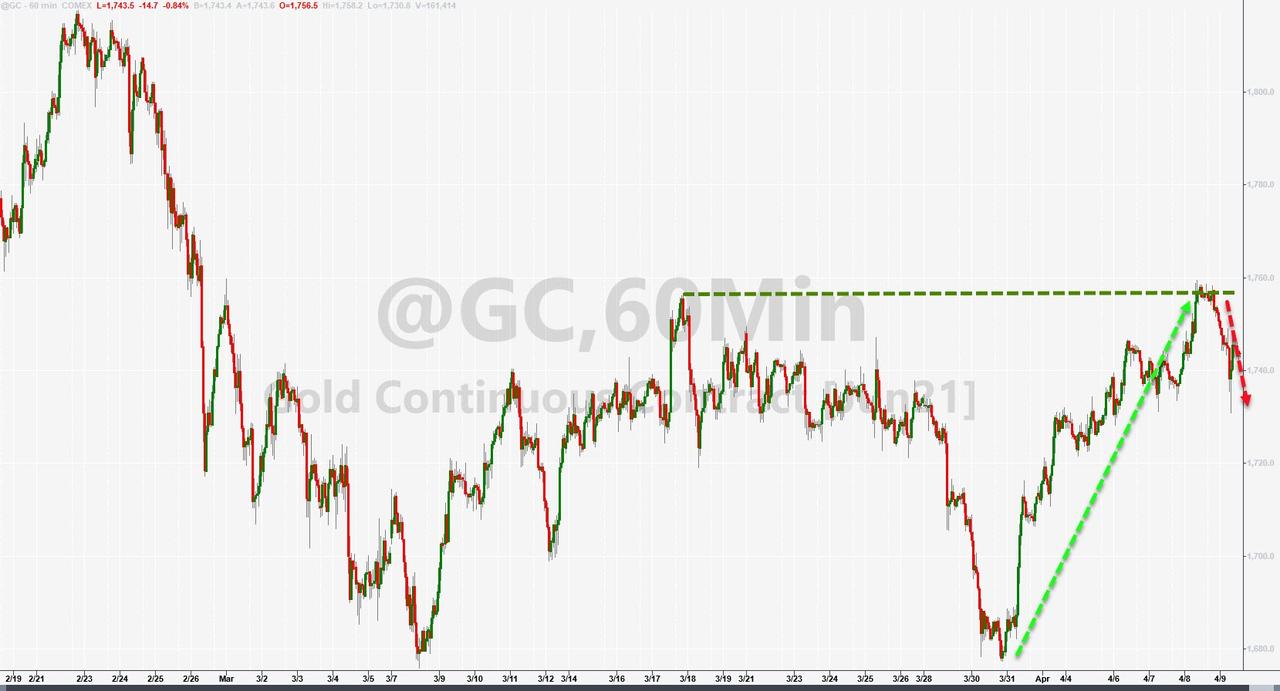
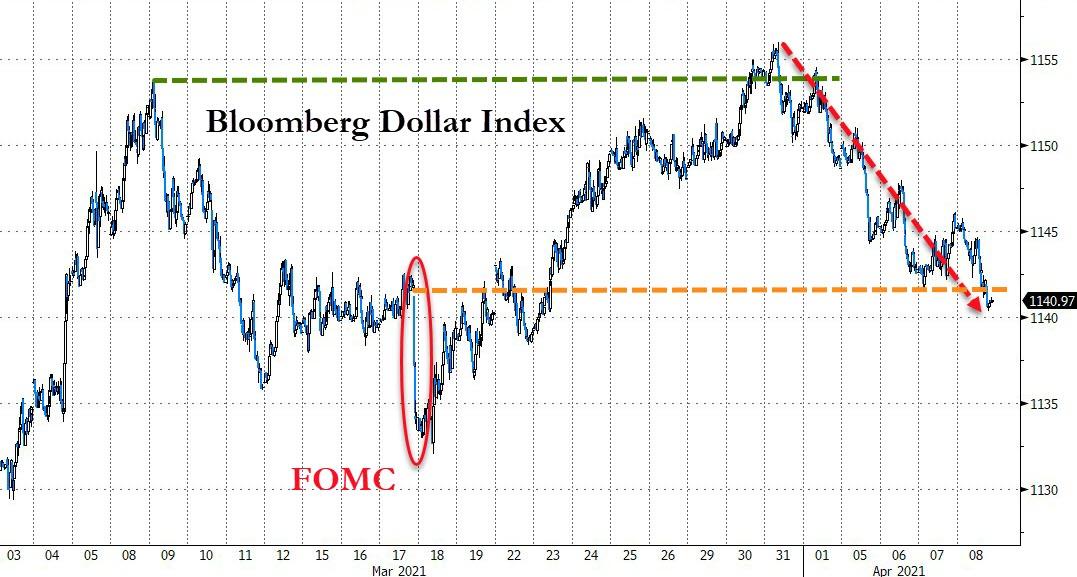
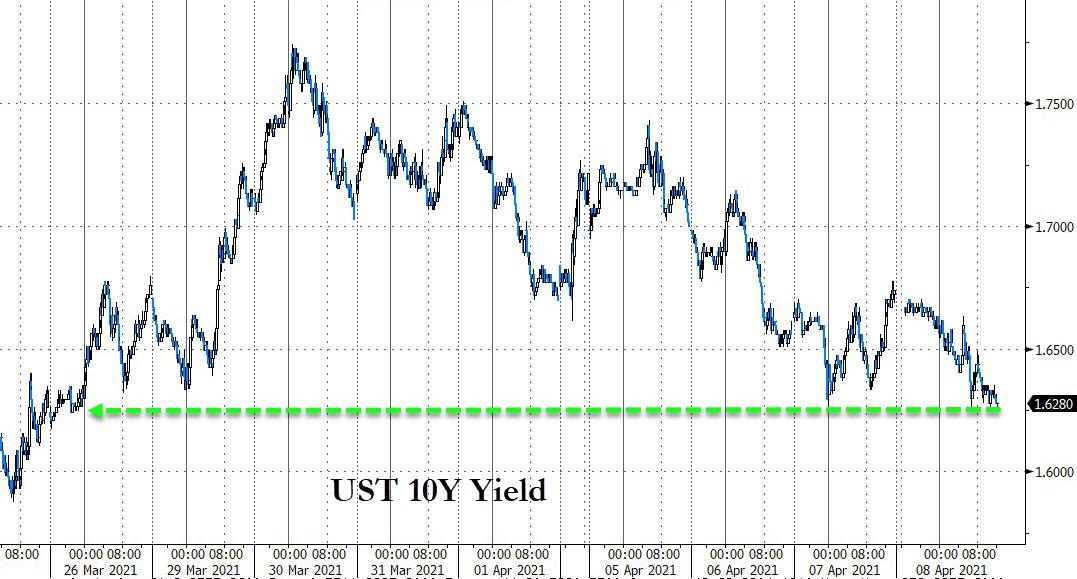
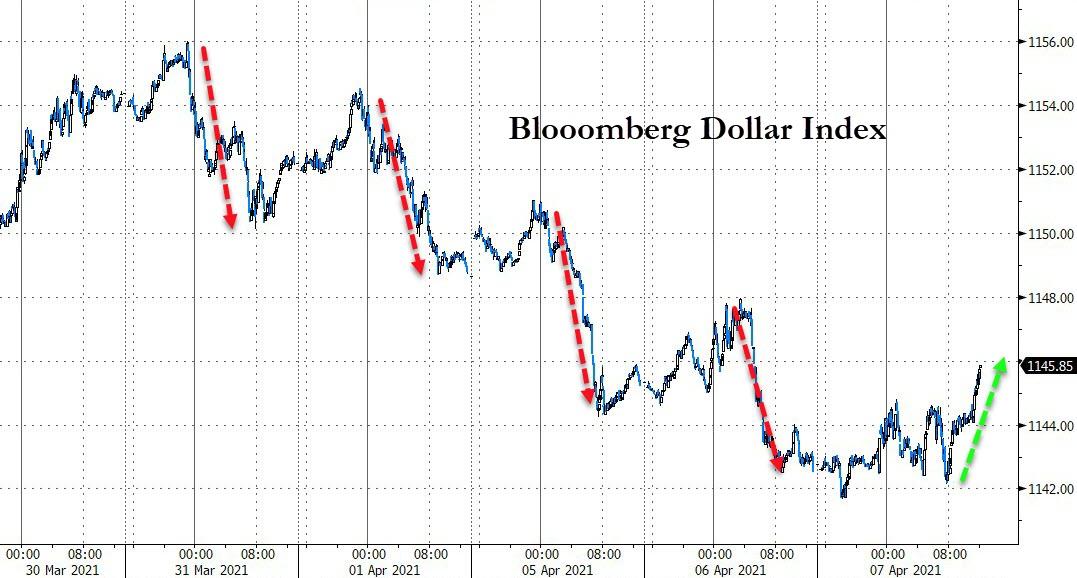
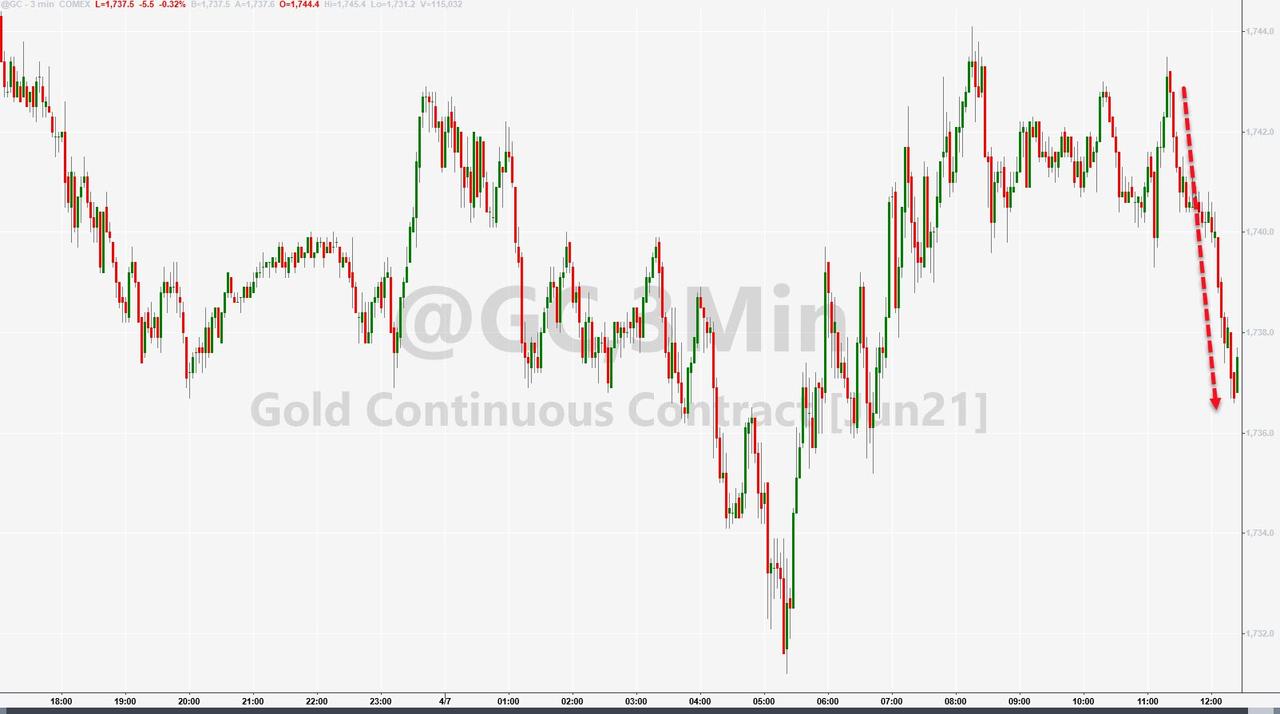
For the day, we saw 10-year bond yields treading water, the US Dollar meandering aimlessly, while gold slipped 0.72%.

Read More

ETFs On The Cutline – Updated Through 04/09/2021

Ulli ETFs on the Cutline Contact

Below, please find the latest High-Volume ETF Cutline report, which shows how far above or below their respective long-term trend lines (39-week SMA) my currently tracked ETFs are positioned.

This report covers the HV ETF Master List from Thursday’s StatSheet and includes 312 High Volume ETFs, defined as those with an average daily volume of more than $5 million, of which currently 245 (last week 246) are hovering in bullish territory. The yellow line separates those ETFs that are positioned above their trend line (%M/A) from those that have dropped below it.

Take a look:                                                                   

The HV ETF Master Cutline Report

In case you are not familiar with some of the terminology used in the reports, please read the Glossary of Terms. If you missed the original post about the Cutline approach, you can read it here.      

ETF Tracker Newsletter For April 9, 2021

Ulli ETF Tracker Contact

ETF Tracker StatSheet          

You can view the latest version here.

LEAPING INTO THE CLOSE

[Chart courtesy of MarketWatch.com]

  1. Moving the markets

A last hour ramp pulled the major indexes out their sideways pattern and pushed them into a solid green close.

For a change, the Dow led the pack by scoring another record high with the Nasdaq only in 3rd place, while SmallCaps rose moderately.  

In economic data, and after an unprecedented delay, the BLS finally disclosed a huge jump in March Producer Prices, up 1% MoM vs an expected 0.5%. Far worse was the YoY number, which amounted to a stunning rise of 4.2% vs. 3.8% expected. As ZH pointed out, this is the 11th month in a row of rising PPI.

Inflation keeps heating up, and I believe it will accelerate, while the Fed has not acknowledged any of it, but they will have to once it is passed on to consumers.

We’ll need to wait till next week to see if the next CPI reading is already signaling this process. However, the CPI is a number that does not truly reflect price increases for everyday items.  

The 10-year bond yield rose slightly to the 1.65% level, while the US Dollar bounced off yesterday’s lows, keeping Gold in check with the precious metal slipping -0.84%.

Hope reigns supreme that the markets can handle inflation and rising bond yields, as the chief investment officer at Raymond James noted:

Contrary to headlines, rising interest rates, healthy levels of inflation, and an eventual Fed rate hike are not necessarily market negatives.

That is until inflation rears its ugly head, a result of reckless money printing, and the bond market starts to puke as yields roar.  

Read More

Weekly StatSheet For The ETF Tracker Newsletter – Updated Through 04/08/2021

Ulli ETF StatSheet Contact

ETF Data updated through Thursday, April 8, 2021

Methodology/Use of this StatSheet:

1. From the universe of over 1,800 ETFs, I have selected only those with a trading volume of over $5 million per day (HV ETFs), so that liquidity and a small bid/ask spread are assured.

2. Trend Tracking Indexes (TTIs)

Buy or Sell decisions for Domestic and International ETFs (section 1 and 2), are made based on the respective TTI and its position either above or below its long-term M/A (Moving Average). A crossing of the trend line from below accompanied by some staying power above constitutes a “Buy” signal. Conversely, a clear break below the line constitutes a “Sell” signal. Additionally, I use an 8% trailing stop loss on all positions in these categories to control downside risk.

3. All other investment arenas do not have a TTI and should be traded based on the position of the individual ETF relative to its own respective trend line (%M/A). That’s why those signals are referred to as a “Selective Buy.” In other words, if an ETF crosses its own trendline to the upside, a “Buy” signal is generated. Since these areas tend to be more volatile, I recommend a wider trailing sell stop of 8%-10% depending on your risk tolerance.

If you are unfamiliar with some of the terminology, please see Glossary of Terms and new subscriber information in section 9.     

1. DOMESTIC EQUITY ETFs: BUY — since 07/22/2020

Click on chart to enlarge

Our main directional indicator, the Domestic Trend Tracking Index (TTI-green line in the above chart) has now rallied above its long-term trend line (red) by +20.90% and remains in “BUY” mode as posted.

Read More

Discovering Upward Momentum

Ulli Market Commentary Contact

[Chart courtesy of MarketWatch.com]

  1. Moving the markets

After two days of aimless sideways meandering, the markets broke out to the upside although in moderate fashion. Nevertheless, it was enough of a spurt for the S&P 500 to score a new record high, while the index stopped just short of breaking through the 4,100 level.

“Growth” outperformed “value” by a wide margin leaving some analysts wondering if the value surge has come to an end in favor of growth. However, these swings can reverse at any time, and it’s wise to be exposed to both.

Initial Jobless Claims disappointed again with 744k Americans filing for new unemployment benefits for the first time, far worse than the expected 694k. When looking at the bigger picture, it’s revealed that over 18 million Americans are still on government benefits, despite broad re-openings across the country.

Still, optimism runs rampant that the next few months will see huge job gains with some forecasting that employment will return to pre-pandemic levels by the end of the year. I am not sure if that view is simply designed to keep the market pumped up, because that does not seem realistic to me, as the recovery is spotty or uneven at best.

The US Dollar resumed its downward trend, while 10-year bond yields slipped again to reach 1.65%. This combo helped the gold ETF GLD to bounce nicely by gaining +1.06%, on par with the Nasdaq advance.

As we go forward, financial support via fiscal policy, and continued asset purchases by the Fed, will be the foundation for further advances.

Read More

Treading Water

Ulli Market Commentary Contact

[Chart courtesy of MarketWatch.com]

  1. Moving the markets

Despite the markets having moved in a tight range, and pretty much ended the session unchanged, it was enough of a gain for the S&P 500 to score another record close.

All eyes were on the release of the Fed minutes, which showed continued commitment by the Central Bank to support an accommodative policy, read lower interest rates and asset purchases, so that the economy can fully recover.

The minutes included this statement:

Participants noted that it would likely be some time until substantial further progress toward the Committee’s maximum-employment and price-stability goals would be realized and that, consistent with the Committee’s outcome-based guidance, asset purchases would continue at least at the current pace until then.

The cheerleader of the day award goes to JPM’s Jamie Dimon, whose annual letter included this ecstatic assessment:

I have little doubt that with excess savings, new stimulus savings, huge deficit spending, more QE, a new potential infrastructure bill, a successful vaccine and euphoria around the end of the pandemic, the U.S. economy will likely boom, this boom could easily run into 2023 because all the spending could extend well into 2023.

Excitement, optimism, and strong forecasts were plentiful, but for today’s session the markets shrugged most it off to mere jawboning, but some areas were affected negatively.

SmallCaps were hammered again, while the major indexes stoically resisted even Yellen’s Tax America plan, including the Fed’s Kaplan warning “I do worry about excesses and imbalances.”  

Bond yields traded in a tight range with the 10-year vacillating around the 1.65% level, although the US Dollar managed to bounce a tad thereby keeping Gold in check.

In the end, it was a nothing day where treading water was the overriding theme.

Read More