
ETF Tracker StatSheet
You can view the latest version here.
LEAPING INTO THE CLOSE
- Moving the markets
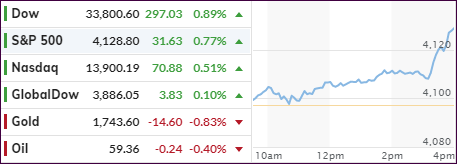
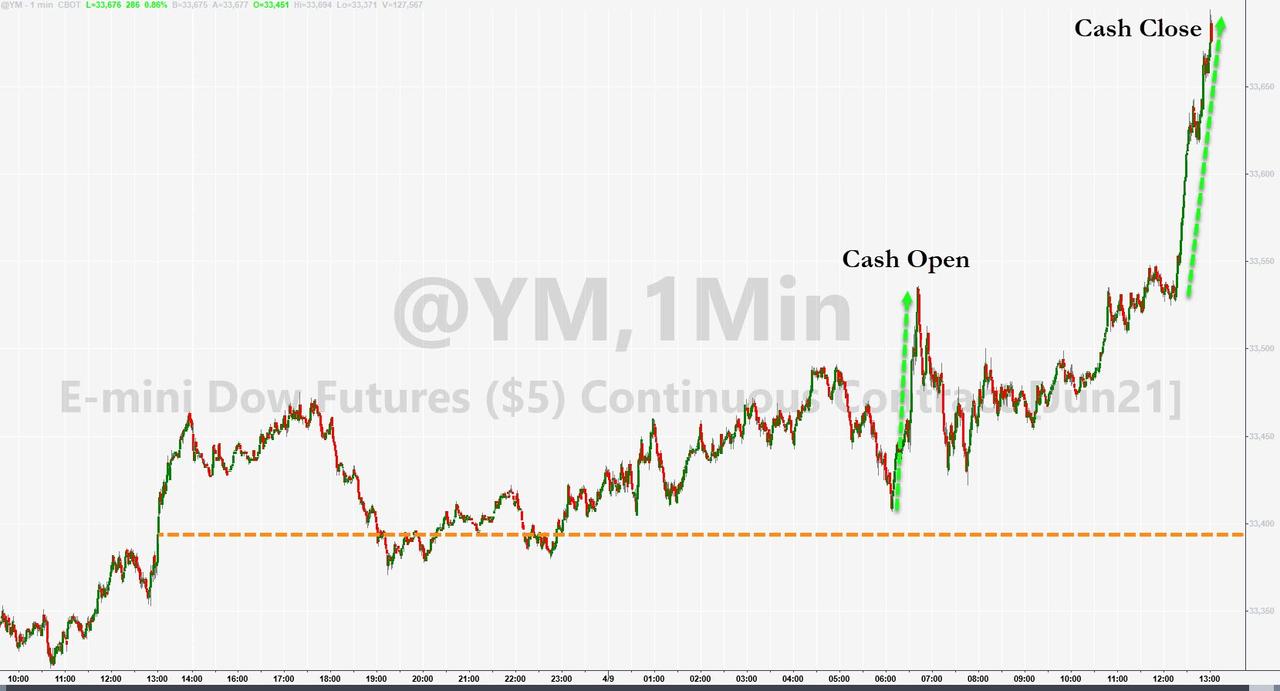
A last hour ramp pulled the major indexes out their sideways pattern and pushed them into a solid green close.
For a change, the Dow led the pack by scoring another record high with the Nasdaq only in 3rd place, while SmallCaps rose moderately.
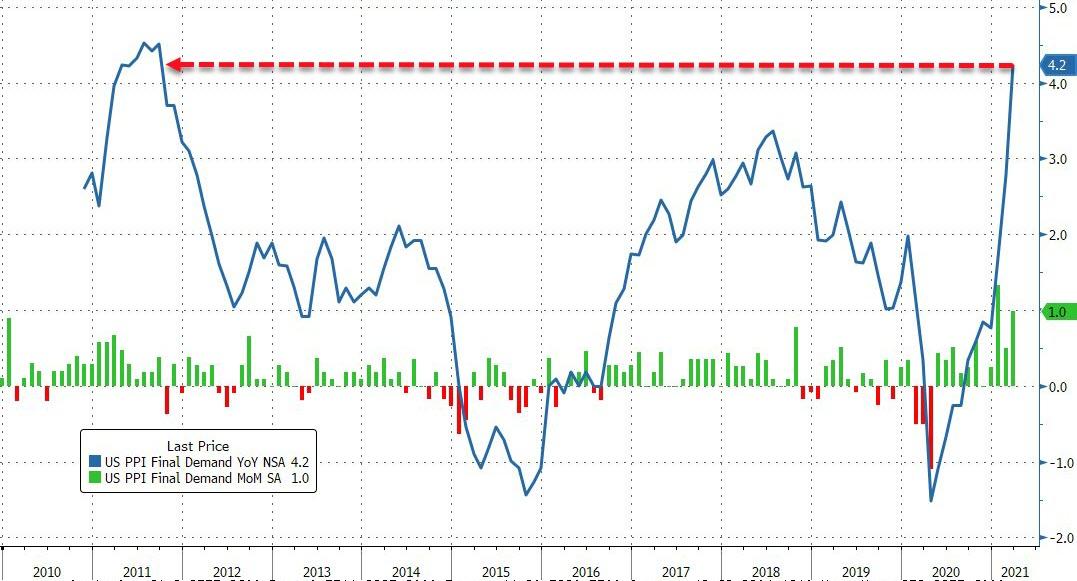
In economic data, and after an unprecedented delay, the BLS finally disclosed a huge jump in March Producer Prices, up 1% MoM vs an expected 0.5%. Far worse was the YoY number, which amounted to a stunning rise of 4.2% vs. 3.8% expected. As ZH pointed out, this is the 11th month in a row of rising PPI.
Inflation keeps heating up, and I believe it will accelerate, while the Fed has not acknowledged any of it, but they will have to once it is passed on to consumers.
We’ll need to wait till next week to see if the next CPI reading is already signaling this process. However, the CPI is a number that does not truly reflect price increases for everyday items.
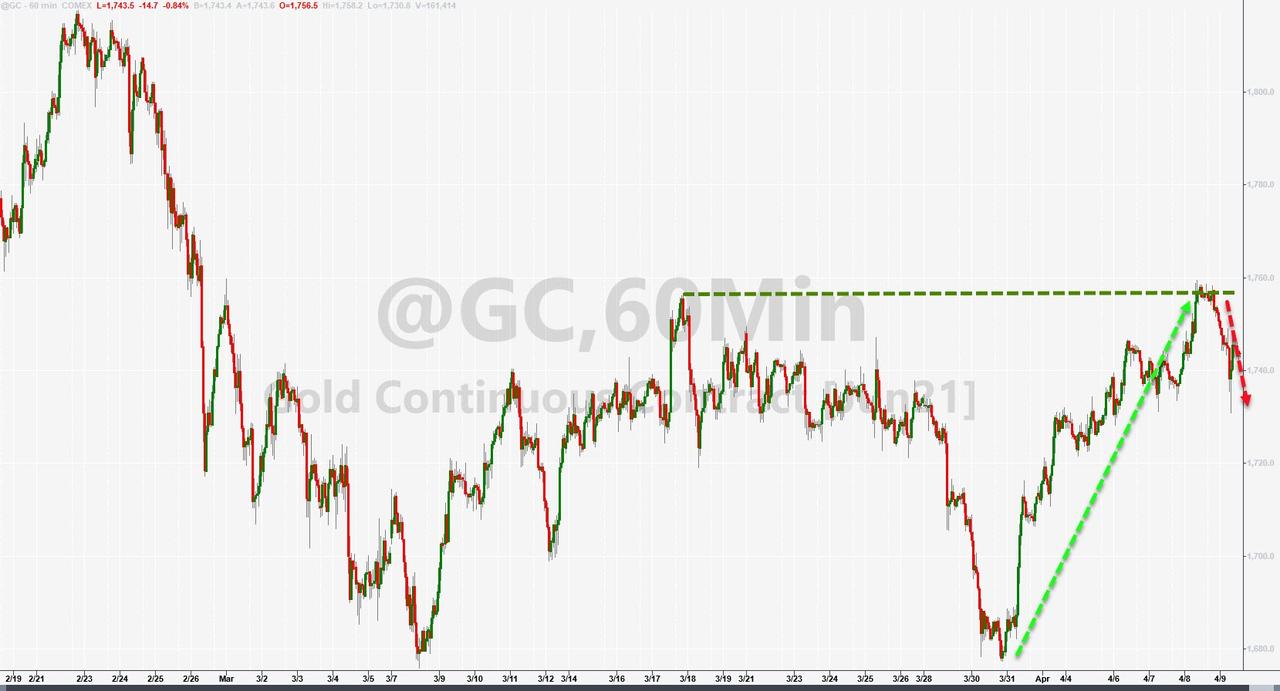
The 10-year bond yield rose slightly to the 1.65% level, while the US Dollar bounced off yesterday’s lows, keeping Gold in check with the precious metal slipping -0.84%.
Hope reigns supreme that the markets can handle inflation and rising bond yields, as the chief investment officer at Raymond James noted:
Contrary to headlines, rising interest rates, healthy levels of inflation, and an eventual Fed rate hike are not necessarily market negatives.
That is until inflation rears its ugly head, a result of reckless money printing, and the bond market starts to puke as yields roar.
2. ETFs in the Spotlight
In case you missed the announcement and description of this section, you can read it here again.
It features some of the 10 broadly diversified domestic and sector ETFs from my HighVolume list as posted every Saturday. Furthermore, they are screened for the lowest MaxDD% number meaning they have been showing better resistance to temporary sell offs than all others over the past year.
The below table simply demonstrates the magnitude with which these ETFs are fluctuating above or below their respective individual trend lines (%+/-M/A). A break below, represented by a negative number, shows weakness, while a break above, represented by a positive percentage, shows strength.
For hundreds of ETF choices, be sure to reference Thursday’s StatSheet.
For this current domestic “Buy” cycle, here’s how some our candidates have fared:
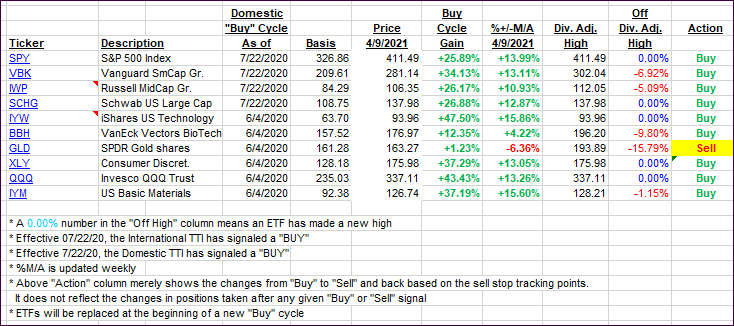
Click image to enlarge.
Again, the %+/-M/A column above shows the position of the various ETFs in relation to their respective long-term trend lines, while the trailing sell stops are being tracked in the “Off High” column. The “Action” column will signal a “Sell” once the -8% point has been taken out in the “Off High” column. For more volatile sector ETFs, the trigger point is -10%.
3. Trend Tracking Indexes (TTIs)
Our TTIs pulled back a tad despite the major indexes rallying into the close.
This is how we closed 4/9/2021:
Domestic TTI: +19.38% above its M/A (prior close +20.90%)—Buy signal effective 07/22/2020.
International TTI: +16.21% above its M/A (prior close +17.91%)—Buy signals effective 07/22/2020.
Disclosure: I am obliged to inform you that I, as well as my advisory clients, own some of the ETFs listed in the above table. Furthermore, they do not represent a specific investment recommendation for you, they merely show which ETFs from the universe I track are falling within the specified guidelines.
———————————————————-
WOULD YOU LIKE TO HAVE YOUR INVESTMENTS PROFESSIONALLY MANAGED?
Do you have the time to follow our investment plans yourself? If you are a busy professional who would like to have his portfolio managed using our methodology, please contact me directly or get more details here.
———————————————————
Back issues of the ETF Tracker are available on the web.
Contact Ulli