
- Moving the markets
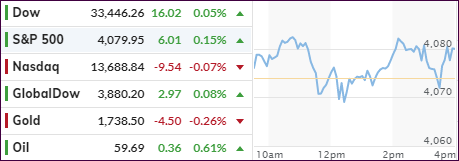
Despite the markets having moved in a tight range, and pretty much ended the session unchanged, it was enough of a gain for the S&P 500 to score another record close.
All eyes were on the release of the Fed minutes, which showed continued commitment by the Central Bank to support an accommodative policy, read lower interest rates and asset purchases, so that the economy can fully recover.
The minutes included this statement:
Participants noted that it would likely be some time until substantial further progress toward the Committee’s maximum-employment and price-stability goals would be realized and that, consistent with the Committee’s outcome-based guidance, asset purchases would continue at least at the current pace until then.
The cheerleader of the day award goes to JPM’s Jamie Dimon, whose annual letter included this ecstatic assessment:
I have little doubt that with excess savings, new stimulus savings, huge deficit spending, more QE, a new potential infrastructure bill, a successful vaccine and euphoria around the end of the pandemic, the U.S. economy will likely boom, this boom could easily run into 2023 because all the spending could extend well into 2023.
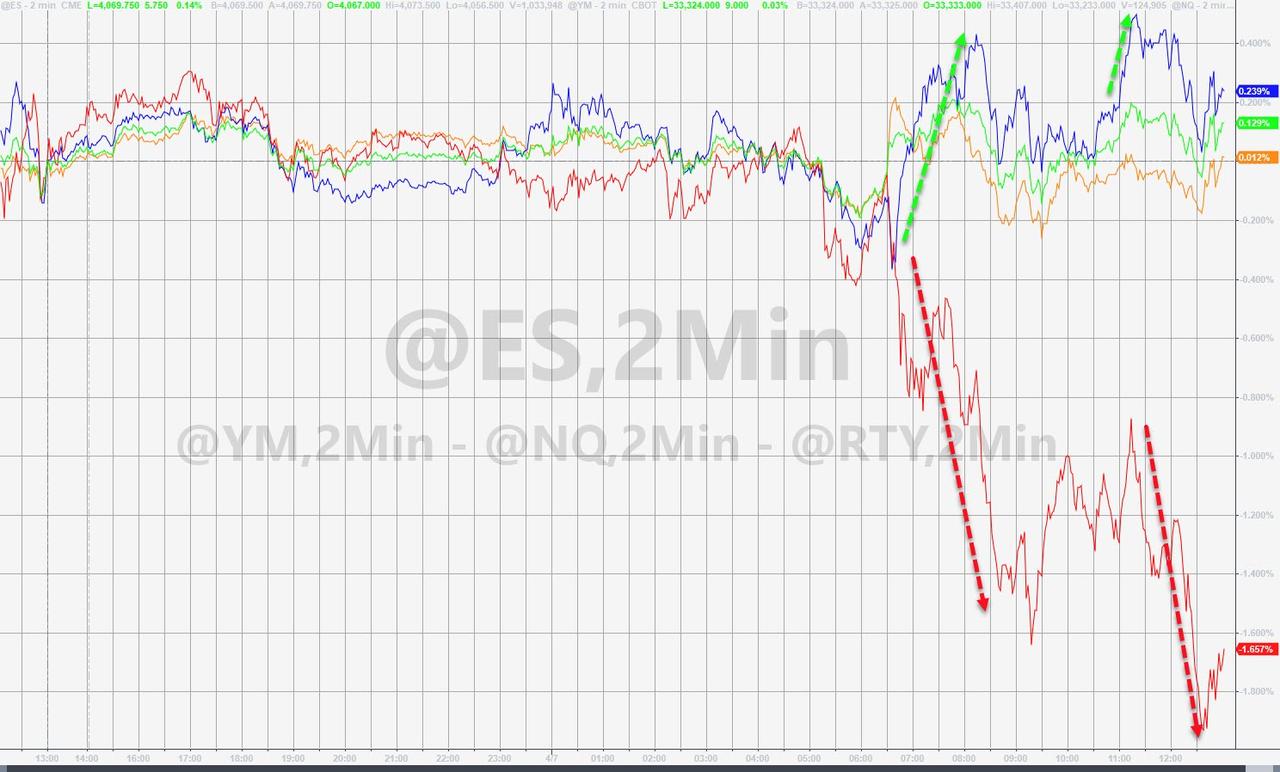
Excitement, optimism, and strong forecasts were plentiful, but for today’s session the markets shrugged most it off to mere jawboning, but some areas were affected negatively.
SmallCaps were hammered again, while the major indexes stoically resisted even Yellen’s Tax America plan, including the Fed’s Kaplan warning “I do worry about excesses and imbalances.”
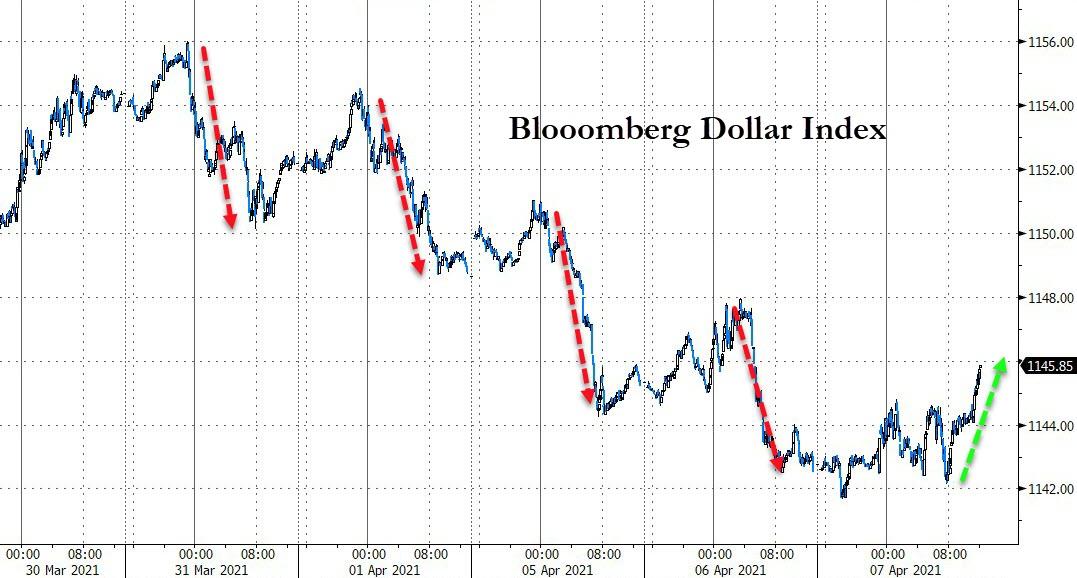
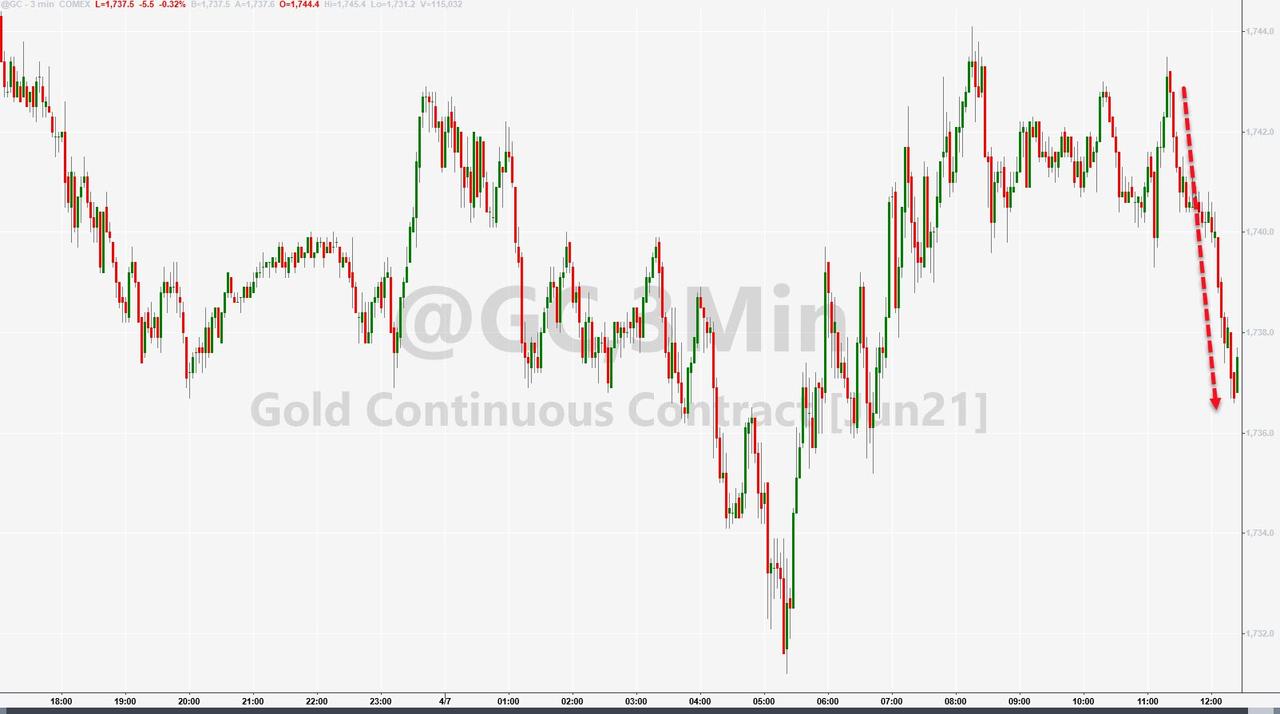
Bond yields traded in a tight range with the 10-year vacillating around the 1.65% level, although the US Dollar managed to bounce a tad thereby keeping Gold in check.
In the end, it was a nothing day where treading water was the overriding theme.
2. ETFs in the Spotlight
In case you missed the announcement and description of this section, you can read it here again.
It features some of the 10 broadly diversified domestic and sector ETFs from my HighVolume list as posted every Saturday. Furthermore, they are screened for the lowest MaxDD% number meaning they have been showing better resistance to temporary sell offs than all others over the past year.
The below table simply demonstrates the magnitude with which these ETFs are fluctuating above or below their respective individual trend lines (%+/-M/A). A break below, represented by a negative number, shows weakness, while a break above, represented by a positive percentage, shows strength.
For hundreds of ETF choices, be sure to reference Thursday’s StatSheet.
For this current domestic “Buy” cycle, here’s how some our candidates have fared:
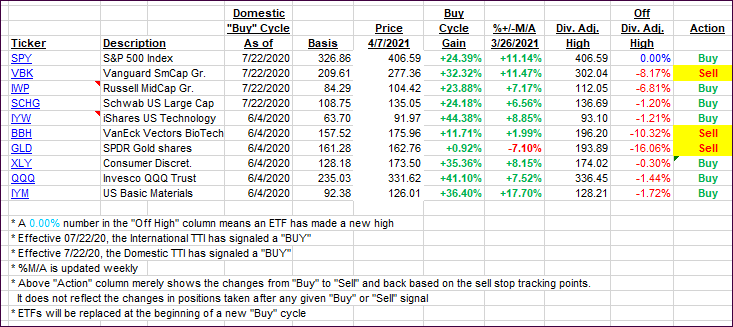
Click image to enlarge.
Again, the %+/-M/A column above shows the position of the various ETFs in relation to their respective long-term trend lines, while the trailing sell stops are being tracked in the “Off High” column. The “Action” column will signal a “Sell” once the -8% point has been taken out in the “Off High” column. For more volatile sector ETFs, the trigger point is -10%.
3. Trend Tracking Indexes (TTIs)
Our TTIs were mixed with the Domestic one slipping, while the International one gained a tad.
This is how we closed 04/07/2021:
Domestic TTI: +20.68% above its M/A (prior close +21.13%)—Buy signal effective 07/22/2020.
International TTI: +17.81% above its M/A (prior close +17.79%)—Buy signals effective 07/22/2020.
Disclosure: I am obliged to inform you that I, as well as my advisory clients, own some of the ETFs listed in the above table. Furthermore, they do not represent a specific investment recommendation for you, they merely show which ETFs from the universe I track are falling within the specified guidelines.
Contact Ulli