
- Moving the markets
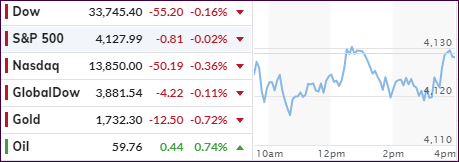
Subdued trading best describes today’s session during which the major indexes operated within a tight range. Despite a red close, the losses were minor, and the activity resembled a lack of motivation due to key inflation data and first quarter earnings awaiting on deck.
Market volatility continued to decline, as seen by the S&P 500 having now traded within a 1% range for the fifth session in a row. Reopening optimism was a major contributor with the VIX “fear” gauge trading below 18, a level last seen over a year ago.
The current focus is on tomorrow’s CPI release, which is considered the benchmark for measuring inflation, although the index is faulty in that it does not include day-to-day items that we all know have increased in price.
Fed chair Powell made an appearance on “60 Minutes” last night and had the following to say:
We want to see inflation move up to 2% — and we mean that on a sustainable basis, we don’t mean just tap the base once, but then we’d also like to see it on track to move moderately above 2% for some time.
And then what? I disagree with his statement, because it makes you think that inflation can be controlled or simply turned off, once it exceeds or reaches a desired number. Unfortunately, history is riddled with evidence showing that once the genie, aka inflation, is out of the bottle, you can’t put it back in.
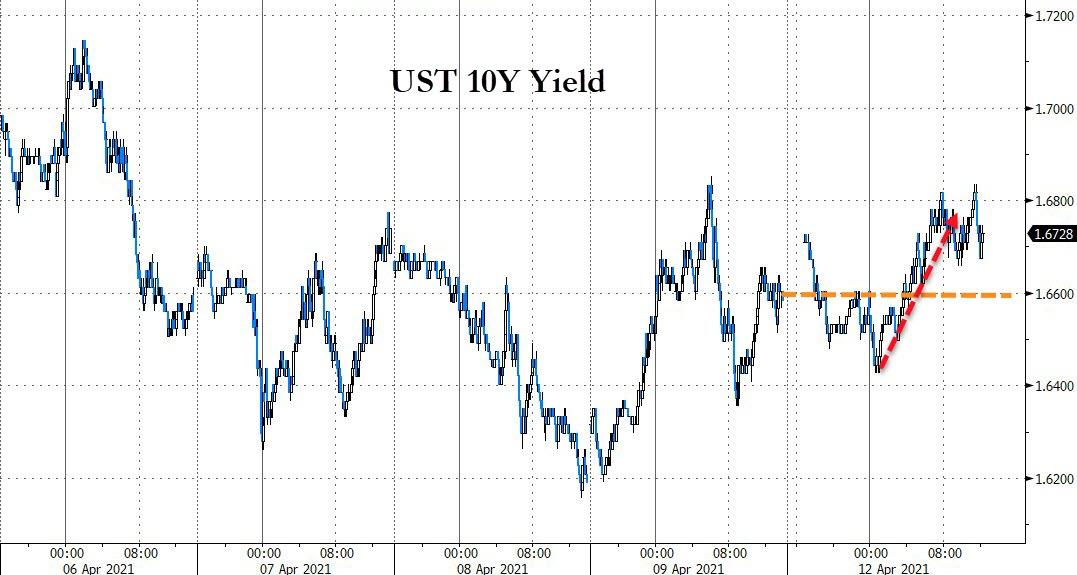
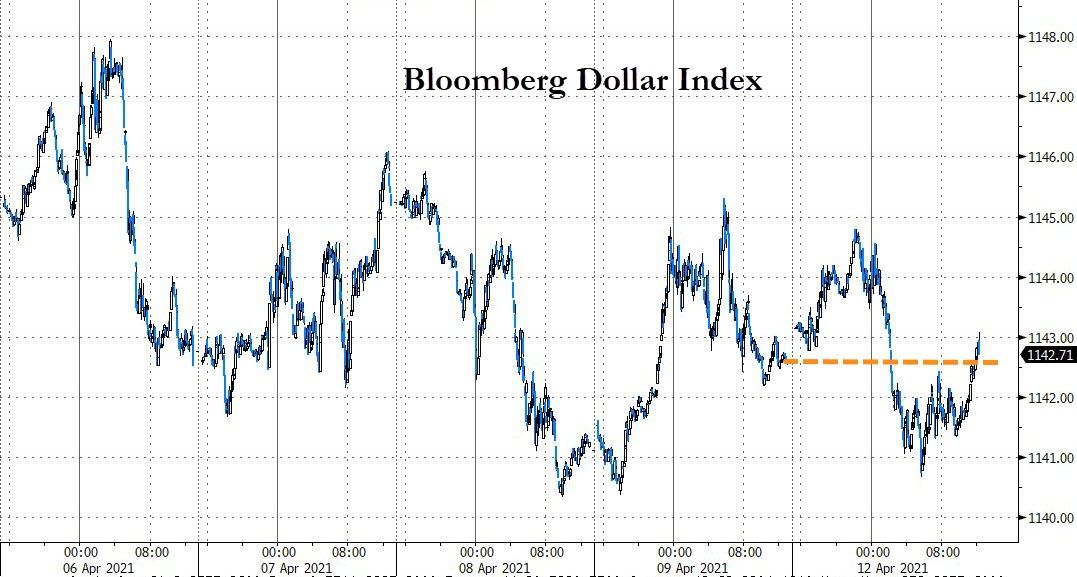
For the day, we saw 10-year bond yields treading water, the US Dollar meandering aimlessly, while gold slipped 0.72%.
2. ETFs in the Spotlight
In case you missed the announcement and description of this section, you can read it here again.
It features some of the 10 broadly diversified domestic and sector ETFs from my HighVolume list as posted every Saturday. Furthermore, they are screened for the lowest MaxDD% number meaning they have been showing better resistance to temporary sell offs than all others over the past year.
The below table simply demonstrates the magnitude with which these ETFs are fluctuating above or below their respective individual trend lines (%+/-M/A). A break below, represented by a negative number, shows weakness, while a break above, represented by a positive percentage, shows strength.
For hundreds of ETF choices, be sure to reference Thursday’s StatSheet.
For this current domestic “Buy” cycle, here’s how some our candidates have fared:
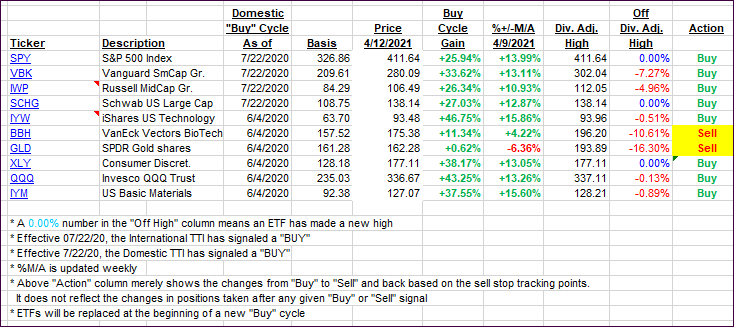
Click image to enlarge.
Again, the %+/-M/A column above shows the position of the various ETFs in relation to their respective long-term trend lines, while the trailing sell stops are being tracked in the “Off High” column. The “Action” column will signal a “Sell” once the -8% point has been taken out in the “Off High” column. For more volatile sector ETFs, the trigger point is -10%.
3. Trend Tracking Indexes (TTIs)
Our TTIs closed mixed with the Domestic one gaining and the International one dropping a fraction.
This is how we closed 4/12/2021:
Domestic TTI: +19.59% above its M/A (prior close +19.38%)—Buy signal effective 07/22/2020.
International TTI: +16.07% above its M/A (prior close +16.21%)—Buy signals effective 07/22/2020.
Disclosure: I am obliged to inform you that I, as well as my advisory clients, own some of the ETFs listed in the above table. Furthermore, they do not represent a specific investment recommendation for you, they merely show which ETFs from the universe I track are falling within the specified guidelines.
Contact Ulli