Below, please find the latest High-Volume ETF Cutline report, which shows how far above or below their respective long-term trend lines (39-week SMA) my currently tracked ETFs are positioned.
This report covers the HV ETF Master List from Thursday’s StatSheet and includes 312 High Volume ETFs, defined as those with an average daily volume of more than $5 million, of which currently 254 (last week 253) are hovering in bullish territory. The yellow line separates those ETFs that are positioned above their trend line (%M/A) from those that have dropped below it.
In case you are not familiar with some of the terminology used in the reports, please read the Glossary of Terms. If you missed the original post about the Cutline approach, you can read it here.
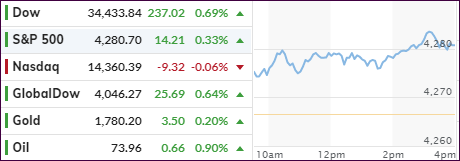
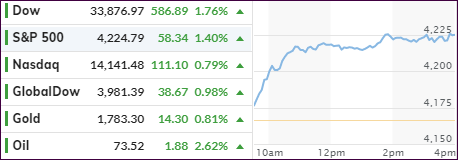
Last Friday’s market plunge is now being looked at as a vanishing point in the rearview mirror with stocks having picked up their bullish momentum and the S&P 500 rising to another record, while closing out its best week since April.
Despite a slowdown during mid-week, momentum picked up, and we rallied into the weekend supported by traders’ belief that higher inflation will be temporary, as the economy continues to make strides toward a recovery from Covid-19.
Added one senior analyst from Commonwealth Financial:
“This provided support to the Fed’s argument that inflation is transitory and will help allay fears that we are witnessing runaway inflation and should continue to provide support to risk assets such as equities.”
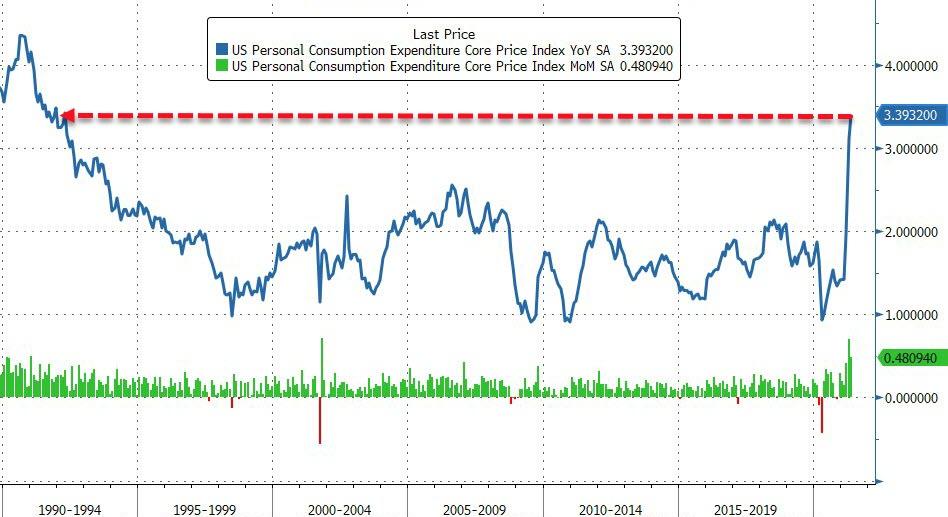
Questioning the accuracy of that belief is Bloomberg’s chart showing that the Fed’s favorite inflation indicator hit a 30-year high, which makes me disagree with the continued jawboning of inflation being transitory.
Be that as it may, what matters is that the markets appear to be in tune with bullish sentiment causing the rally to go on. The major indexes are all up for the week, with the S&P 500 and Dow adding 2.6% each, while the Nasdaq led with 3.2%.
Bank shares received support from the Fed’s announcement that the banking industry could easily withstand a severe recession, as their annual stress test showed that 23 institutions remain well above minimum capital levels, as CNBC reported. As a result, the financial sector ETF (XLF) rallied 1.21% on the day.
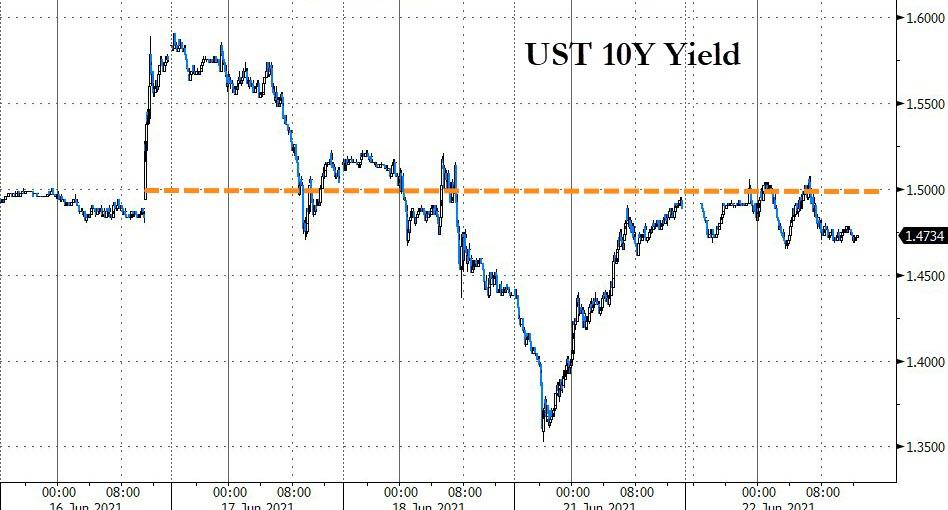
“Value” outperformed “growth” this week, but both showed strong tendencies and flip-flopped back and forth. Bond yields went sideways mid-week and spiked today, as the PCE (Personal Consumption Index) soared.
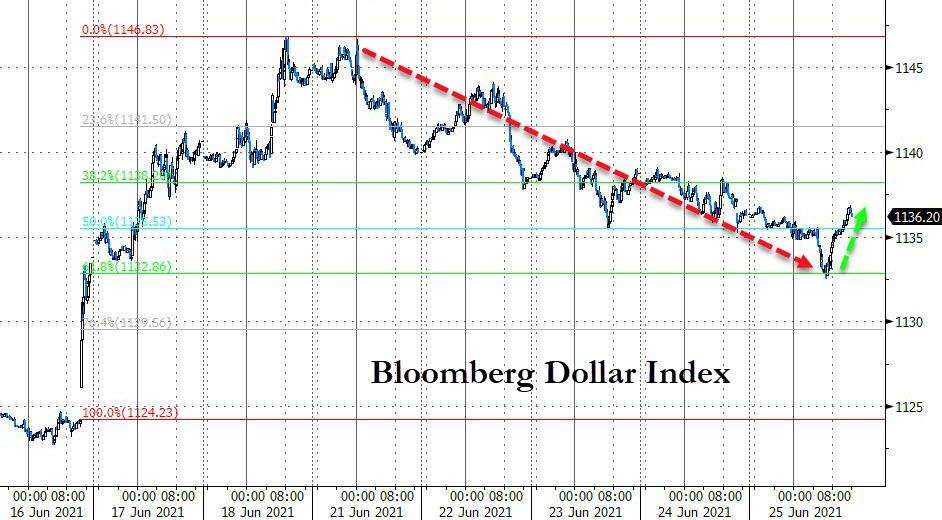
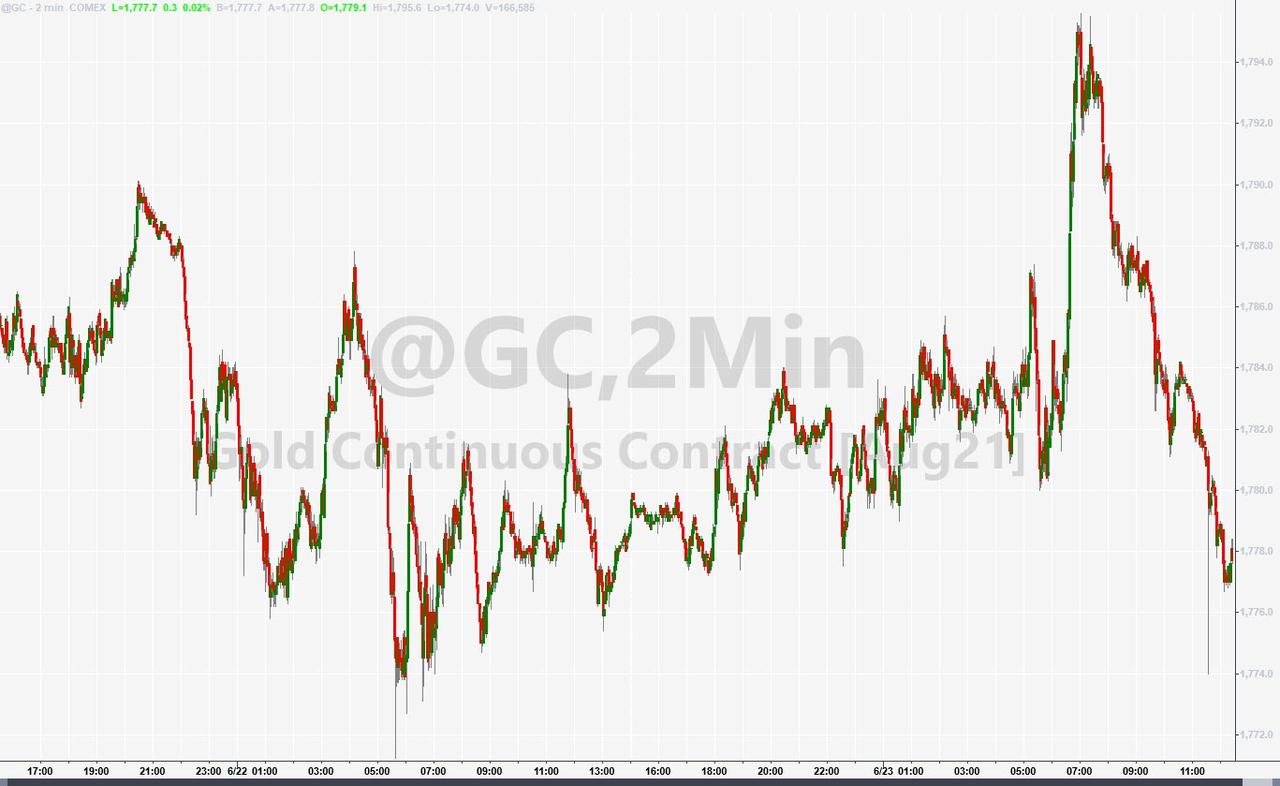
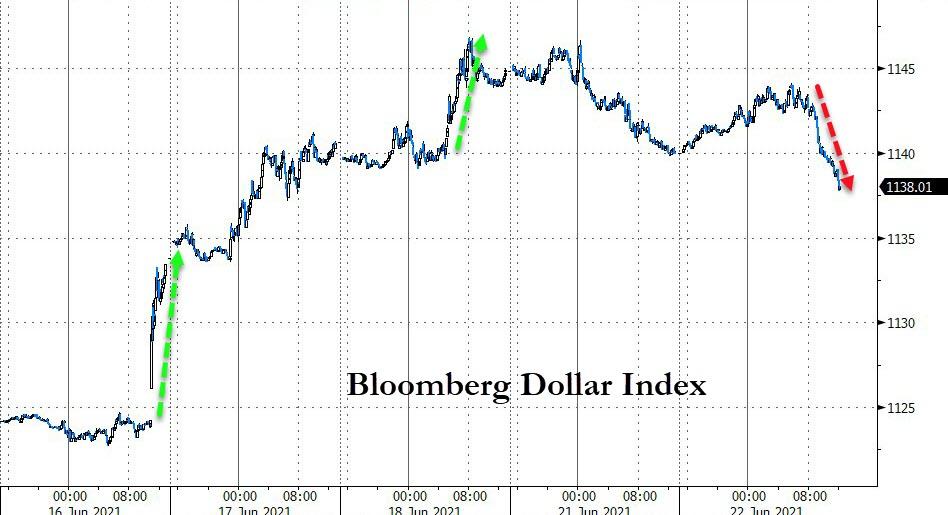
The US Dollar index has been retreating all week but managed to bounce today, yet it was not enough of a move to pull down gold. The precious metal managed to eke out a tiny gain of +0.19%.
With three more trading days left, it looks like the widely cited adage “sell in May and go away” may not materialize in June.
1. From the universe of over 1,800 ETFs, I have selected only those with a trading volume of over $5 million per day (HV ETFs), so that liquidity and a small bid/ask spread are assured.
2. Trend Tracking Indexes (TTIs)
Buy or Sell decisions for Domestic and International ETFs (section 1 and 2), are made based on the respective TTI and its position either above or below its long-term M/A (Moving Average). A crossing of the trend line from below accompanied by some staying power above constitutes a “Buy” signal. Conversely, a clear break below the line constitutes a “Sell” signal. Additionally, I use an 8% trailing stop loss on all positions in these categories to control downside risk.
3. All other investment arenas do not have a TTI and should be traded based on the position of the individual ETF relative to its own respective trend line (%M/A). That’s why those signals are referred to as a “Selective Buy.” In other words, if an ETF crosses its own trendline to the upside, a “Buy” signal is generated. Since these areas tend to be more volatile, I recommend a wider trailing sell stop of 8%-10% depending on your risk tolerance.
If you are unfamiliar with some of the terminology, please see Glossary of Termsand new subscriber information in section 9.
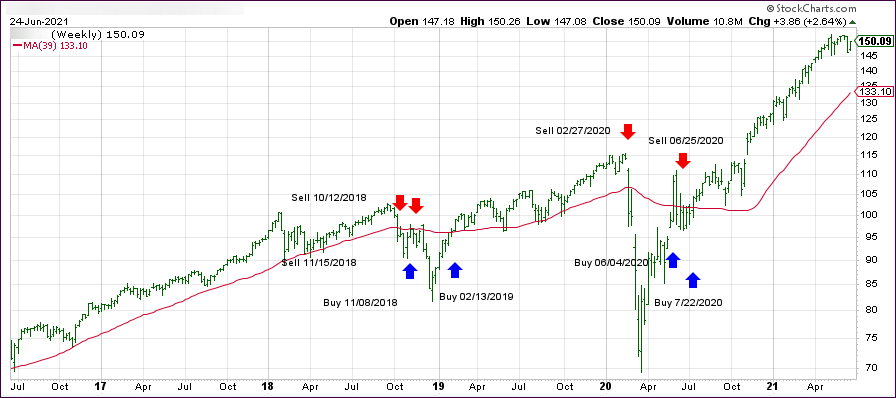
1. DOMESTIC EQUITY ETFs: BUY— since 07/22/2020
Click on chart to enlarge
Our main directional indicator, the Domestic Trend Tracking Index (TTI-green line in the above chart) has now rallied above its long-term trend line (red) by +13.42% and remains in “BUY” mode as posted.
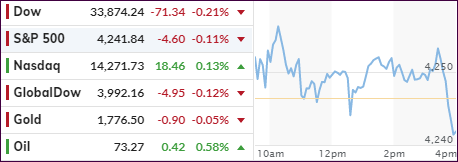
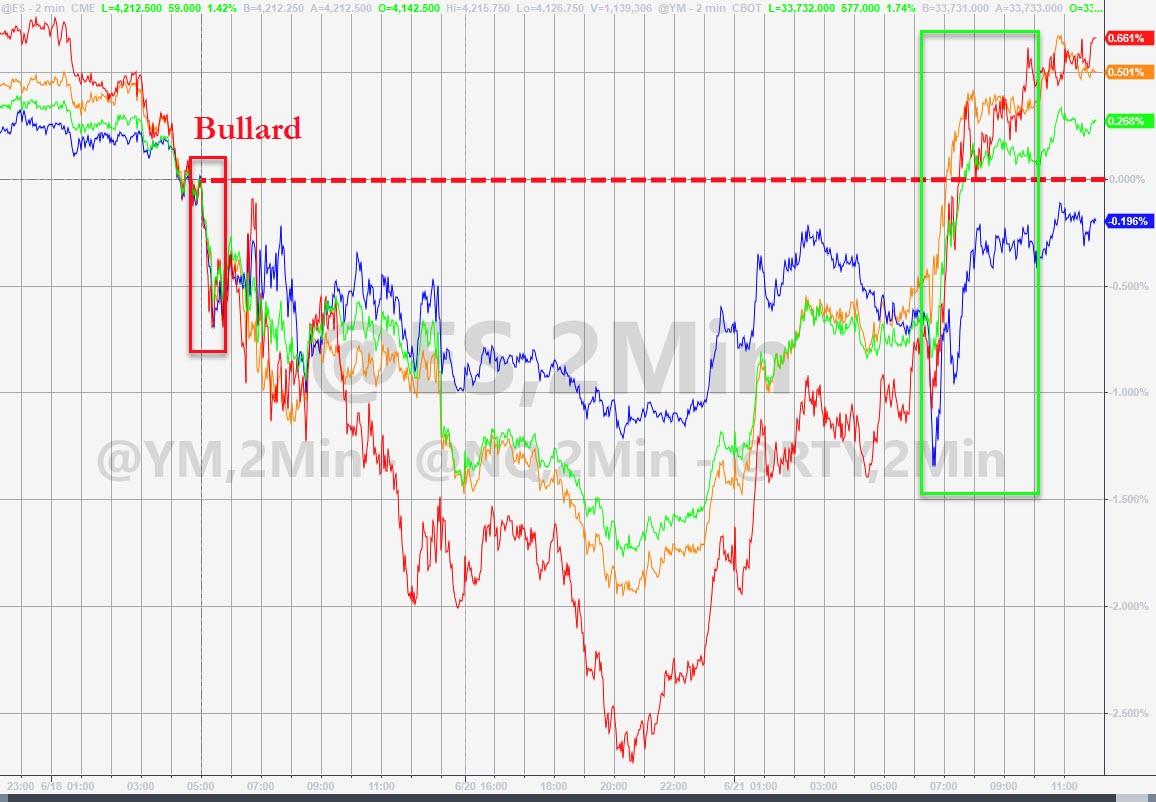
While the major indexes were shooting for a 3rd winning day in a row, the session turned out to be sloppy one with only the Nasdaq closing in the green, while the Dow and S&P 500 danced around their respective unchanged lines. Both dove into the close and ended up with tiny losses.
So far, for the month of June only the S&P 500 and the Nasdaq are in the green having gained 0.9% and 3.8%, while the Dow remains in the red due to weakness in its Caterpillar and JPM components.
Small Caps were moderately higher, but Dallas Fed President Kaplan spoiled the party today with these hawkish remarks, as Zero Hedge pointed out:
The U.S. economy will likely meet the Federal Reserve’s threshold for tapering its asset purchases sooner than people think.
As we make substantial further progress, which I think will happen sooner than people expect — sooner rather than later — and we’re weathering the pandemic, I think we’d be far better off, from a risk-management point of view, beginning to adjust these purchases of Treasuries and mortgage-backed securities.
I’d rather start tapering, assuming we meet our conditions, sooner rather than later so that we have more flexibility in deciding what we want to do on rates down the road.
That was enough cold water to send the Dow and S&P into the red where they closed at the session’s lows.
The US Dollar index trod water and ended just about unchanged, as did bond yields. Gold gave up it’s early gains and closed slightly in the red.
Not much gained and not much lost sums up this Wednesday session.
Due to some business commitments, I will be out tomorrow. The next market commentary will be posted on Friday.
Despite yesterday’s massive rebound, the markets did not waver but stayed the course and notched more gains. The S&P 500 was trying to get into record territory but fell short, while the Nasdaq showed more upside momentum and climbed to a new all-time high.
The tech sector led Tuesday’s advance by a modest margin, with Small Caps following suit, whereas the value ETF RPV remained unchanged after Monday’s impressive jump.
Equities accelerated to the upside when Fed head Powell answered questions from House members that underscored his bullishness about the economic comeback, while maintaining his stubborn stance that inflationary forces were transitory. He emphasized that inflation should settle back to 2% over the long term.
Be that as it may, the markets took it as a dovish sign and green ended up being the choice color of the day.
The 10-year bond yield rose to touch the 1.5% level but backed off and closed at 1.48%, down 2 basis points. Even though the US Dollar index gave back some of its recent gains, it was not enough to spark a rally in Gold which, in the absence of buying interest, dropped -0.36%.
In the end, it was a positive session after a huge rally, which has a chance to continue provided that dovish jawboning stays headline news.
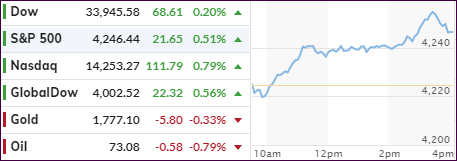
Ripping higher after the sound of today’s opening bell had barely faded was the meme for the day with the major indexes posting solid gains after last week’s Fed induced pullback. Dipping into the red early on was the Nasdaq, which recovered but lagged throughout the session.
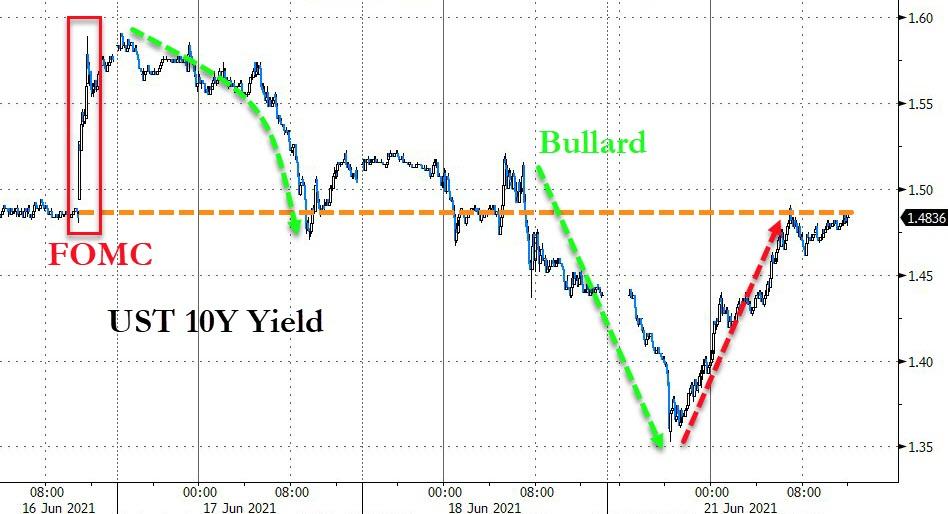
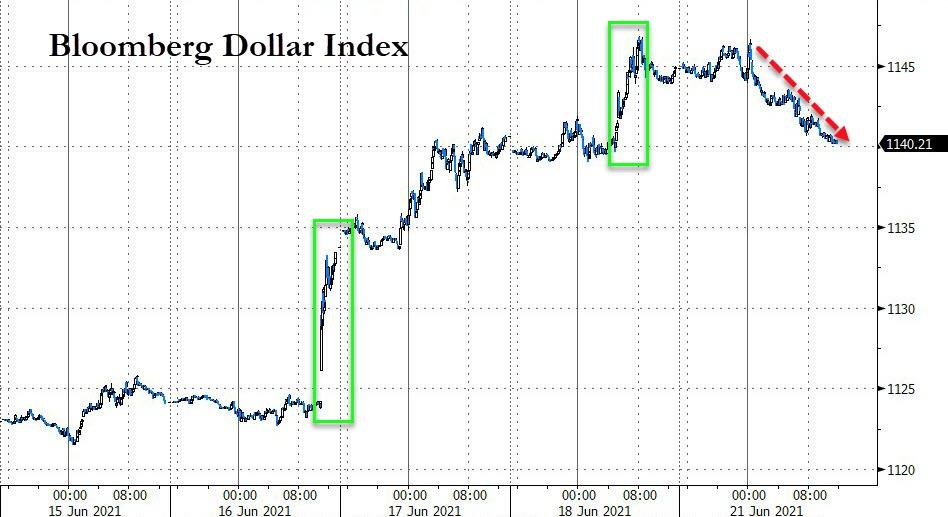
When all was said and done, Friday’s plunge was entirely wiped out, and we now find ourselves back at the closing levels of last Thursday. Apparently, traders came to their senses over the weekend due to the Fed’s announcement of possible rate hikes in 2023 being nothing more than jawboning about a distant future, with no imminent action being on deck that could jeopardize the current bullish theme.
As a result, the markets focused on the present moment and staged a broad rally that allowed some of last week’s hard-hit sectors to recover nicely. “Value” outperformed “growth,” with RPV racing ahead by +2.50% followed by the financials (XLF) with +2.33%. Even the commodities index DBC showed signs of life with a gain of +1.34%.
ZeroHedge pointed out that things got started in Japan last night with their respective Plunge Protection Team (PPT), which bought some $70 billion of ETFs, sending the Nikkei on a rampage. The US followed suit by assembling their own PPT, picked up the baton and the levitation began.
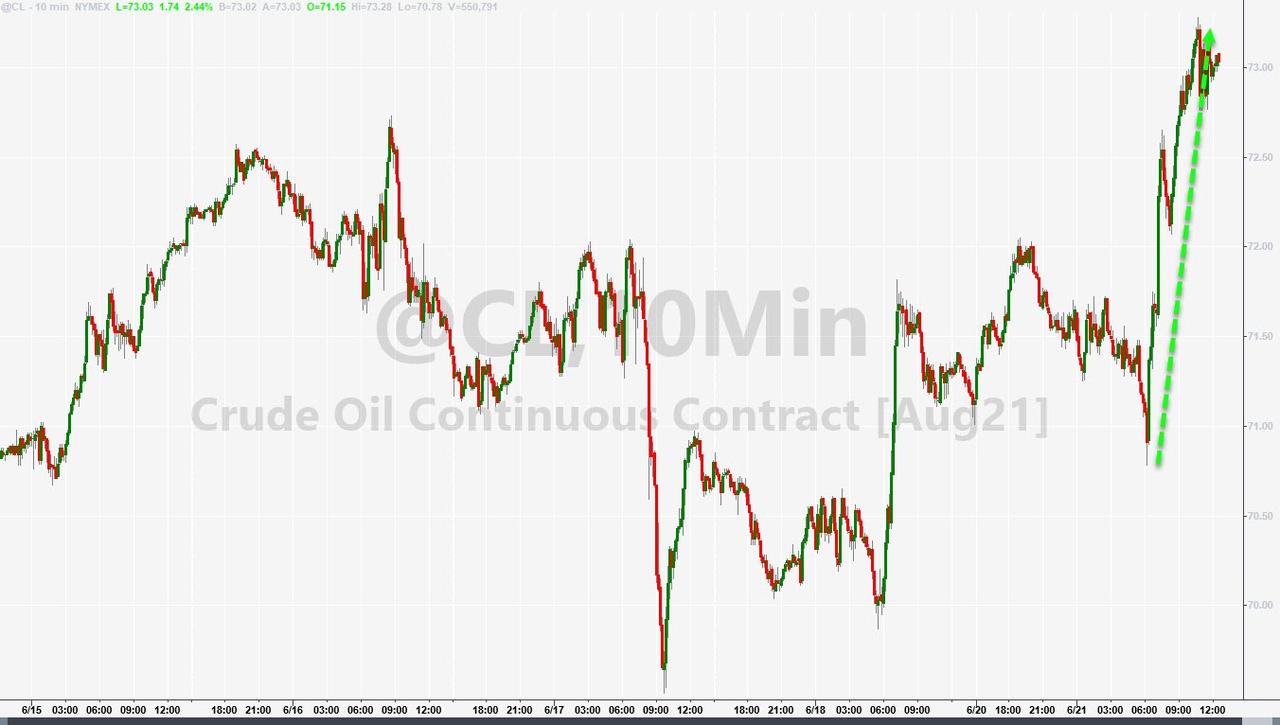
10-year bond yields spiked to Friday’s level, while the US Dollar gave back some of its recent gains. Commodities bounced across the board with GLD adding +1.21%, but more concerning in terms of inflation was Crude Oil’s surge to over $73.
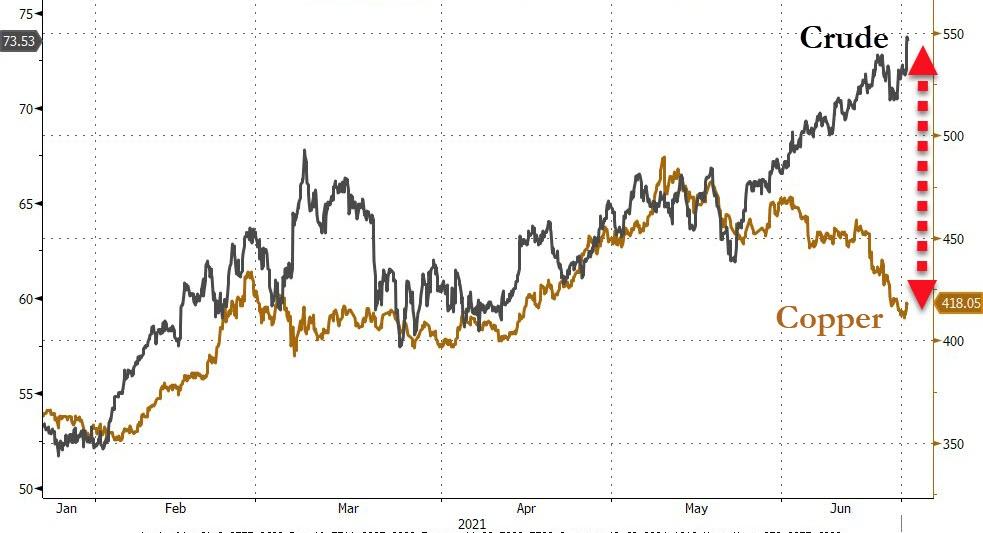
The direction of some commodities can be a harbinger of what might happen next in the stock market. That lead ZeroHedge to post the question “Is Dr. Copper or Dr. Crude right about what happens next?” Bloomberg points to the divergence in this chart.

