
- Moving the markets
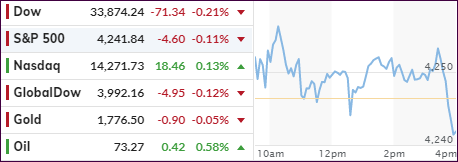
While the major indexes were shooting for a 3rd winning day in a row, the session turned out to be sloppy one with only the Nasdaq closing in the green, while the Dow and S&P 500 danced around their respective unchanged lines. Both dove into the close and ended up with tiny losses.
So far, for the month of June only the S&P 500 and the Nasdaq are in the green having gained 0.9% and 3.8%, while the Dow remains in the red due to weakness in its Caterpillar and JPM components.
Small Caps were moderately higher, but Dallas Fed President Kaplan spoiled the party today with these hawkish remarks, as Zero Hedge pointed out:
The U.S. economy will likely meet the Federal Reserve’s threshold for tapering its asset purchases sooner than people think.
As we make substantial further progress, which I think will happen sooner than people expect — sooner rather than later — and we’re weathering the pandemic, I think we’d be far better off, from a risk-management point of view, beginning to adjust these purchases of Treasuries and mortgage-backed securities.
I’d rather start tapering, assuming we meet our conditions, sooner rather than later so that we have more flexibility in deciding what we want to do on rates down the road.
That was enough cold water to send the Dow and S&P into the red where they closed at the session’s lows.
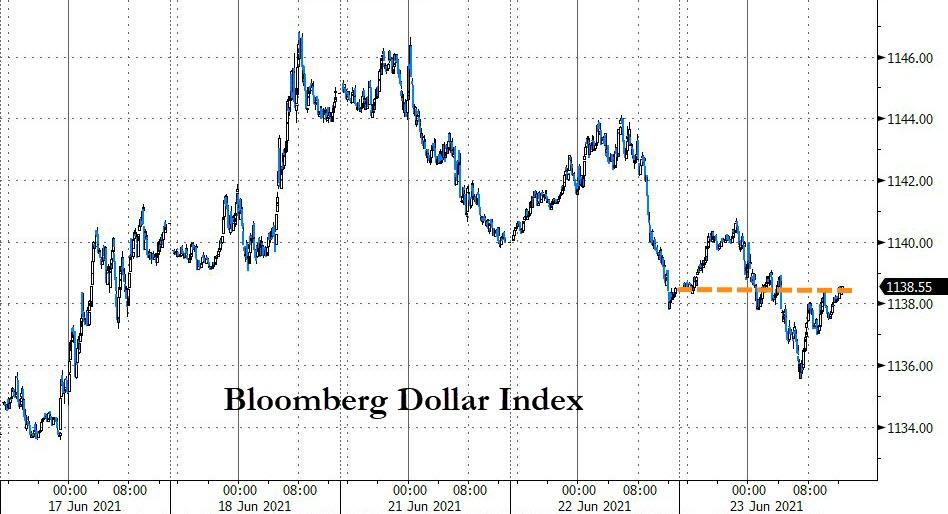
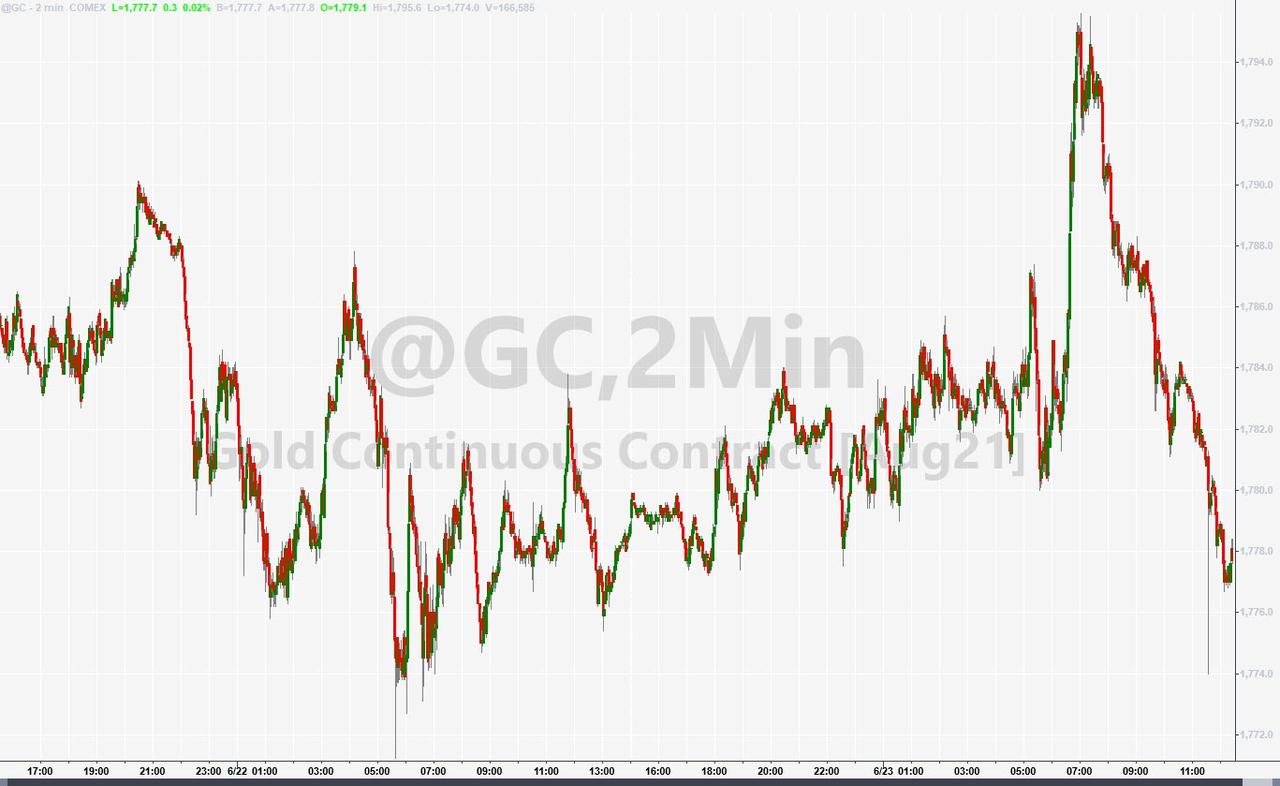
The US Dollar index trod water and ended just about unchanged, as did bond yields. Gold gave up it’s early gains and closed slightly in the red.
Not much gained and not much lost sums up this Wednesday session.
Due to some business commitments, I will be out tomorrow. The next market commentary will be posted on Friday.
2. ETFs in the Spotlight
In case you missed the announcement and description of this section, you can read it here again.
It features some of the 10 broadly diversified domestic and sector ETFs from my HighVolume list as posted every Saturday. Furthermore, they are screened for the lowest MaxDD% number meaning they have been showing better resistance to temporary sell offs than all others over the past year.
The below table simply demonstrates the magnitude with which these ETFs are fluctuating above or below their respective individual trend lines (%+/-M/A). A break below, represented by a negative number, shows weakness, while a break above, represented by a positive percentage, shows strength.
For hundreds of ETF choices, be sure to reference Thursday’s StatSheet.
For this current domestic “Buy” cycle, here’s how some our candidates have fared:
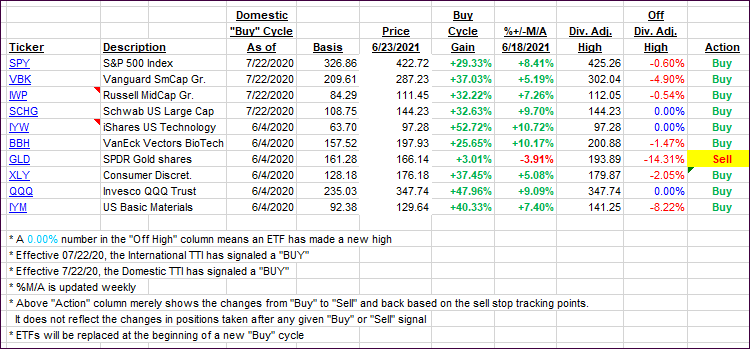
Click image to enlarge.
Again, the %+/-M/A column above shows the position of the various ETFs in relation to their respective long-term trend lines, while the trailing sell stops are being tracked in the “Off High” column. The “Action” column will signal a “Sell” once the -8% point has been taken out in the “Off High” column. For more volatile sector ETFs, the trigger point is -10%.
3. Trend Tracking Indexes (TTIs)
Our TTIs went nowhere as the markets trod water.
This is how we closed 06/23/2021:
Domestic TTI: +12.68% above its M/A (prior close +12.87%)—Buy signal effective 07/22/2020.
International TTI: +10.92% above its M/A (prior close +11.21%)—Buy signals effective 07/22/2020.
Disclosure: I am obliged to inform you that I, as well as my advisory clients, own some of the ETFs listed in the above table. Furthermore, they do not represent a specific investment recommendation for you, they merely show which ETFs from the universe I track are falling within the specified guidelines.
All linked charts above are courtesy of Bloomberg via ZeroHedge.
Contact Ulli