
- Moving the markets
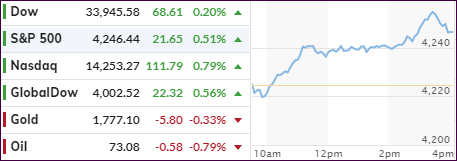
Despite yesterday’s massive rebound, the markets did not waver but stayed the course and notched more gains. The S&P 500 was trying to get into record territory but fell short, while the Nasdaq showed more upside momentum and climbed to a new all-time high.
The tech sector led Tuesday’s advance by a modest margin, with Small Caps following suit, whereas the value ETF RPV remained unchanged after Monday’s impressive jump.
Equities accelerated to the upside when Fed head Powell answered questions from House members that underscored his bullishness about the economic comeback, while maintaining his stubborn stance that inflationary forces were transitory. He emphasized that inflation should settle back to 2% over the long term.
Be that as it may, the markets took it as a dovish sign and green ended up being the choice color of the day.
The 10-year bond yield rose to touch the 1.5% level but backed off and closed at 1.48%, down 2 basis points. Even though the US Dollar index gave back some of its recent gains, it was not enough to spark a rally in Gold which, in the absence of buying interest, dropped -0.36%.
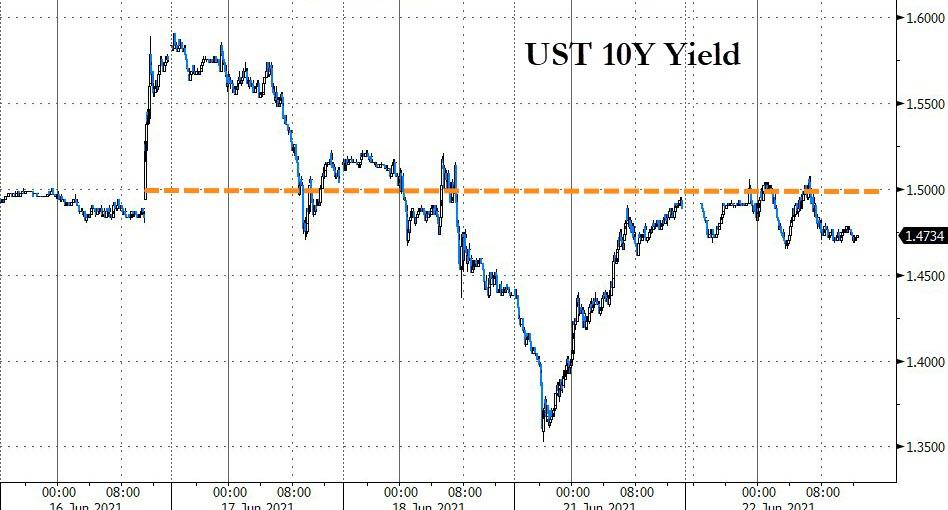
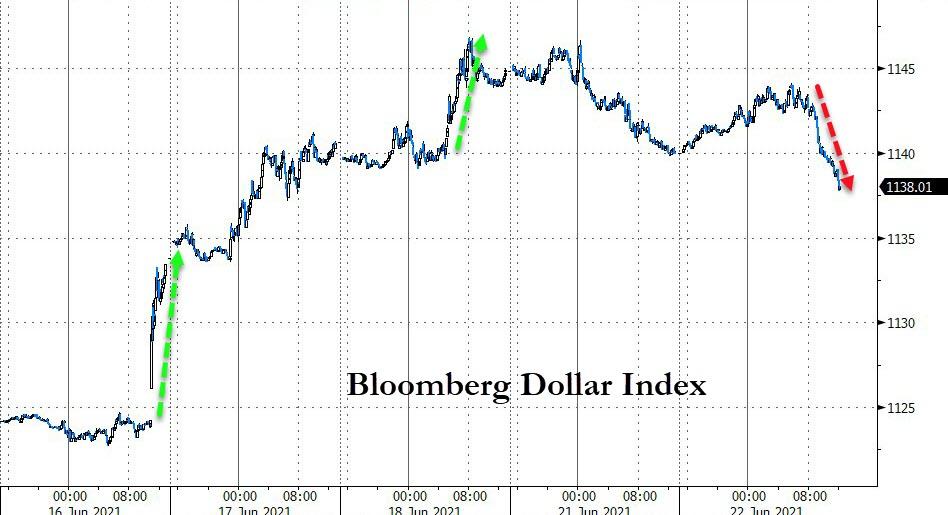
In the end, it was a positive session after a huge rally, which has a chance to continue provided that dovish jawboning stays headline news.
2. ETFs in the Spotlight
In case you missed the announcement and description of this section, you can read it here again.
It features some of the 10 broadly diversified domestic and sector ETFs from my HighVolume list as posted every Saturday. Furthermore, they are screened for the lowest MaxDD% number meaning they have been showing better resistance to temporary sell offs than all others over the past year.
The below table simply demonstrates the magnitude with which these ETFs are fluctuating above or below their respective individual trend lines (%+/-M/A). A break below, represented by a negative number, shows weakness, while a break above, represented by a positive percentage, shows strength.
For hundreds of ETF choices, be sure to reference Thursday’s StatSheet.
For this current domestic “Buy” cycle, here’s how some our candidates have fared:
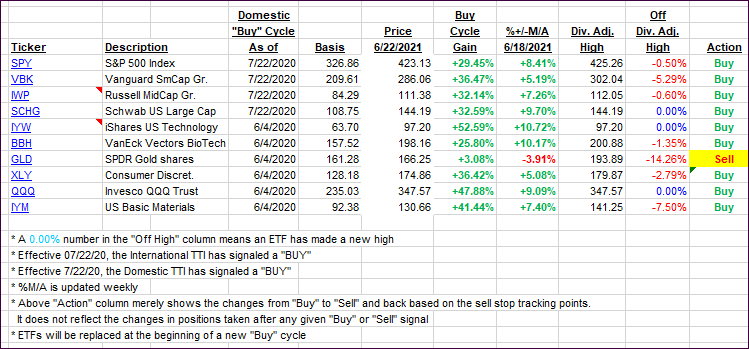
Click image to enlarge.
Again, the %+/-M/A column above shows the position of the various ETFs in relation to their respective long-term trend lines, while the trailing sell stops are being tracked in the “Off High” column. The “Action” column will signal a “Sell” once the -8% point has been taken out in the “Off High” column. For more volatile sector ETFs, the trigger point is -10%.
3. Trend Tracking Indexes (TTIs)
Our TTIs edged a little higher as the bullish meme continued.
This is how we closed 06/22/2021:
Domestic TTI: +12.87% above its M/A (prior close +12.64%)—Buy signal effective 07/22/2020.
International TTI: +11.21% above its M/A (prior close +10.63%)—Buy signals effective 07/22/2020.
Disclosure: I am obliged to inform you that I, as well as my advisory clients, own some of the ETFs listed in the above table. Furthermore, they do not represent a specific investment recommendation for you, they merely show which ETFs from the universe I track are falling within the specified guidelines.
All linked charts above are courtesy of Bloomberg via ZeroHedge.
Contact Ulli