
- Moving the markets
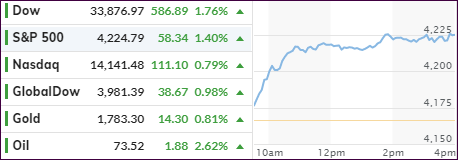
Ripping higher after the sound of today’s opening bell had barely faded was the meme for the day with the major indexes posting solid gains after last week’s Fed induced pullback. Dipping into the red early on was the Nasdaq, which recovered but lagged throughout the session.
When all was said and done, Friday’s plunge was entirely wiped out, and we now find ourselves back at the closing levels of last Thursday. Apparently, traders came to their senses over the weekend due to the Fed’s announcement of possible rate hikes in 2023 being nothing more than jawboning about a distant future, with no imminent action being on deck that could jeopardize the current bullish theme.
As a result, the markets focused on the present moment and staged a broad rally that allowed some of last week’s hard-hit sectors to recover nicely. “Value” outperformed “growth,” with RPV racing ahead by +2.50% followed by the financials (XLF) with +2.33%. Even the commodities index DBC showed signs of life with a gain of +1.34%.
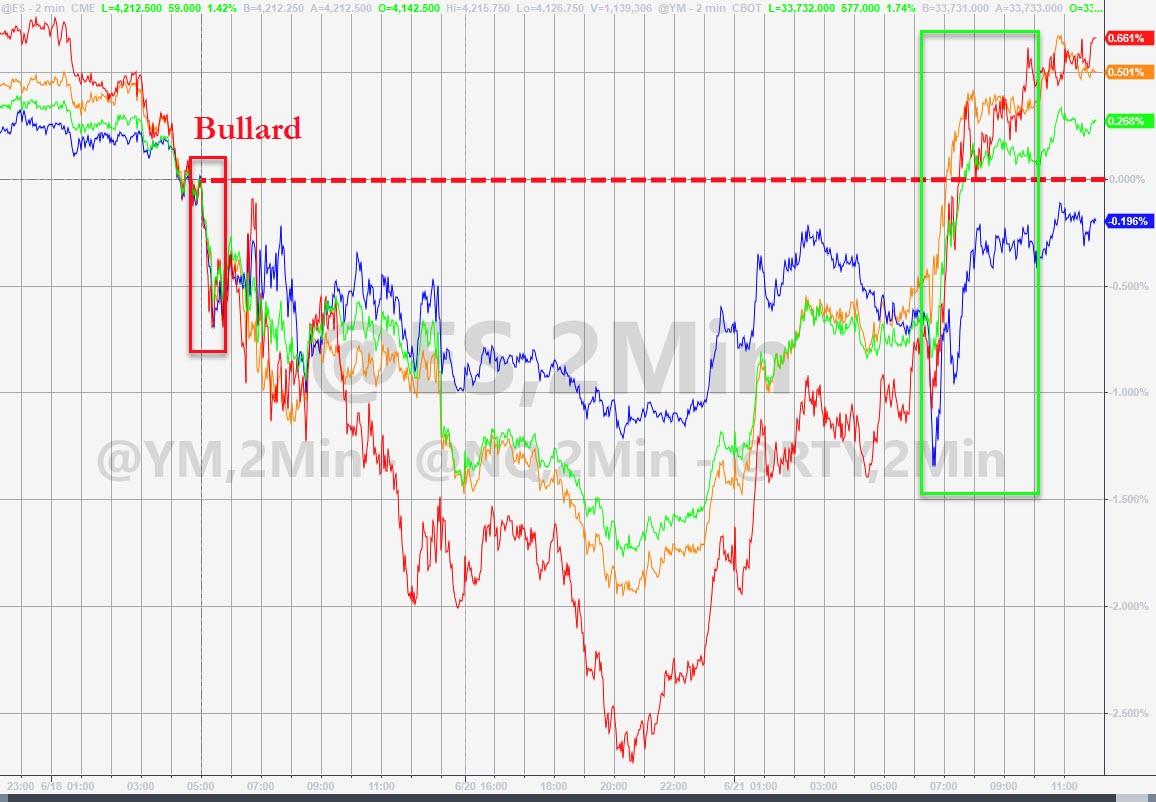
ZeroHedge pointed out that things got started in Japan last night with their respective Plunge Protection Team (PPT), which bought some $70 billion of ETFs, sending the Nikkei on a rampage. The US followed suit by assembling their own PPT, picked up the baton and the levitation began.
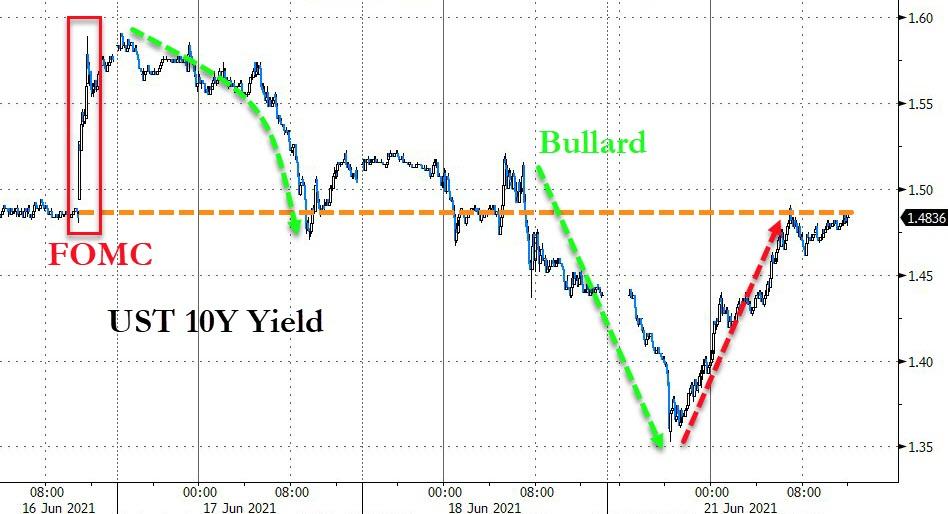
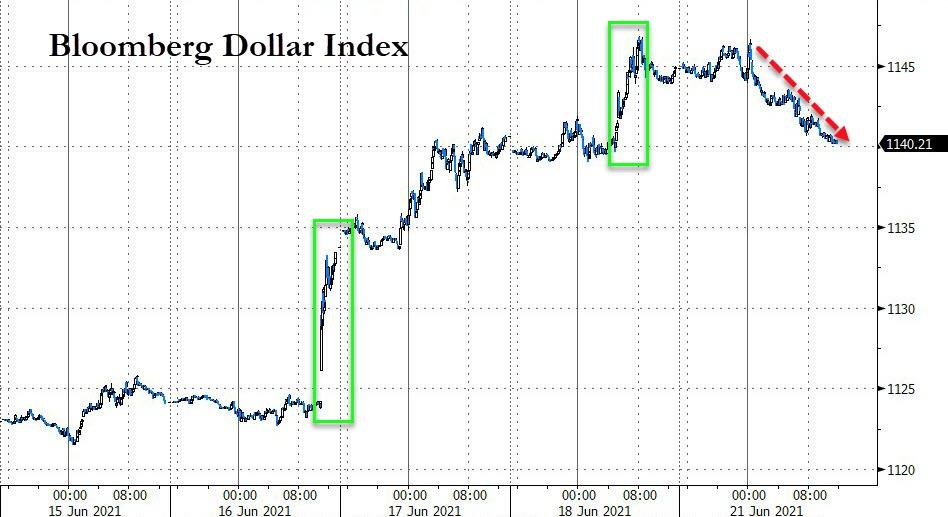
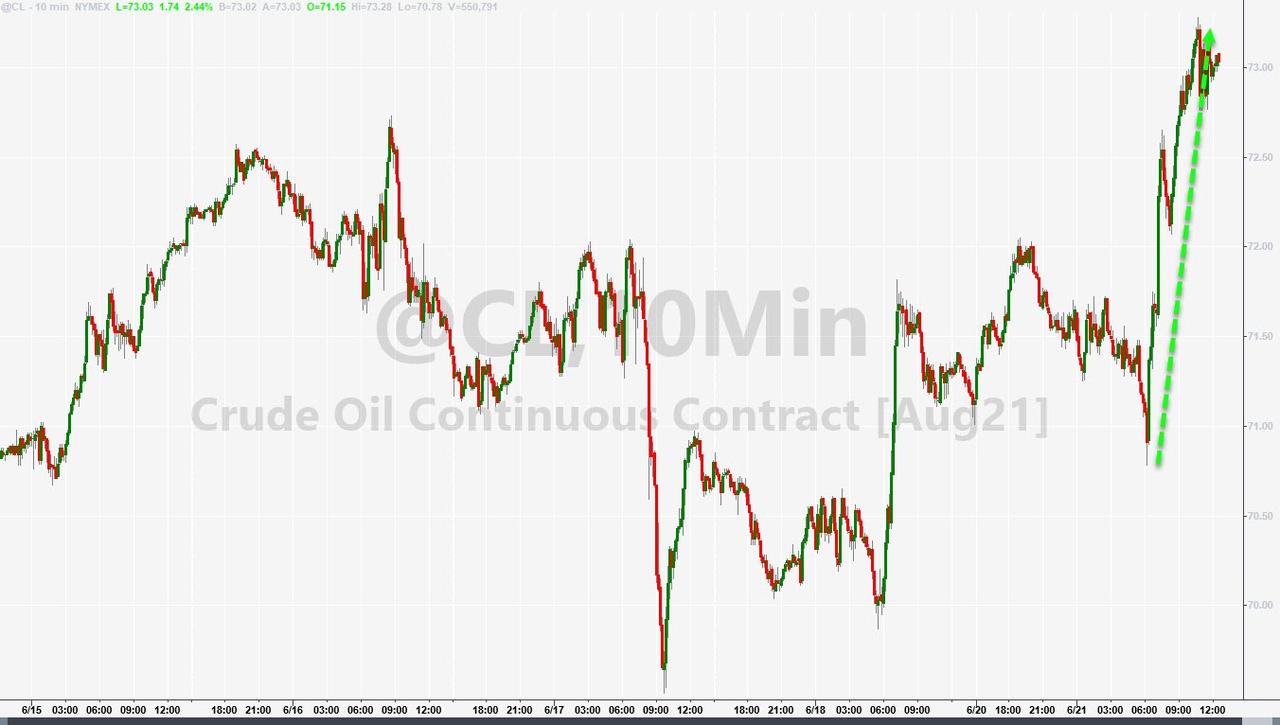
10-year bond yields spiked to Friday’s level, while the US Dollar gave back some of its recent gains. Commodities bounced across the board with GLD adding +1.21%, but more concerning in terms of inflation was Crude Oil’s surge to over $73.
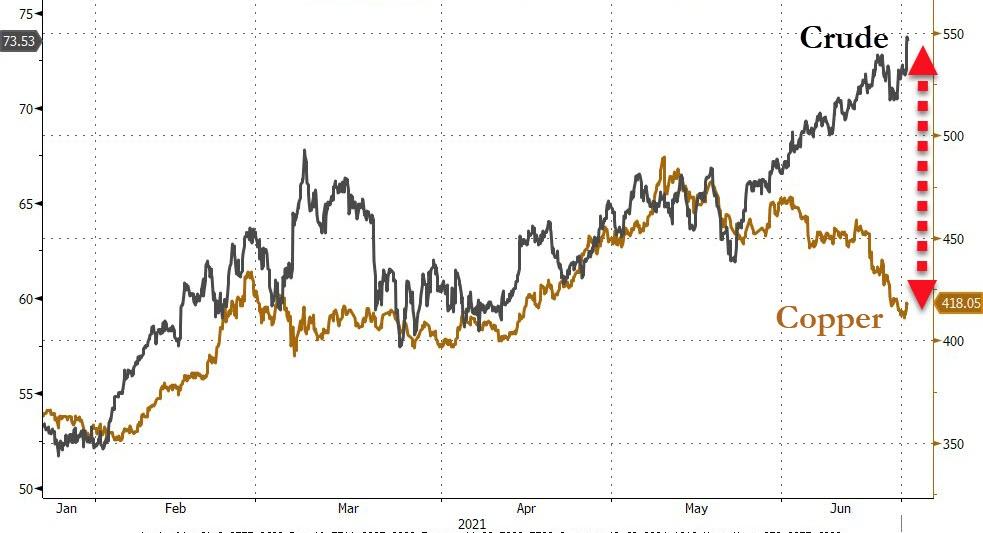
The direction of some commodities can be a harbinger of what might happen next in the stock market. That lead ZeroHedge to post the question “Is Dr. Copper or Dr. Crude right about what happens next?” Bloomberg points to the divergence in this chart.
2. ETFs in the Spotlight
In case you missed the announcement and description of this section, you can read it here again.
It features some of the 10 broadly diversified domestic and sector ETFs from my HighVolume list as posted every Saturday. Furthermore, they are screened for the lowest MaxDD% number meaning they have been showing better resistance to temporary sell offs than all others over the past year.
The below table simply demonstrates the magnitude with which these ETFs are fluctuating above or below their respective individual trend lines (%+/-M/A). A break below, represented by a negative number, shows weakness, while a break above, represented by a positive percentage, shows strength.
For hundreds of ETF choices, be sure to reference Thursday’s StatSheet.
For this current domestic “Buy” cycle, here’s how some our candidates have fared:
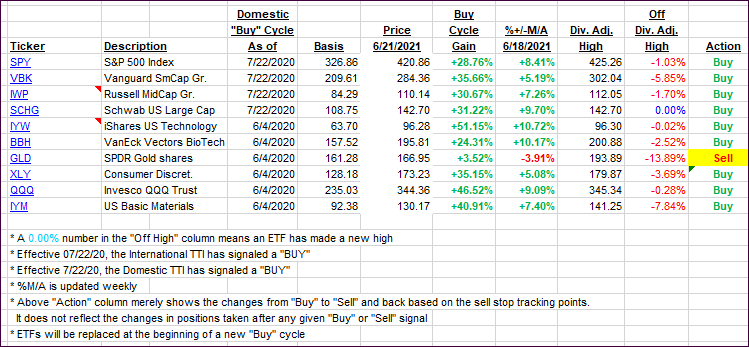
Click image to enlarge.
Again, the %+/-M/A column above shows the position of the various ETFs in relation to their respective long-term trend lines, while the trailing sell stops are being tracked in the “Off High” column. The “Action” column will signal a “Sell” once the -8% point has been taken out in the “Off High” column. For more volatile sector ETFs, the trigger point is -10%.
3. Trend Tracking Indexes (TTIs)
Our TTIs surged thereby eliminating the need for liquidation of one of our holdings, which had ventured closely to its trailing sell stop.
This is how we closed 06/21/2021:
Domestic TTI: +12.64% above its M/A (prior close +10.82%)—Buy signal effective 07/22/2020.
International TTI: +10.63% above its M/A (prior close +9.54%)—Buy signals effective 07/22/2020.
Disclosure: I am obliged to inform you that I, as well as my advisory clients, own some of the ETFs listed in the above table. Furthermore, they do not represent a specific investment recommendation for you, they merely show which ETFs from the universe I track are falling within the specified guidelines.
All linked charts above are courtesy of Bloomberg via ZeroHedge.
Contact Ulli