Below, please find the latest High-Volume ETF Cutline report, which shows how far above or below their respective long-term trend lines (39-week SMA) my currently tracked ETFs are positioned.
This report covers the HV ETF Master List from Thursday’s StatSheet and includes 312 High Volume ETFs, defined as those with an average daily volume of more than $5 million, of which currently 117 (last week 107) are hovering in bullish territory. The yellow line separates those ETFs that are positioned above their trend line (%M/A) from those that have dropped below it.
In case you are not familiar with some of the terminology used in the reports, please read the Glossary of Terms. If you missed the original post about the Cutline approach, you can read it here.
Given the news events this week, it has become clear that markets have simply disconnected from reality and therefore were able to climb a wall of worry. Here’s why:
The war in Ukraine continues
The Fed is set to hike rates more massively several times this year
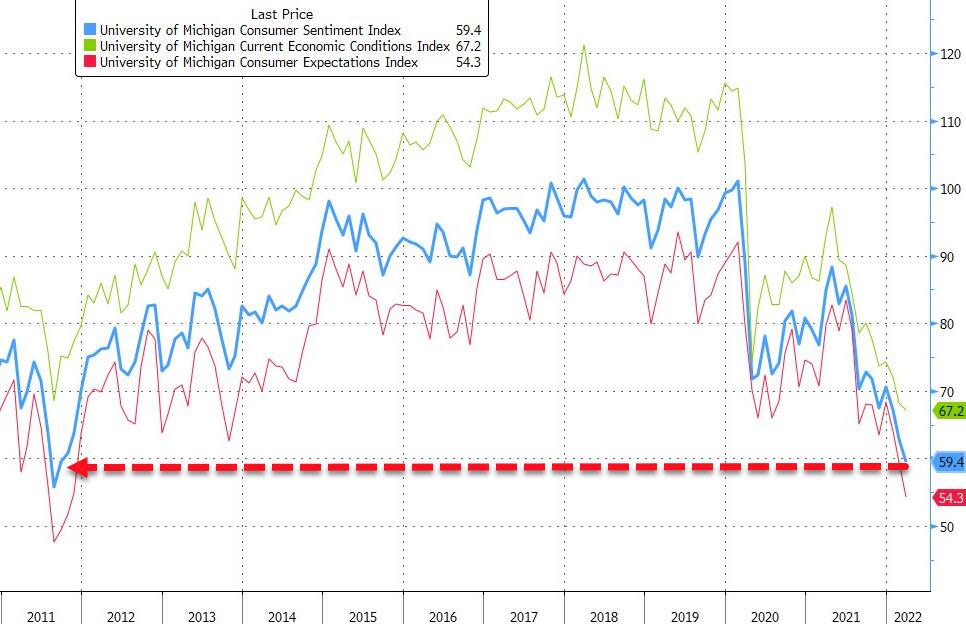
Inflation is accelerating (Expectations are at a 41-year high)
Economic Stagflation is anticipated to strike later in 2022
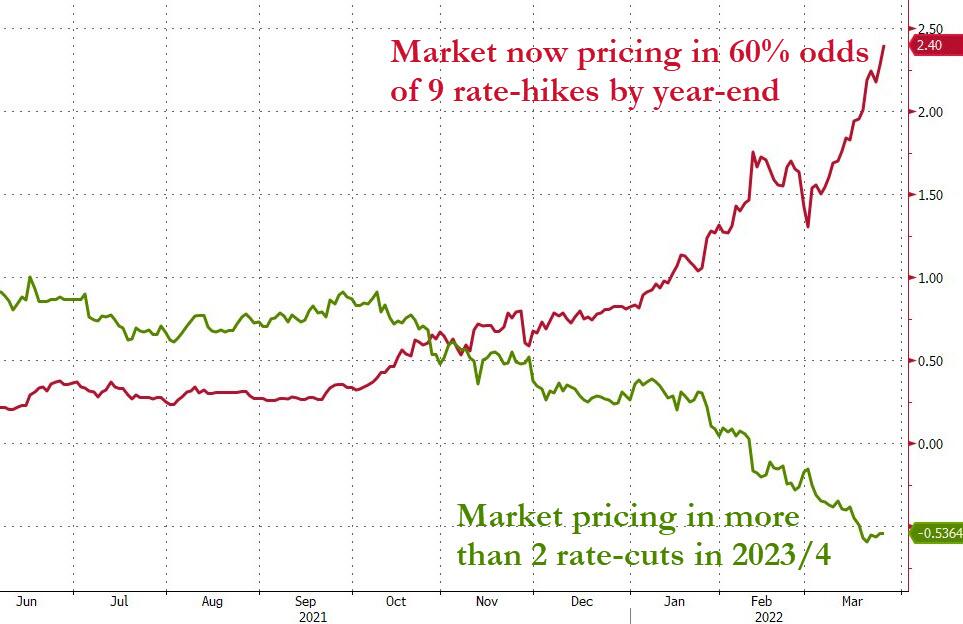
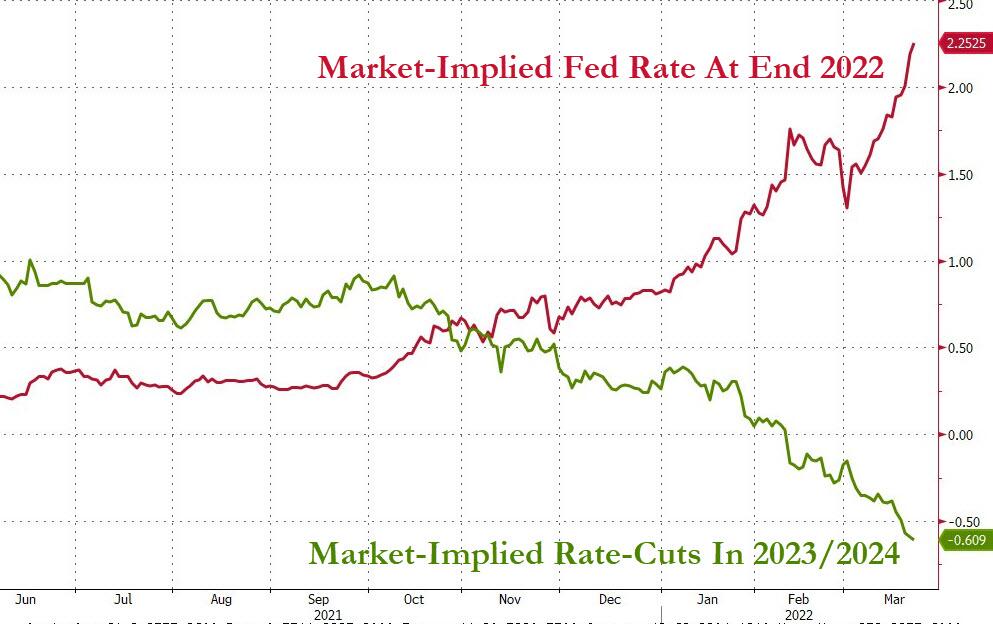
The market is now pricing in 60% odds of 9 rate-hikes by year end, as ZH explained, which then is followed by more than 2 rate-cut expectations in 2023/24, as a recession makes its presence felt.
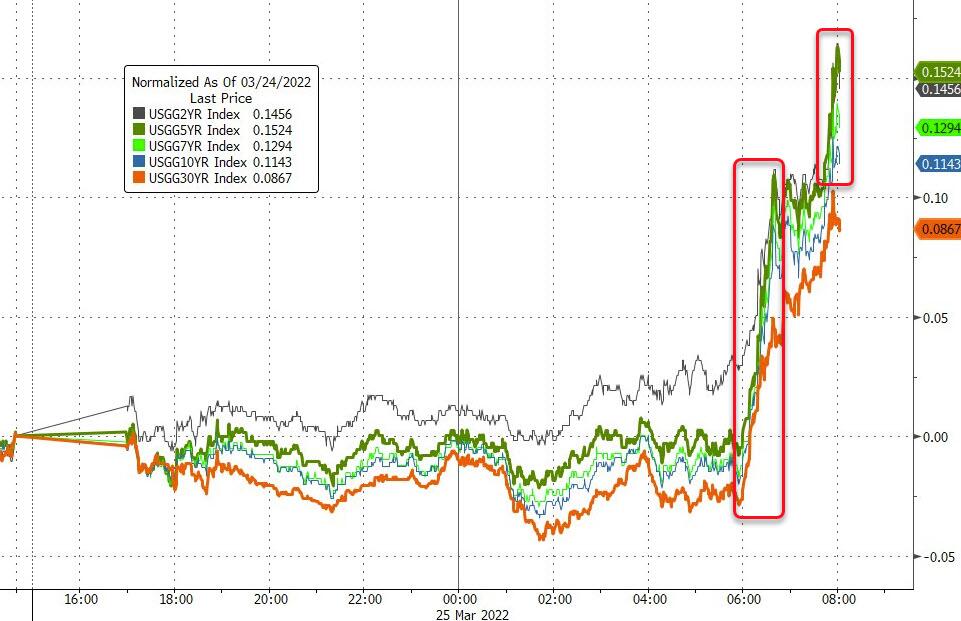
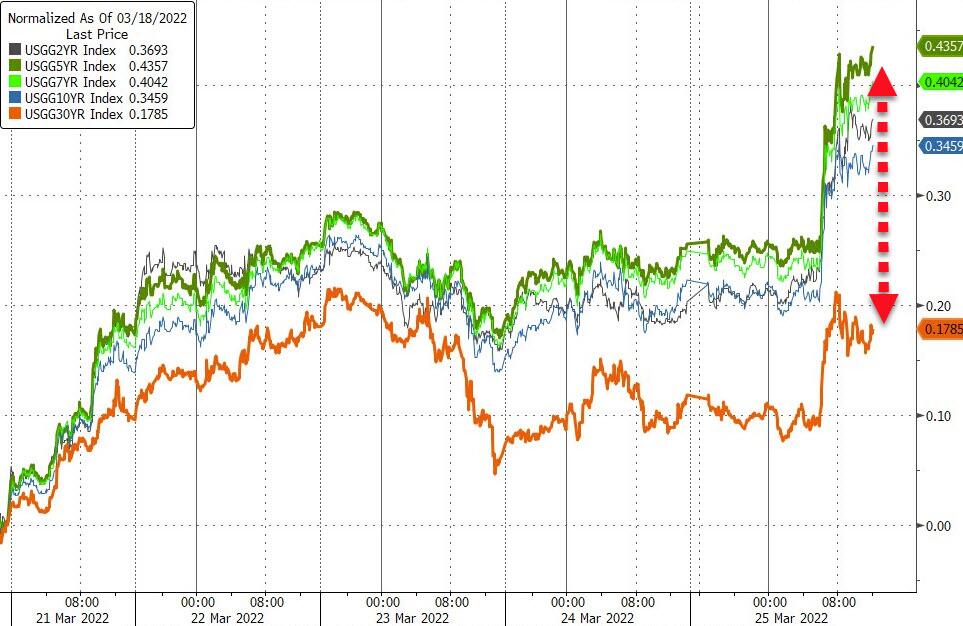
The bloodbath in bonds continued today, with the 5-year yield up an amazing 44 bps, while the 10-year added over 11 bps to close at 2.485%. The widely held 20-year bond ETF TLT is now down almost -12% for the year. Ouch!
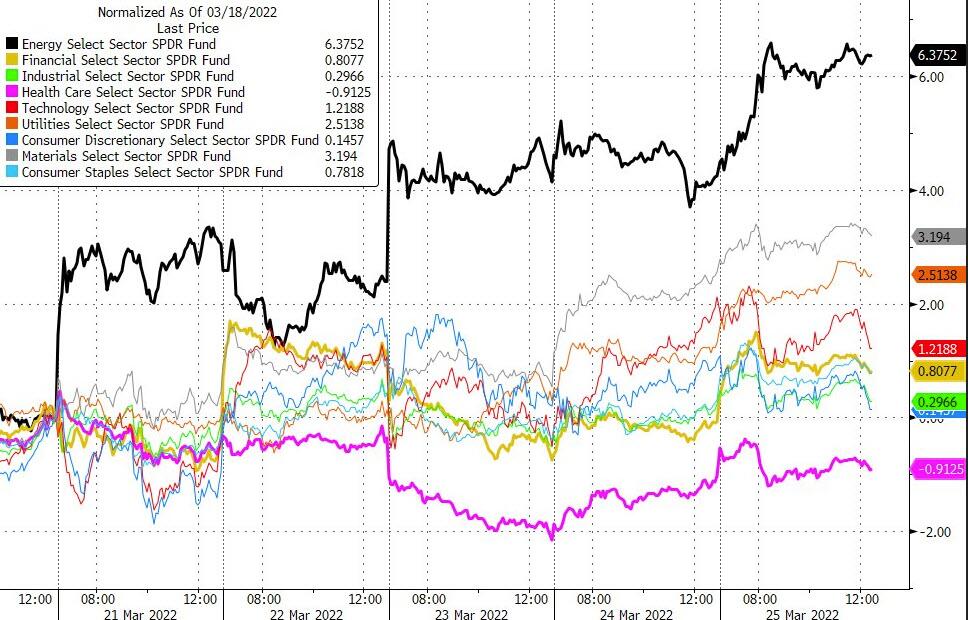
Given the host of uncertainties around the globe, it comes as no surprise that the Energy Sector outperformed, while healthcare was the laggard, as this chart shows. The US Dollar gained modestly for the week, while Gold reclaimed its $1,950 level.
With only 4 trading days left till the end of the quarter, some rebalancing may push markets around next week, but ZH expects the “buy bonds/sell stocks” theme to be prevalent.
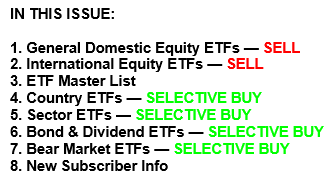
1. From the universe of over 1,800 ETFs, I have selected only those with a trading volume of over $5 million per day (HV ETFs), so that liquidity and a small bid/ask spread are assured.
2. Trend Tracking Indexes (TTIs)
Buy or Sell decisions for Domestic and International ETFs (section 1 and 2), are made based on the respective TTI and its position either above or below its long-term M/A (Moving Average). A crossing of the trend line from below accompanied by some staying power above constitutes a “Buy” signal. Conversely, a clear break below the line constitutes a “Sell” signal. Additionally, I use an 12% trailing stop loss on all positions in these categories to control downside risk.
3. All other investment arenas do not have a TTI and should be traded based on the position of the individual ETF relative to its own respective trend line (%M/A). That’s why those signals are referred to as a “Selective Buy.” In other words, if an ETF crosses its own trendline to the upside, a “Buy” signal is generated. Here too, I recommend trailing sell stop of 12%, or less, depending on your risk tolerance.
If you are unfamiliar with some of the terminology, please see Glossary of Termsand new subscriber information in section 9.
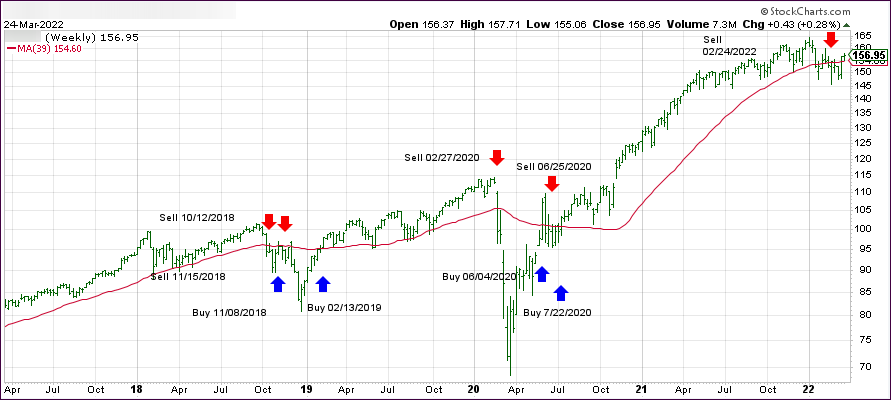
1. DOMESTIC EQUITY ETFs: SELL— since 02/24/2022
Click on chart to enlarge
Our main directional indicator, the Domestic Trend Tracking Index (TTI-green line in the above chart) has just broken above its long-term trend line (red) by +1.23% and remains in “SELL” mode—although it is on the edge of moving back to the Buy side.
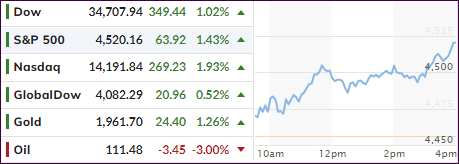
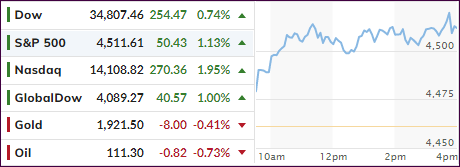
After yesterday’s drubbing, short-term market direction reversed again with the major indexes recovering just about all of Wednesday’s losses.
A drop in jobless claims to the lowest in decades provided the backdrop and gave confidence that the economic recovery remains on track, despite much evidence to the contrary.
Hope that a ceasefire in Ukraine could be forthcoming may have been just overly optimistic thinking, but it helped to support the bullish mood, nonetheless.
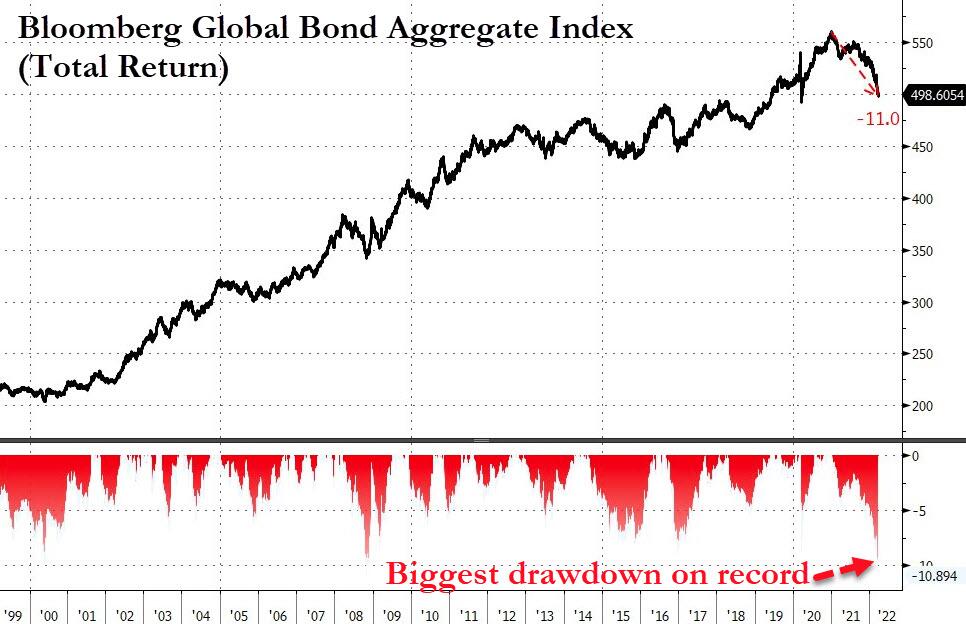
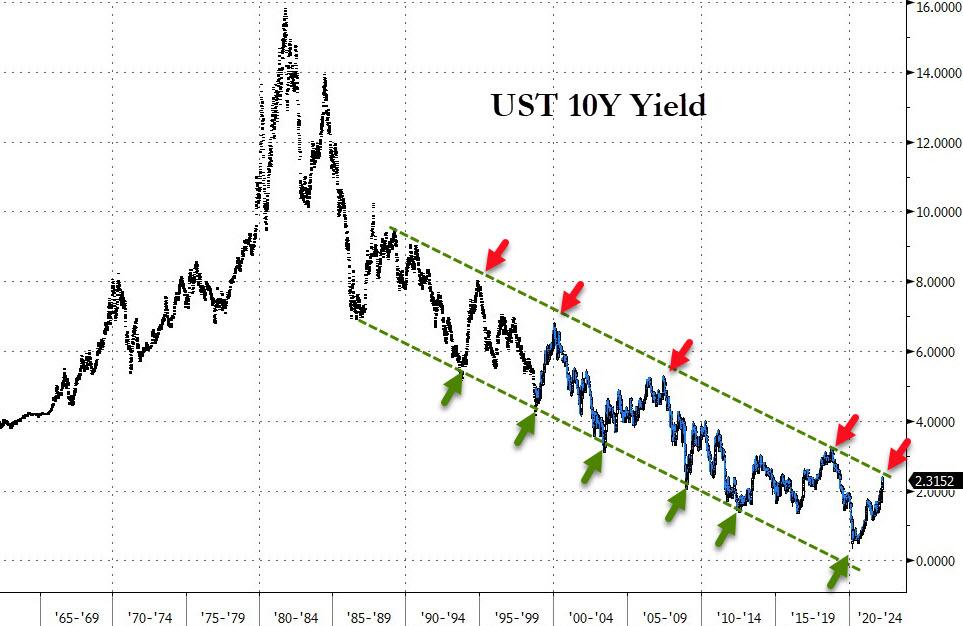
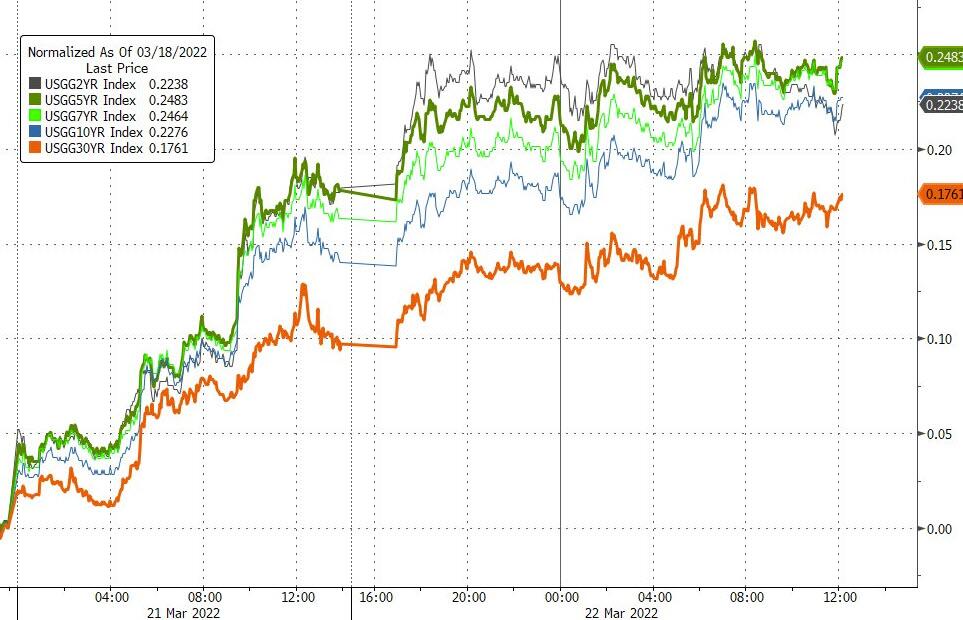
Bond yields spiked again with the 10-year adding 7 bps to close at 2.368%. Global bonds are still suffering the largest drawdown on record, as ZH pointed out, as yields slowly but surely pick up upward momentum.
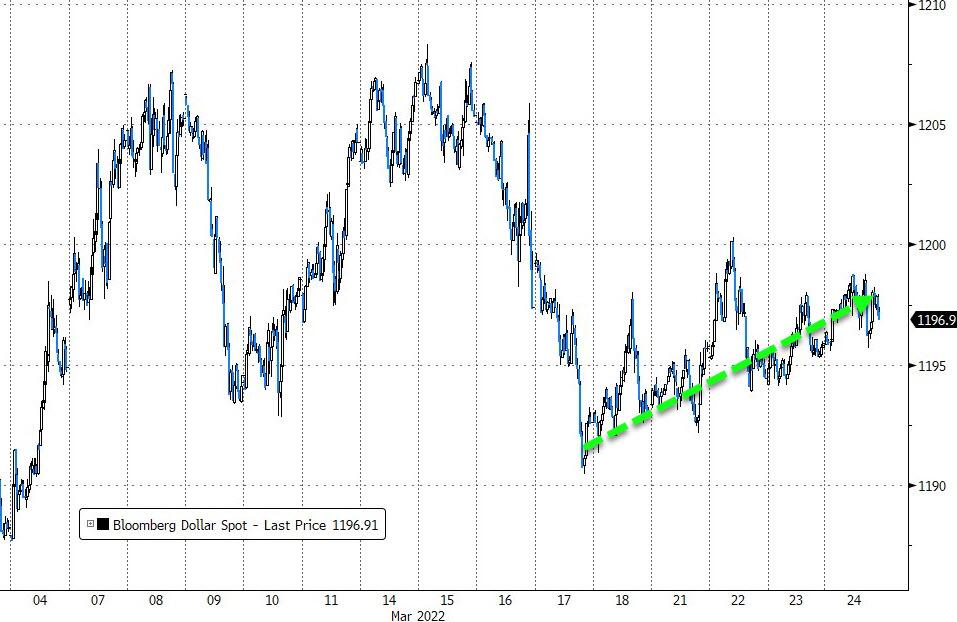
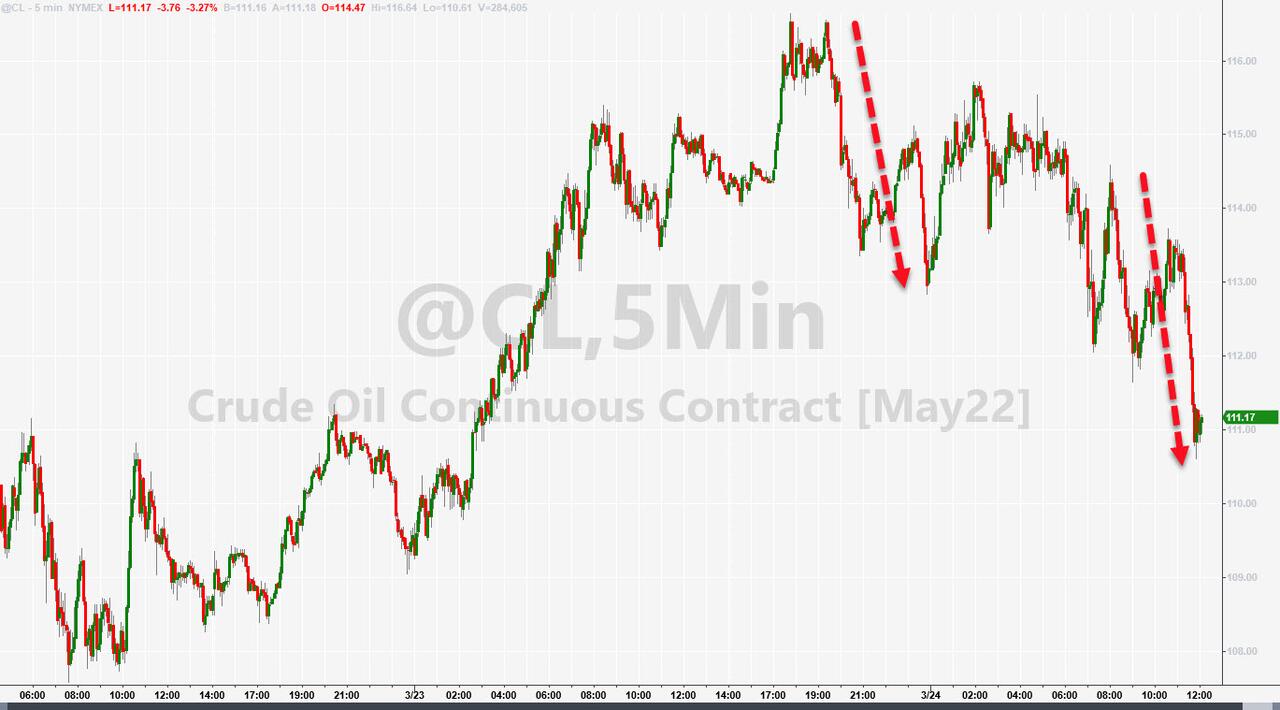
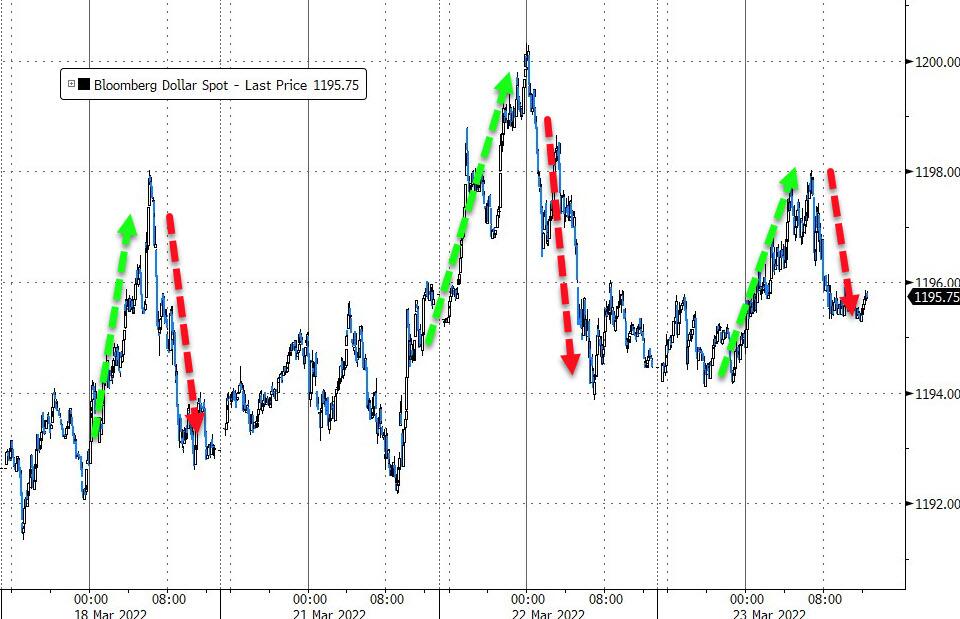
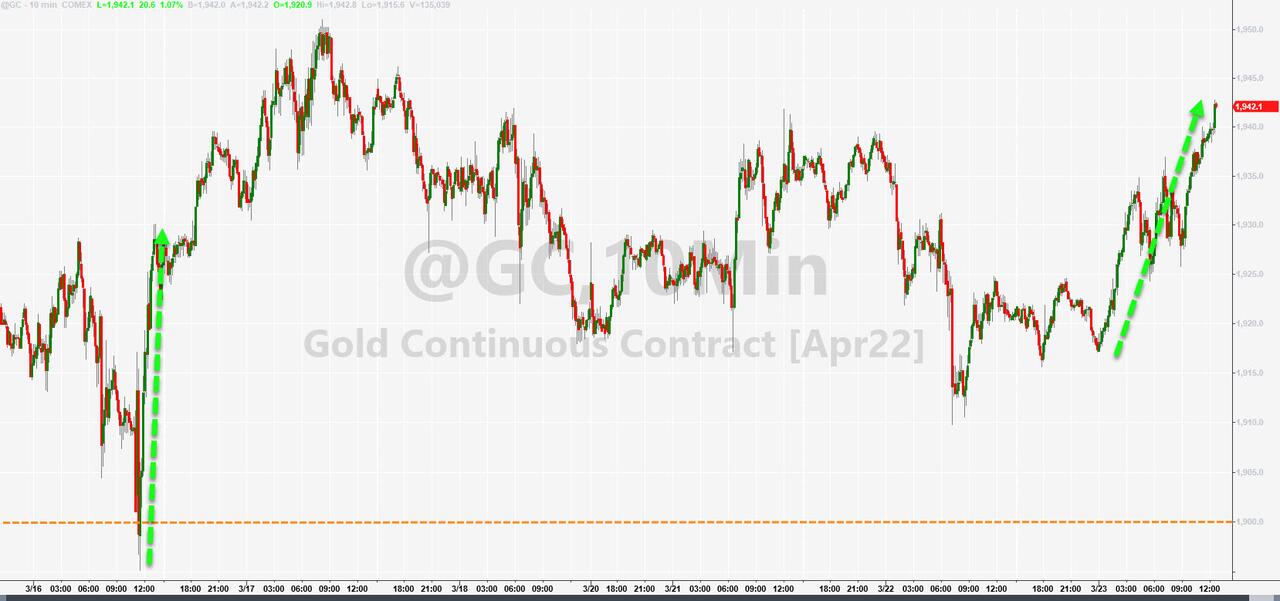
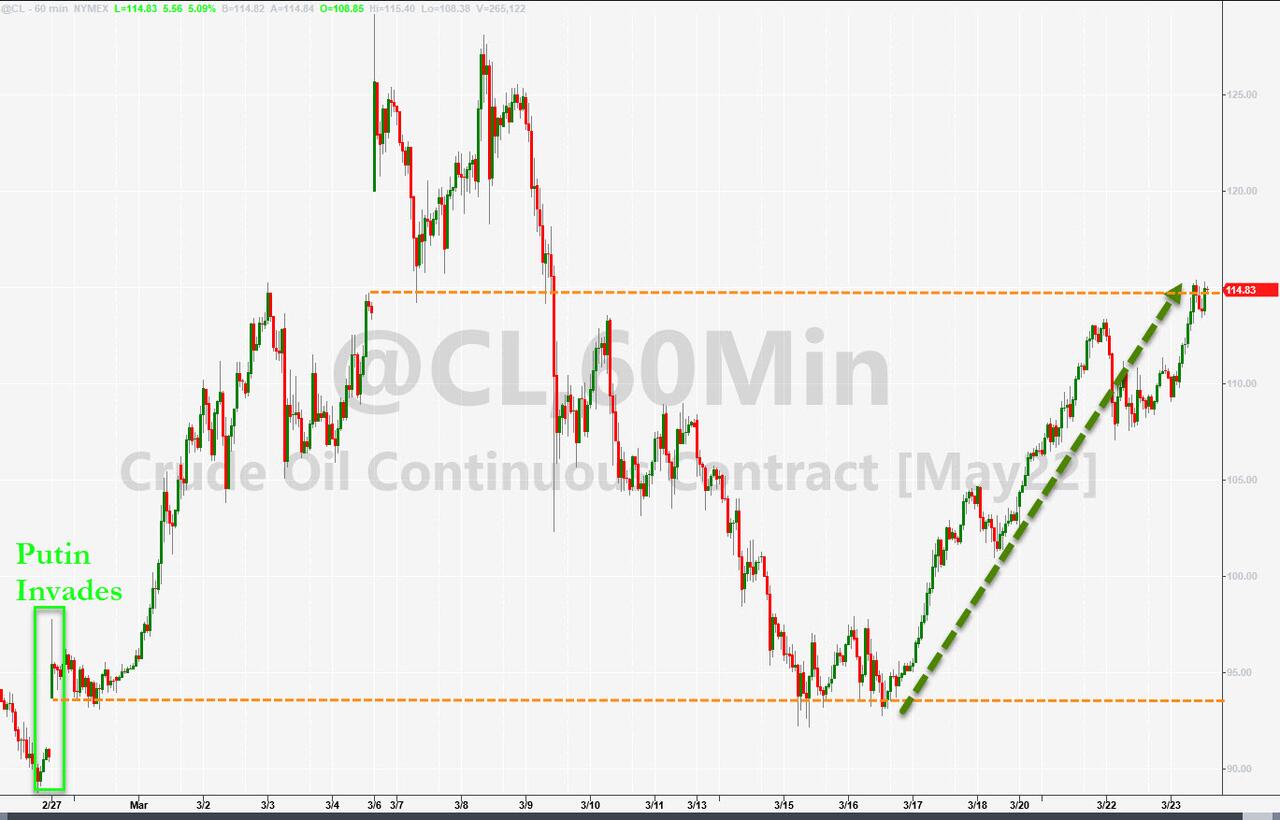
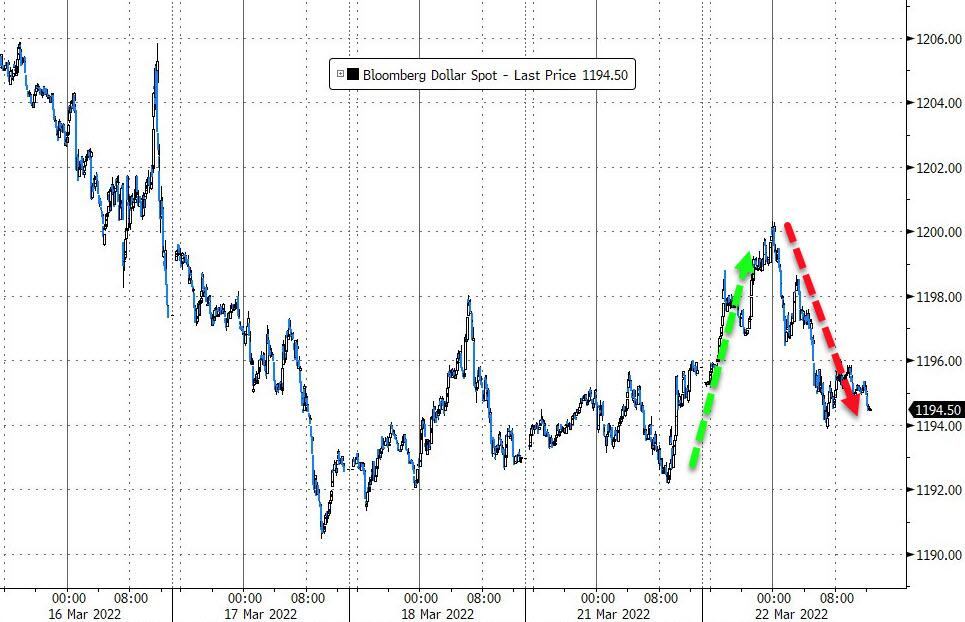
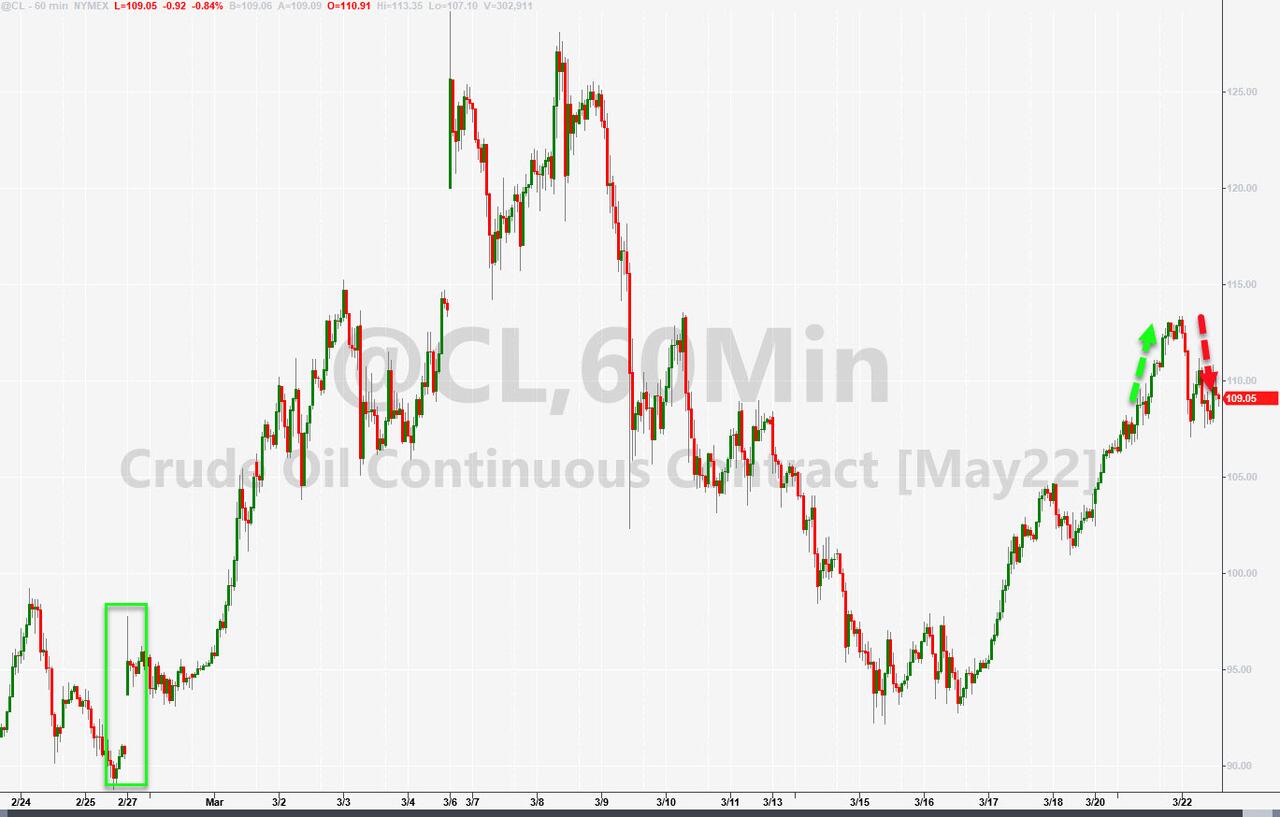
The US Dollar inched higher, Crude Oil got hammered back to the $110 marker, while Gold had a solid session by adding +1.30%.
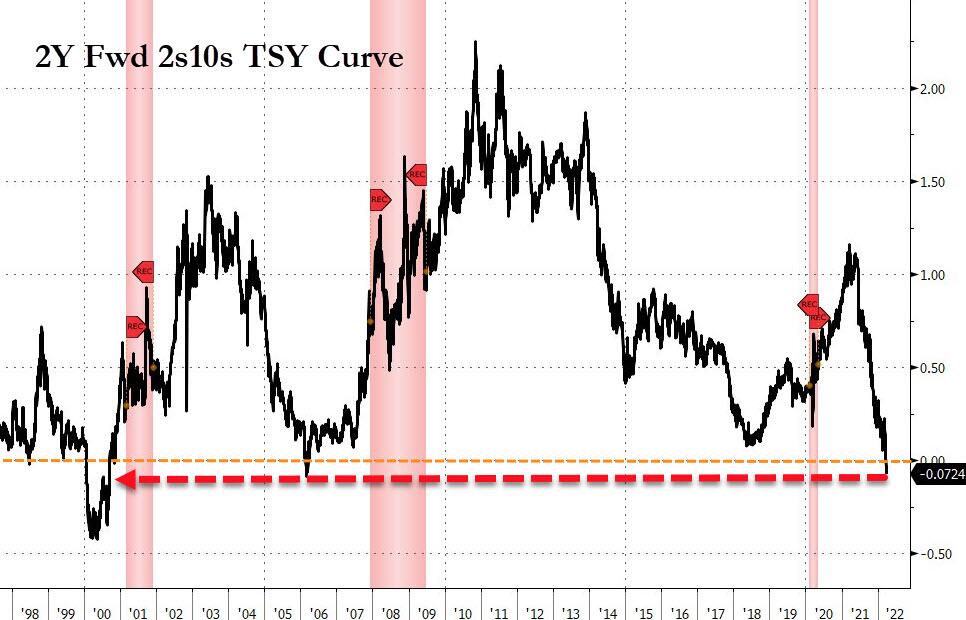
The 2/10 yield curve has now inverted meaning that 2-year bond yields are higher than 10-year ones. This has always been a precursor to a recession, as Bloomberg demonstrates in this chart.
Should that happen, Wall Street traders will be a happy bunch, because it means that lower rates hopefully will be on deck again.
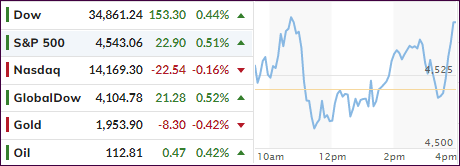
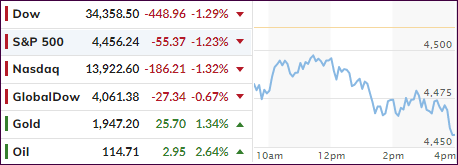
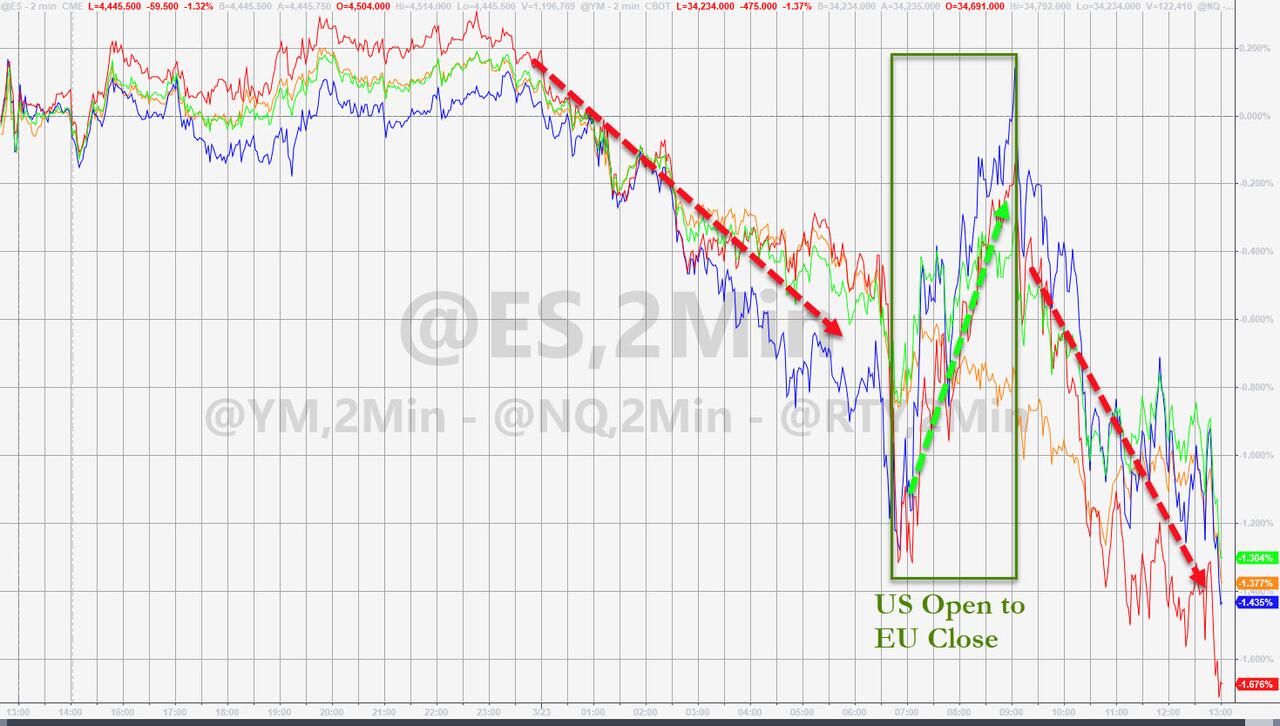
Yesterday’s rebound ran into a brick wall this morning with the major indexes getting stuck below their respective unchanged lines throughout the session. The usual afternoon ramp-a-thon was conspicuously absent leaving stocks no choice but to drop into a sinkhole.
For sure, the path of least resistance was down, with not only a short squeeze lacking, but also with dip buyers apparently having left the trading floor for the day. This sudden downdraft is exactly the reason why I have refrained from confirming a new “Buy” signal. We are in a stalemate market environment where the long-term direction can’t clearly be identified, and the odds of experiencing a whipsaw signal are greatly enhanced.
Yes, the markets are trying to find some footing in the face of spiking interest rates, ever-present inflation fears and an economic slowdown, which may eventually negatively affect earnings. Let’s not forget the war, supply shortages and global energy issues, no matter where you look.
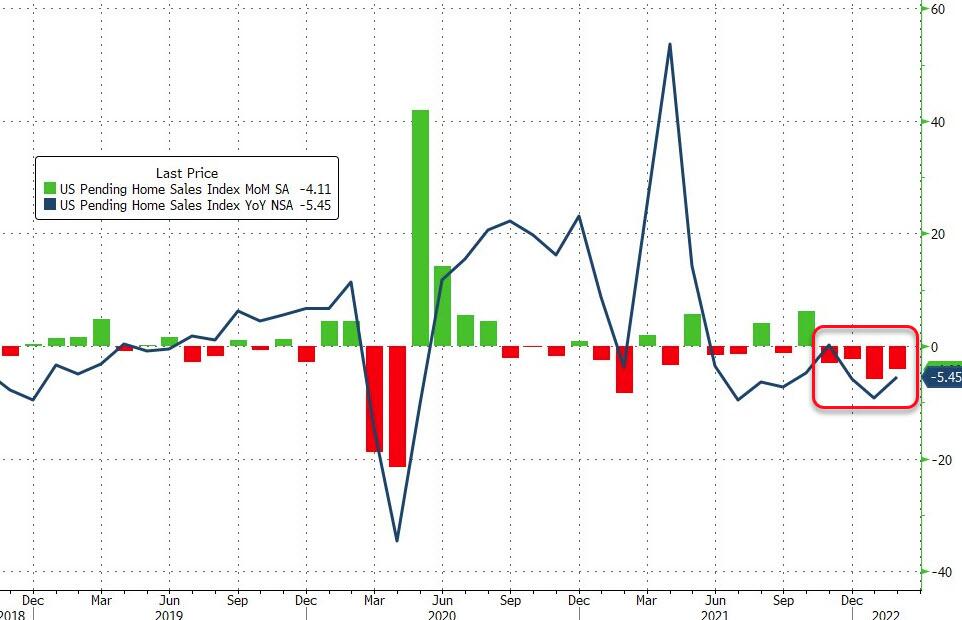
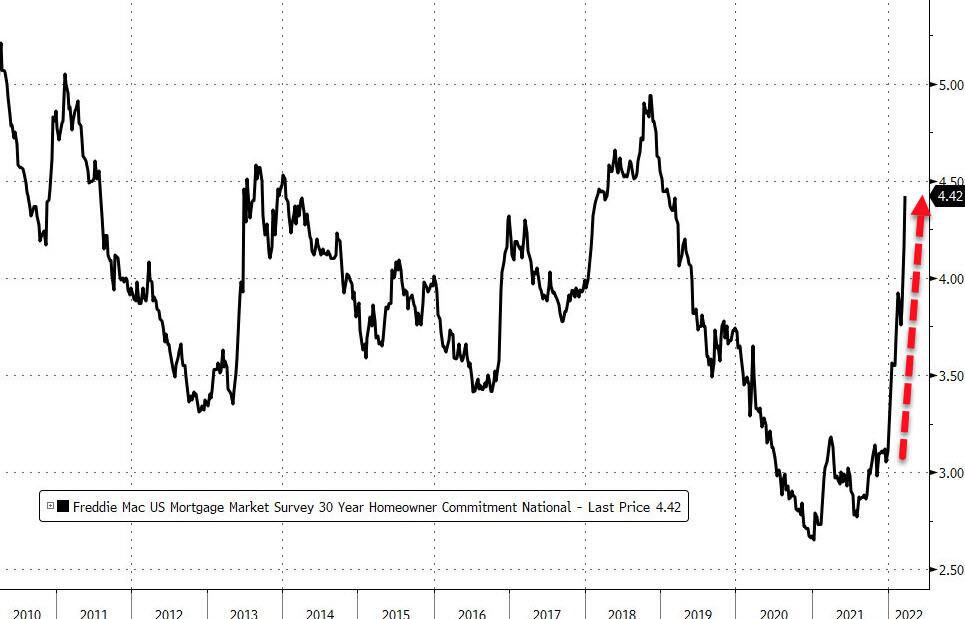
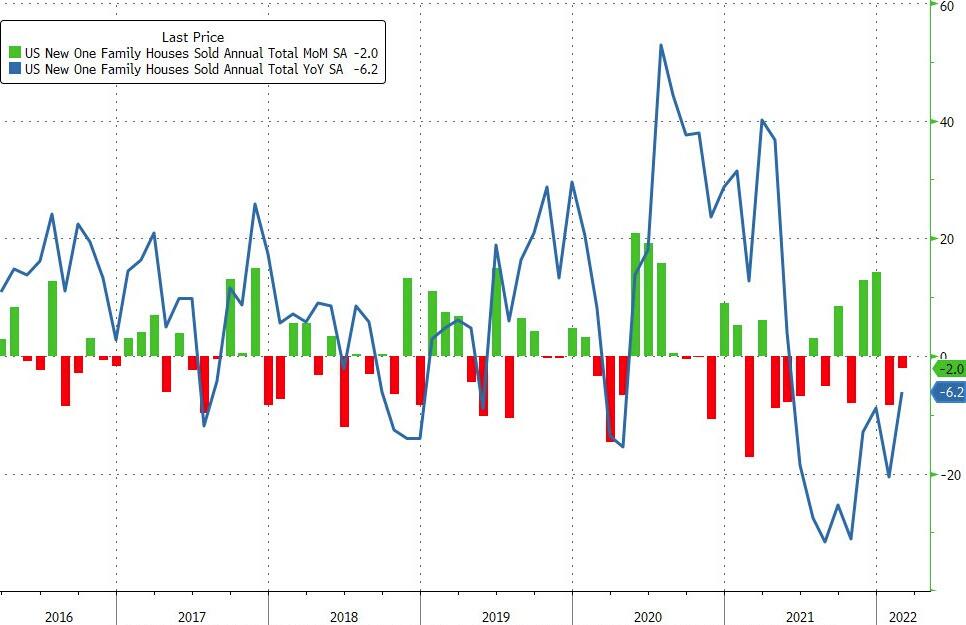
Not helping matters was news that New Home Sales unexpectedly tumbled in February (-2%), as ZH reported, with mortgage applications crashing. What’s even worse was the fact that January’s -4.5% drop was revised to a drastically worse -8.4% plunge. Ouch!
Bond yields dipped, after the recent spikes, with the 10-year settling at 2.29%, down 9 bps. The US Dollar round-tripped and ended moderately higher, while Gold, Energy (VDE +1.74%) and Crude Oil showed a lot of strength by closing solidly in the green.
In terms of Crude Oil and the Energy sector, problems, especially now in the Diesel market, are not over by a long shot, which ZH summed up best:
This is far from over – even if US equities seemed to be telling a different tale in recent days.
Traders and investors alike tried to digest Fed head Powell’s comments that interest rates may be hiked with twice the magnitude (50 bps) as had been assumed (25 bps) due to inflation “being much too high.”
Despite that hawkishness, the markets are considering Powell’s current and future planned increases as a policy error, with Wall Street clearly focusing on the long-term implications rather than the immediate ones.
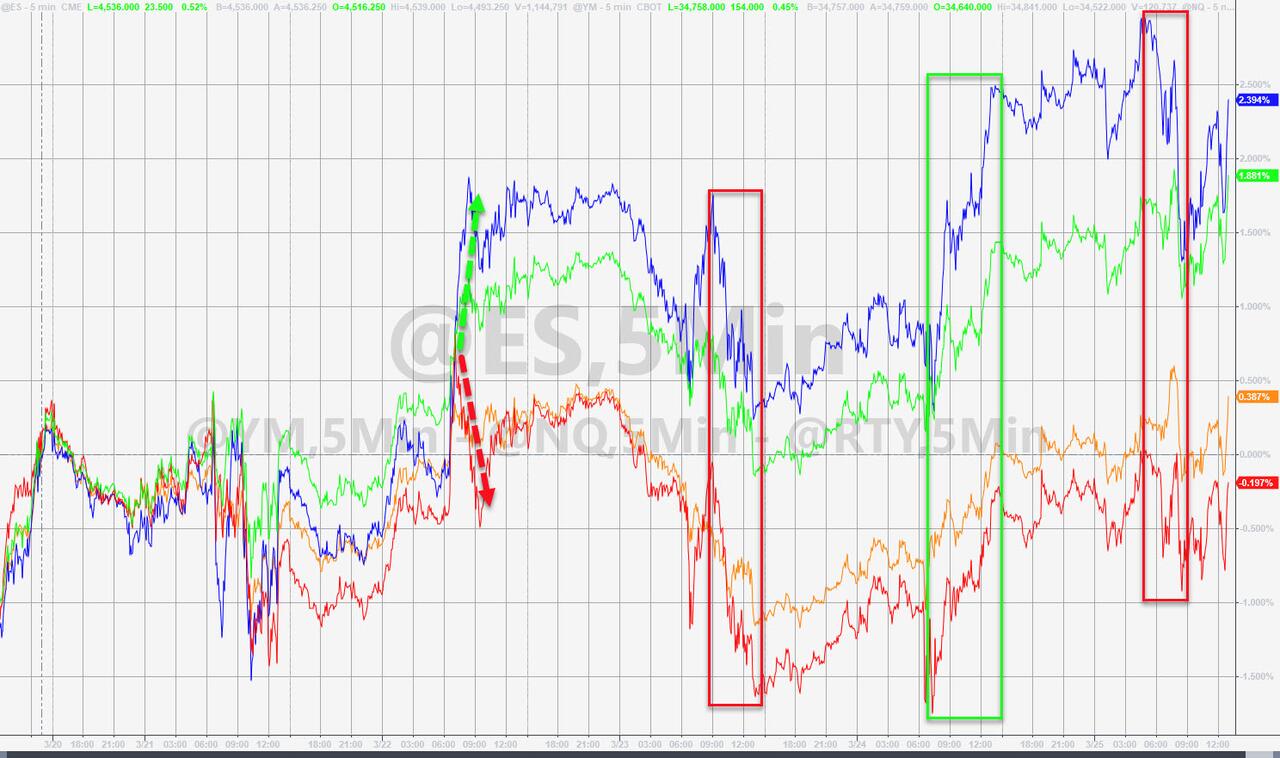
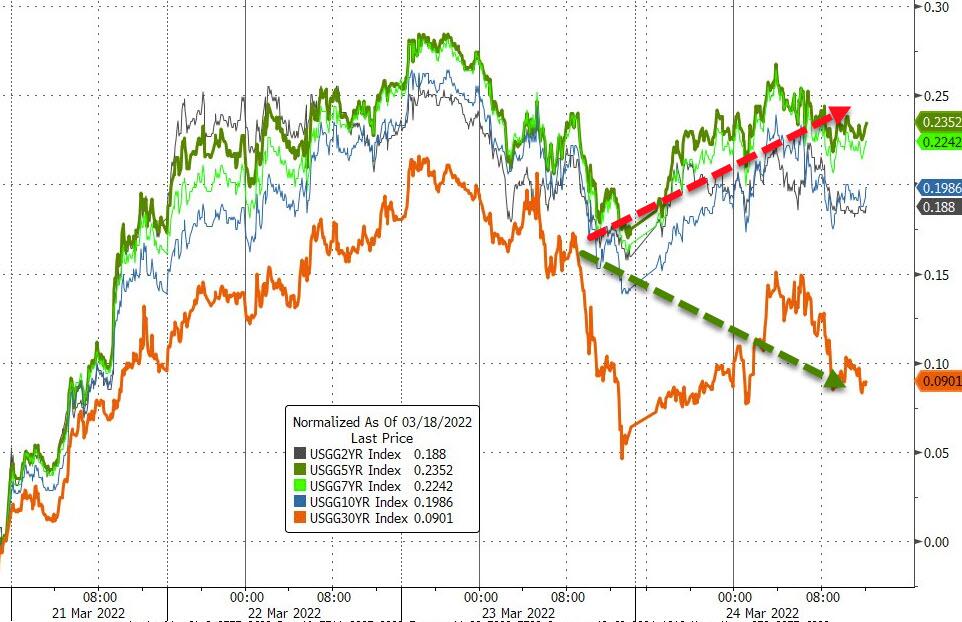
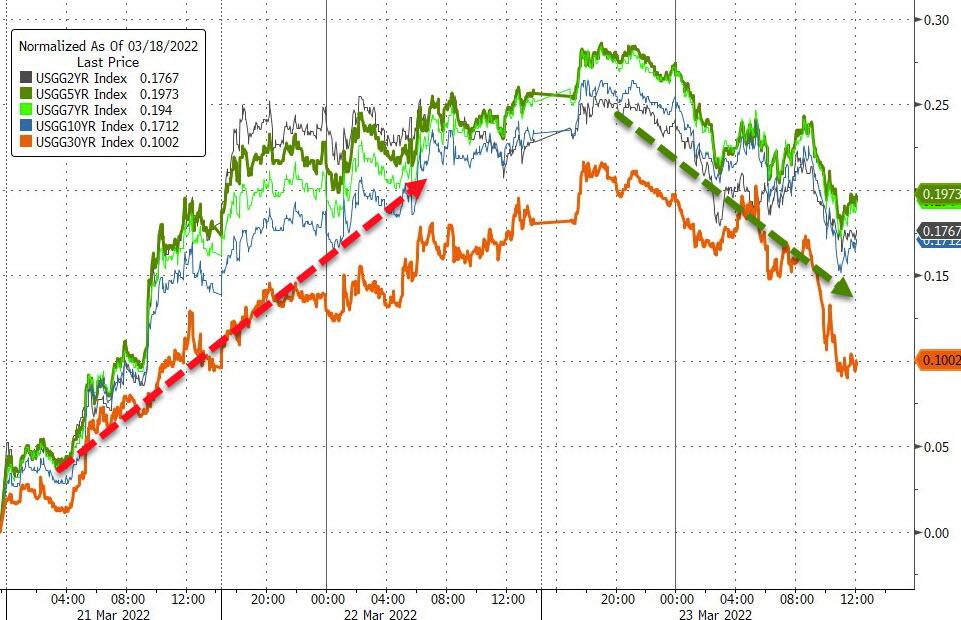
Even though, it’s simply odd and not sustainable that markets can rally on “easing” and rally on “tightening” news, this aberration will end sooner or later. However, this chart clearly shows the upside-down world we are in.
Traders are aware that rate hikes will continues throughout 2022, but the Fed will have to ease again during 2023/2024, with the foregone conclusion being that later this year a slowdown/recession will materialize causing a reversal of policy.
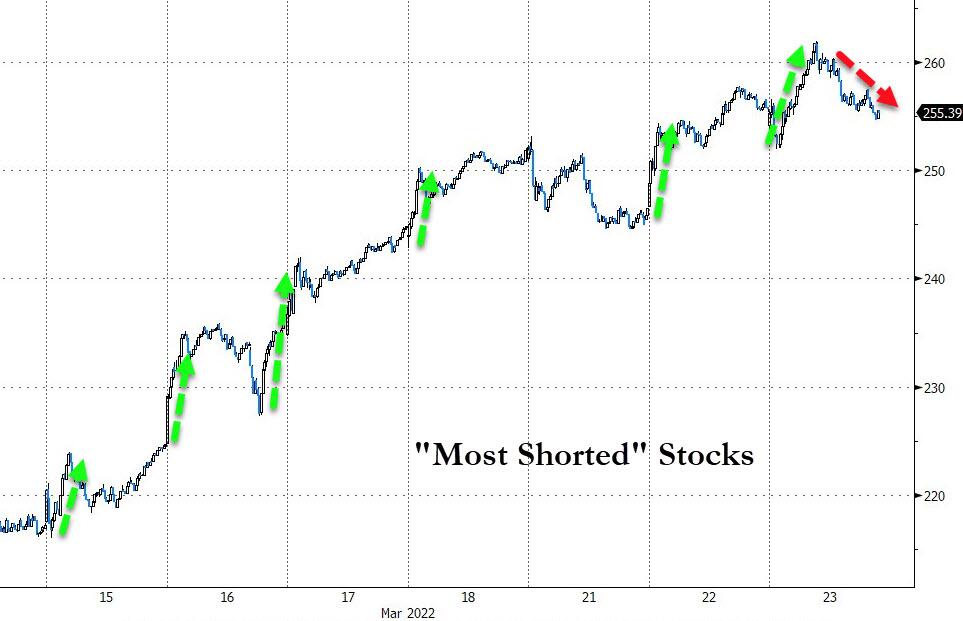
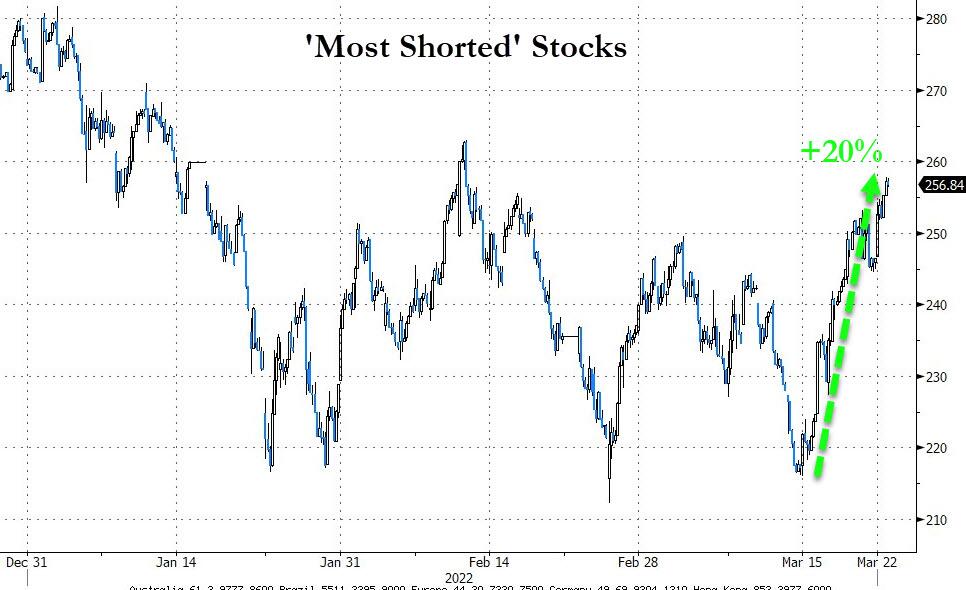
In other words, a future recession and rate-cut odds will happen in sync, which allowed the major indexes to keep the current rebound alive, with support coming from a continued short-squeeze, which started on March 15.
Bond yields ratcheted higher with the 10-year adding another 8 bps and closing at 2.38%, thereby exerting more pain on bond holders, as prices got crushed. The widely held TLT (20-year bond ETF) is down -12.04% for the year. So much for the perceived security of bonds.
The US Dollar slipped, as did Crude Oil, with Gold initially selling off but recovering into the close with modest loss of -0.40%.
In summary, the markets are hopeful that the much-feared recession scenario will materialize, if for no other reason than that the Fed will be forced to cut rates, which is the driver necessary to propel stocks to new all-time highs in the face of deteriorating economic conditions.