
ETF Tracker StatSheet
You can view the latest version here.
CLIMBING A WALL OF WORRY
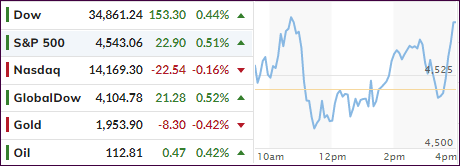
- Moving the markets
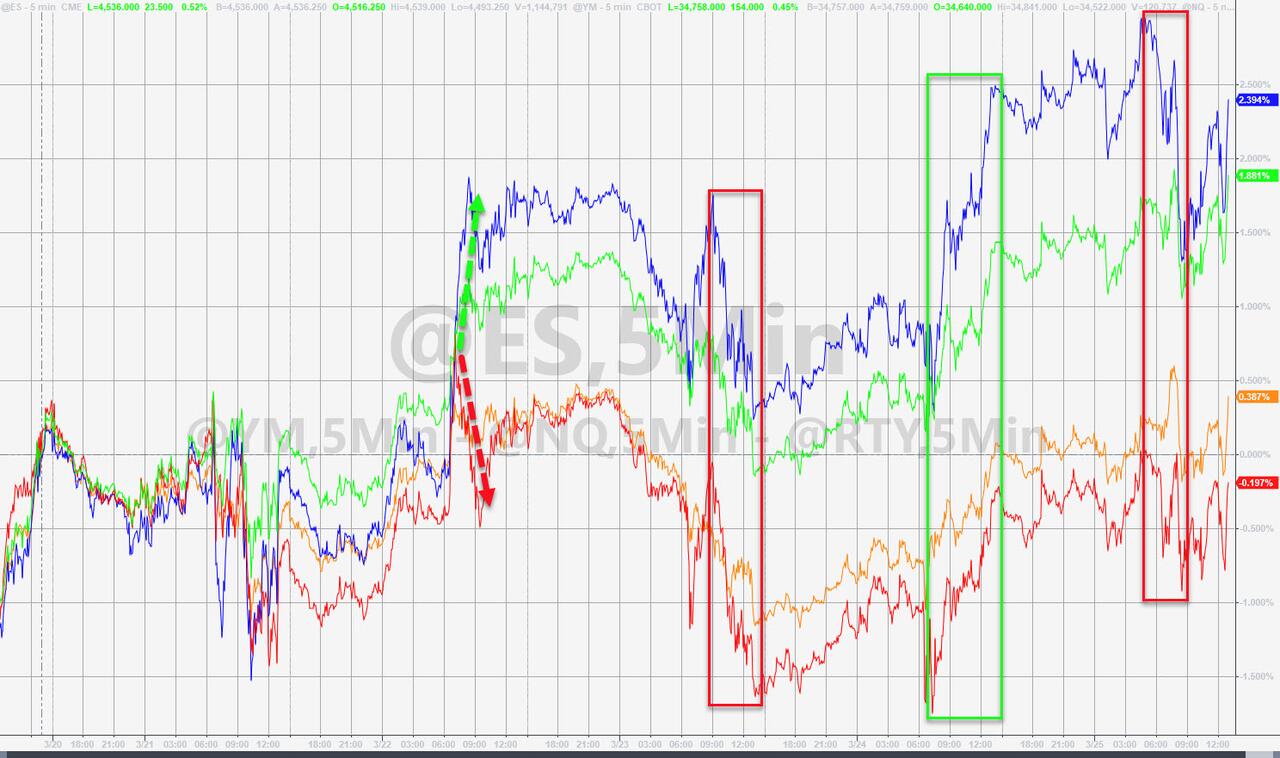
Given the news events this week, it has become clear that markets have simply disconnected from reality and therefore were able to climb a wall of worry. Here’s why:
- The war in Ukraine continues
- The Fed is set to hike rates more massively several times this year
- Inflation is accelerating (Expectations are at a 41-year high)
- Economic Stagflation is anticipated to strike later in 2022
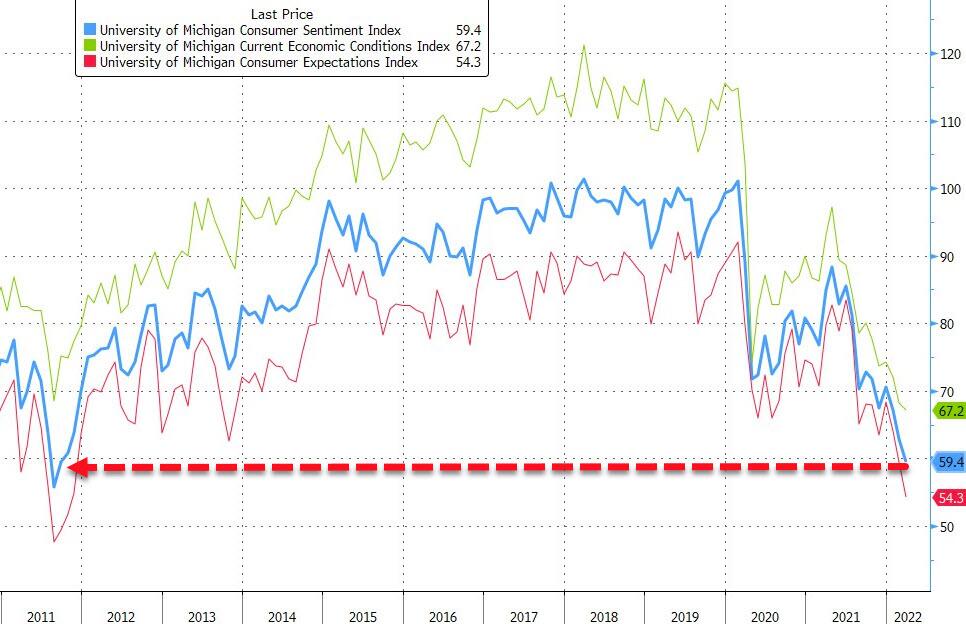
- Consumer Sentiment slumps
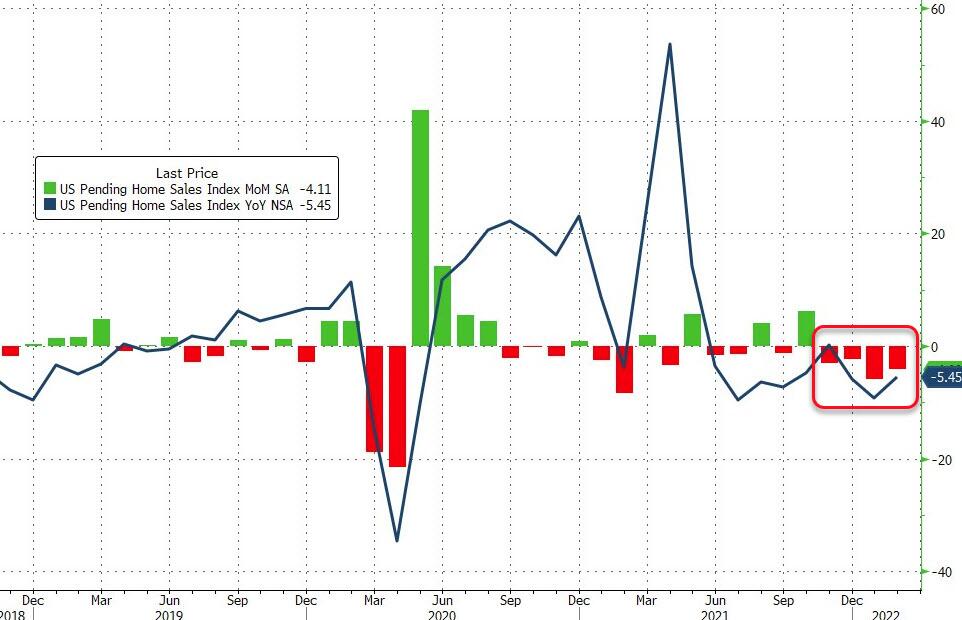
- Pending Home Sales plunge
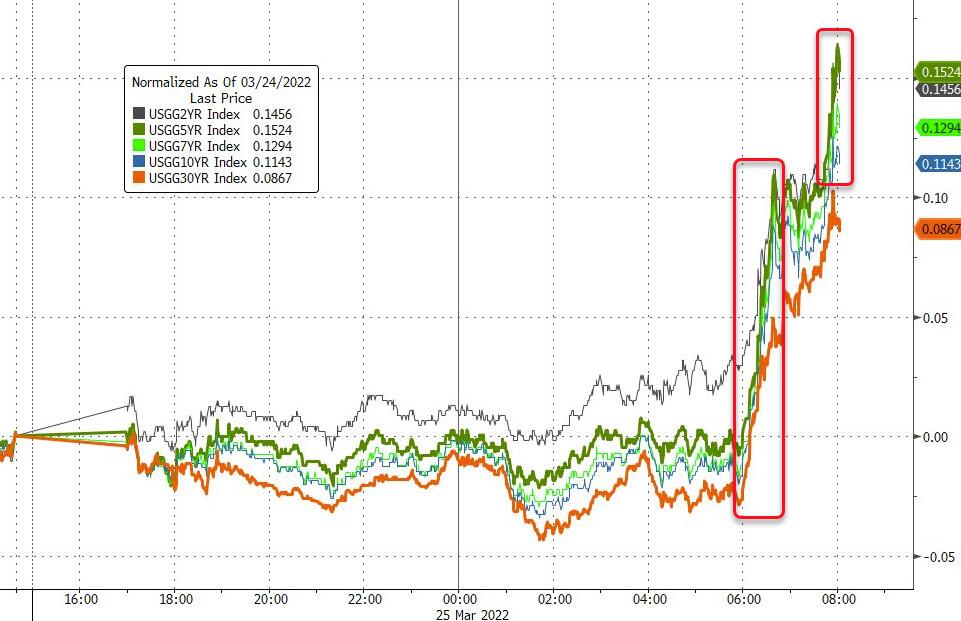
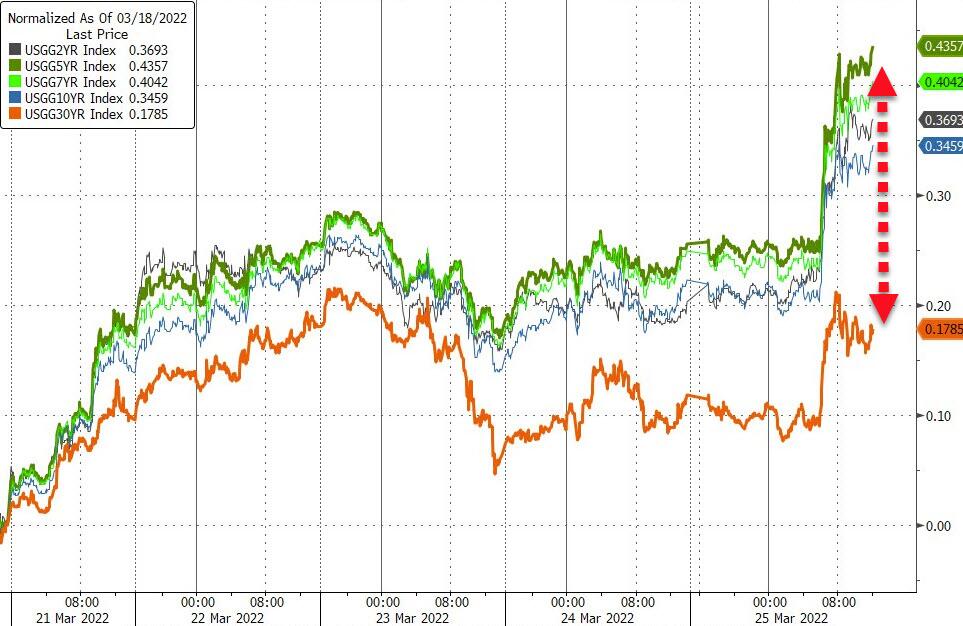
- Bond yields spike
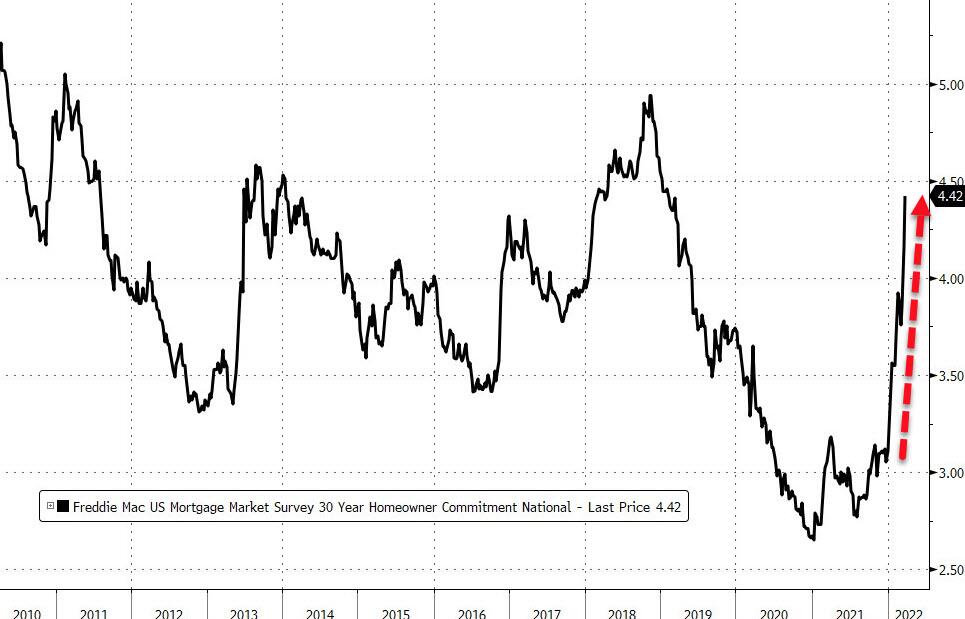
- A Housing Affordability crisis is imminent
And…stocks rally. Go figure…
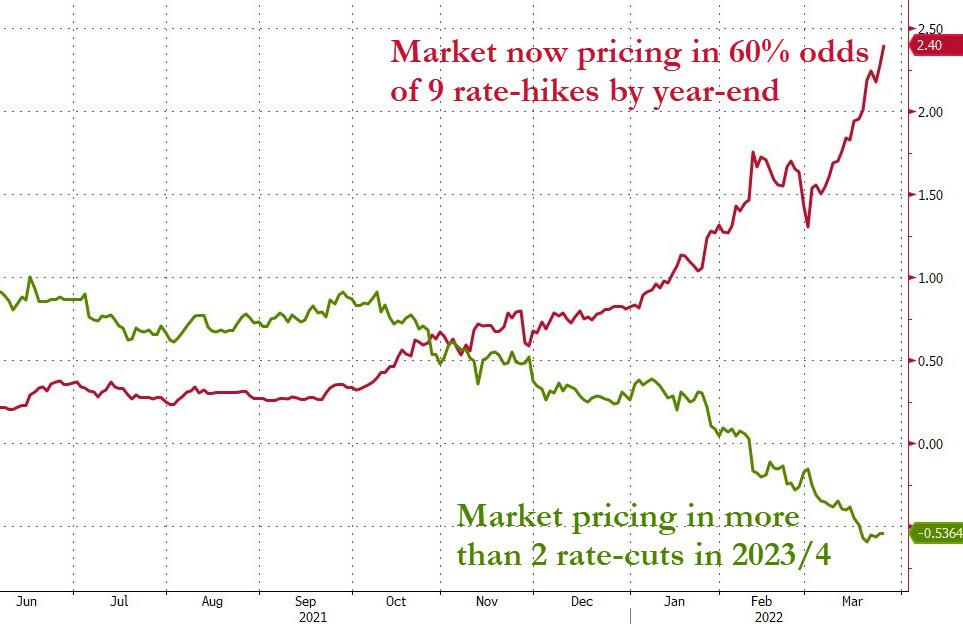
The market is now pricing in 60% odds of 9 rate-hikes by year end, as ZH explained, which then is followed by more than 2 rate-cut expectations in 2023/24, as a recession makes its presence felt.
The bloodbath in bonds continued today, with the 5-year yield up an amazing 44 bps, while the 10-year added over 11 bps to close at 2.485%. The widely held 20-year bond ETF TLT is now down almost -12% for the year. Ouch!
Given the host of uncertainties around the globe, it comes as no surprise that the Energy Sector outperformed, while healthcare was the laggard, as this chart shows. The US Dollar gained modestly for the week, while Gold reclaimed its $1,950 level.
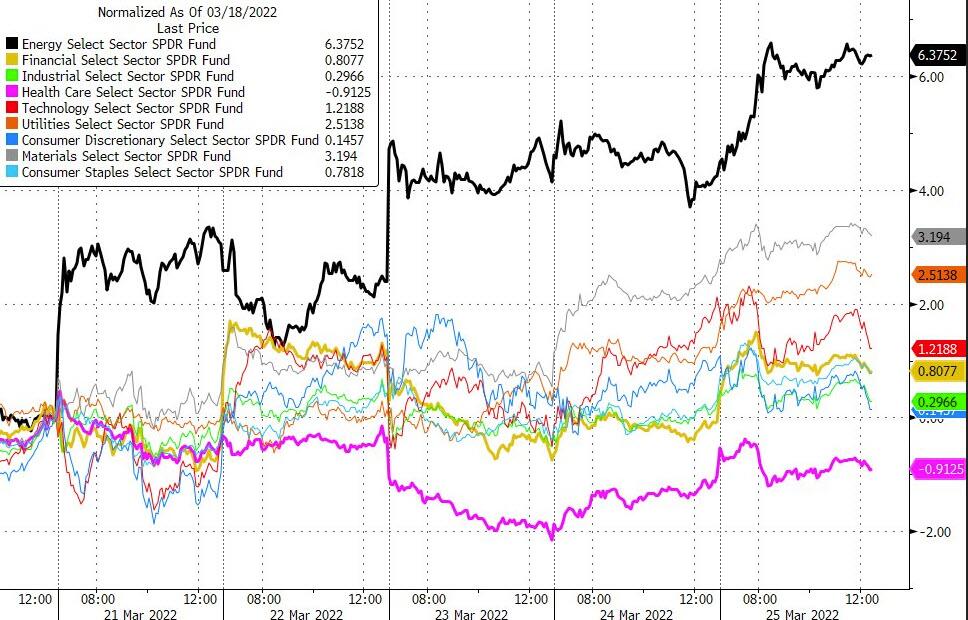
With only 4 trading days left till the end of the quarter, some rebalancing may push markets around next week, but ZH expects the “buy bonds/sell stocks” theme to be prevalent.
2. ETFs in the Spotlight
In case you missed the announcement and description of this section, you can read it here again.
It features some of the 10 broadly diversified domestic and sector ETFs from my HighVolume list as posted every Saturday. Furthermore, they are screened for the lowest MaxDD% number meaning they have been showing better resistance to temporary sell offs than all others over the past year.
The below table simply demonstrates the magnitude with which these ETFs are fluctuating above or below their respective individual trend lines (%+/-M/A). A break below, represented by a negative number, shows weakness, while a break above, represented by a positive percentage, shows strength.
For hundreds of ETF choices, be sure to reference Thursday’s StatSheet.
For this just closed-out domestic “Buy” cycle, here’s how some of our candidates have fared:
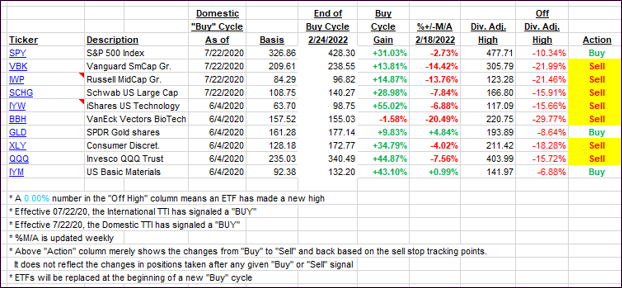
Click image to enlarge.
Again, the %+/-M/A column above shows the position of the various ETFs in relation to their respective long-term trend lines, while the trailing sell stops are being tracked in the “Off High” column. The “Action” column will signal a “Sell” once the -12% point has been taken out in the “Off High” column, which has replaced the prior -8% to -10% limits.
3. Trend Tracking Indexes (TTIs)
Our TTIs participated in another wild ride, during which an early rally bit the dust and pulled the major indexes into the red. However, an afternoon rebound saved the day.
We are now getting very close to discard the “Sell” signals and, with further upward momentum, we should reach that point next week.
This is how we closed 03/25/2022:
Domestic TTI: +2.19% above its M/A (prior close +1.23%)—Sell signal effective 02/24/2022.
International TTI: +1.04% above its M/A (prior close +0.52%)—Sell signal effective 03/08/2022.
Disclosure: I am obliged to inform you that I, as well as my advisory clients, own some of the ETFs listed in the above table. Furthermore, they do not represent a specific investment recommendation for you, they merely show which ETFs from the universe I track are falling within the specified guidelines.
All linked charts above are courtesy of Bloomberg via ZeroHedge.
———————————————————-
WOULD YOU LIKE TO HAVE YOUR INVESTMENTS PROFESSIONALLY MANAGED?
Do you have the time to follow our investment plans yourself? If you are a busy professional who would like to have his portfolio managed using our methodology, please contact me directly or get more details.
Contact Ulli