
- Moving the markets
Traders and investors alike tried to digest Fed head Powell’s comments that interest rates may be hiked with twice the magnitude (50 bps) as had been assumed (25 bps) due to inflation “being much too high.”
Despite that hawkishness, the markets are considering Powell’s current and future planned increases as a policy error, with Wall Street clearly focusing on the long-term implications rather than the immediate ones.
Even though, it’s simply odd and not sustainable that markets can rally on “easing” and rally on “tightening” news, this aberration will end sooner or later. However, this chart clearly shows the upside-down world we are in.
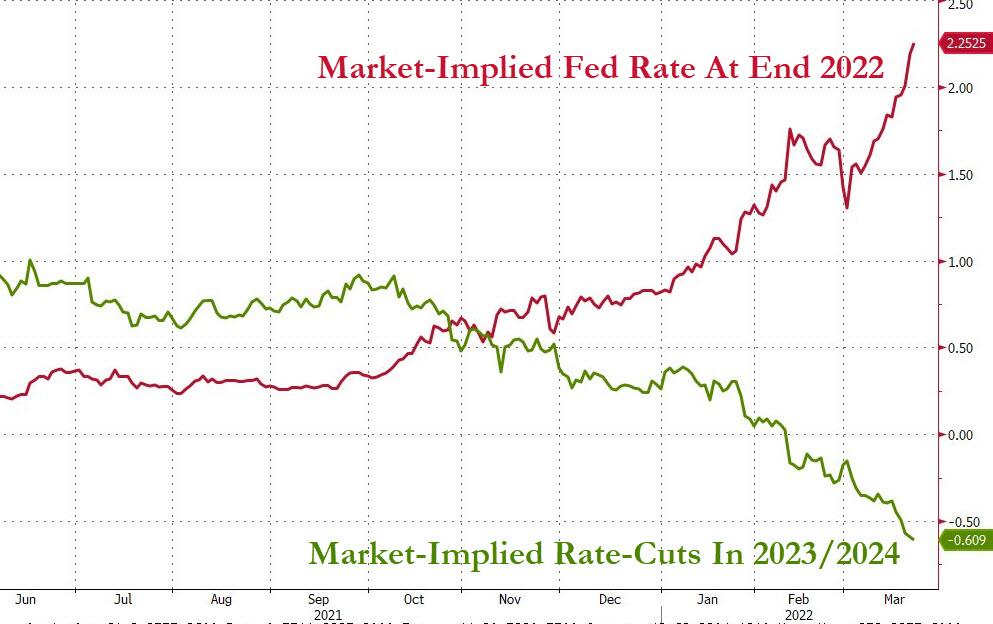
Traders are aware that rate hikes will continues throughout 2022, but the Fed will have to ease again during 2023/2024, with the foregone conclusion being that later this year a slowdown/recession will materialize causing a reversal of policy.
In other words, a future recession and rate-cut odds will happen in sync, which allowed the major indexes to keep the current rebound alive, with support coming from a continued short-squeeze, which started on March 15.
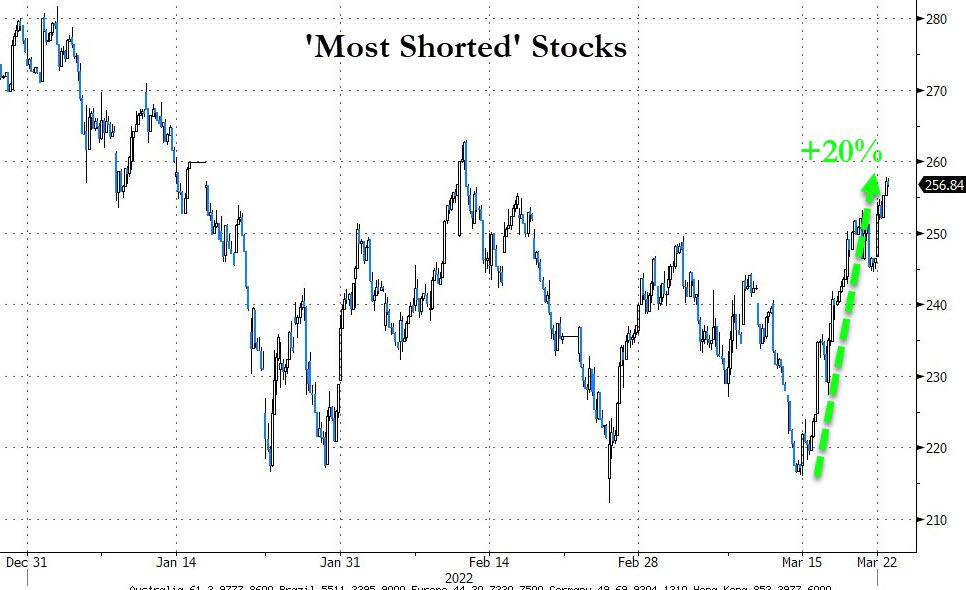
Bond yields ratcheted higher with the 10-year adding another 8 bps and closing at 2.38%, thereby exerting more pain on bond holders, as prices got crushed. The widely held TLT (20-year bond ETF) is down -12.04% for the year. So much for the perceived security of bonds.
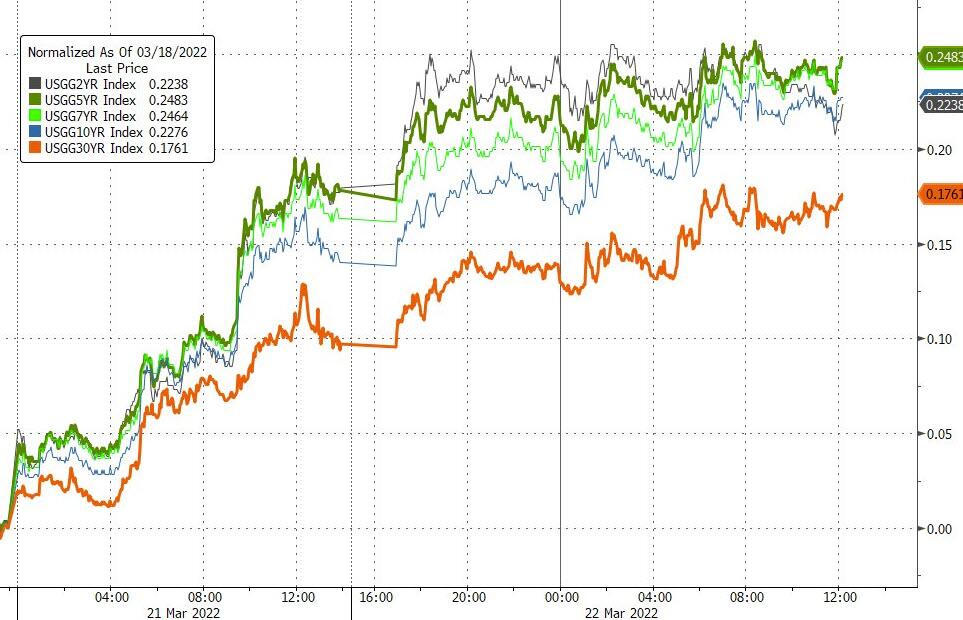
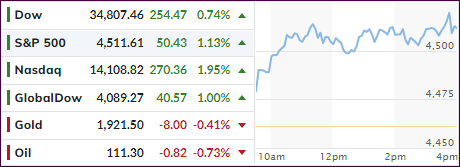
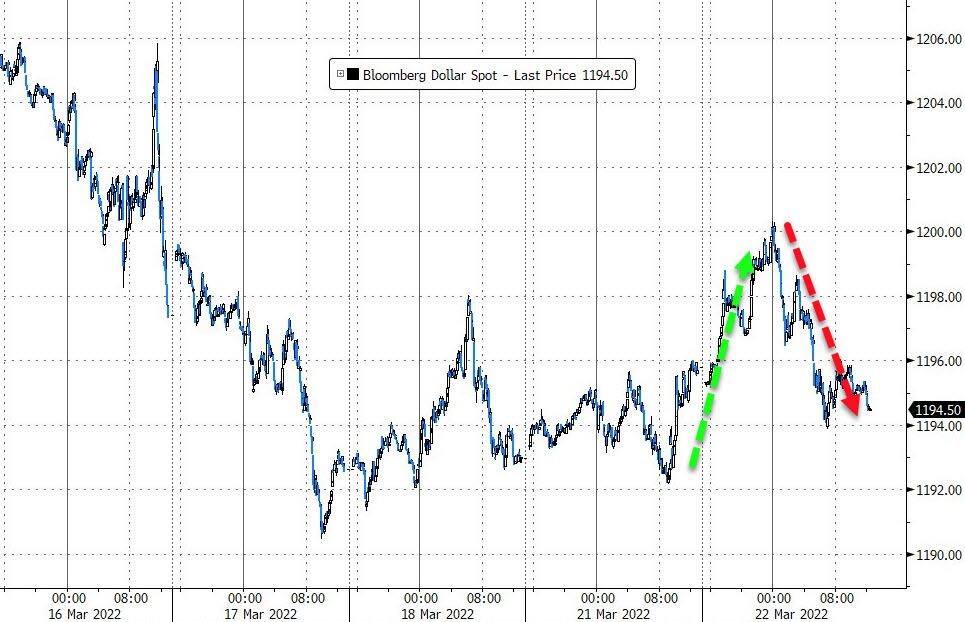
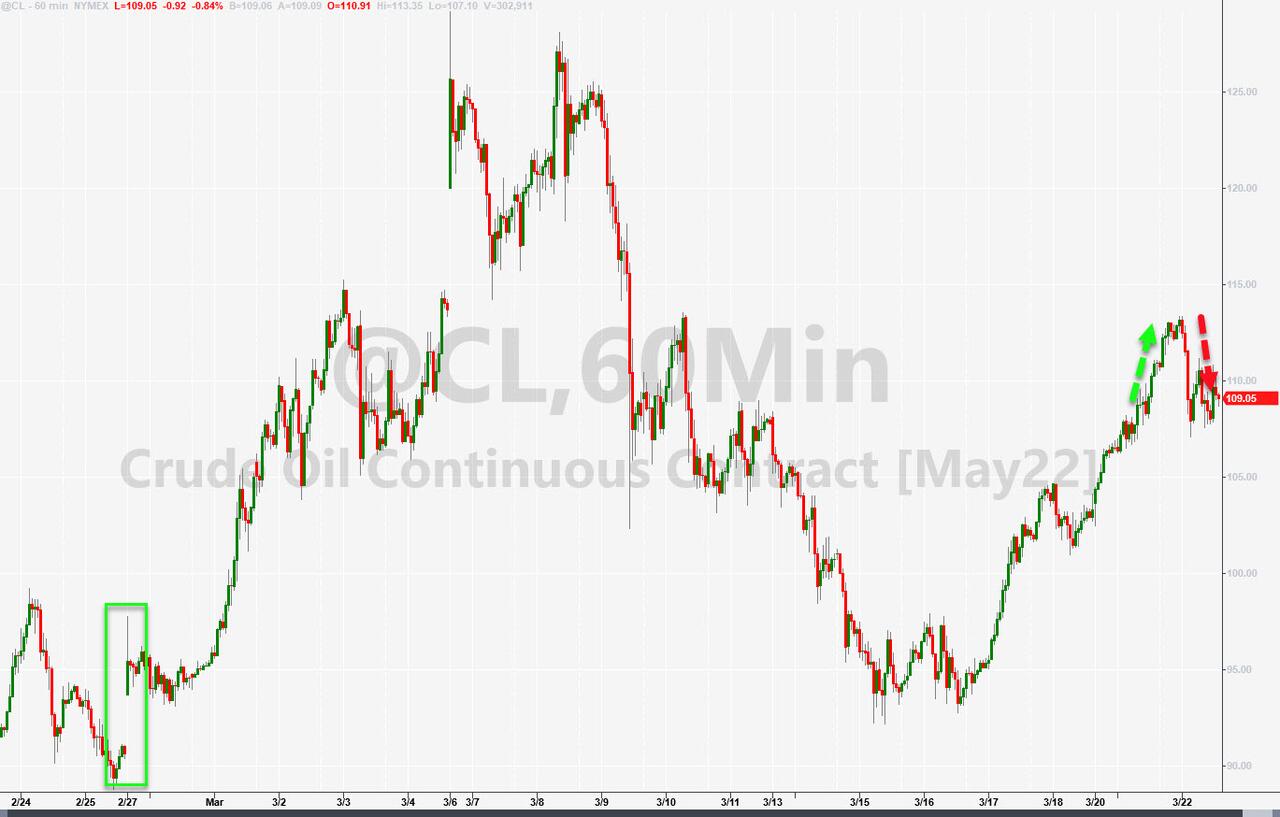
The US Dollar slipped, as did Crude Oil, with Gold initially selling off but recovering into the close with modest loss of -0.40%.
In summary, the markets are hopeful that the much-feared recession scenario will materialize, if for no other reason than that the Fed will be forced to cut rates, which is the driver necessary to propel stocks to new all-time highs in the face of deteriorating economic conditions.
2. ETFs in the Spotlight
In case you missed the announcement and description of this section, you can read it here again.
It features some of the 10 broadly diversified domestic and sector ETFs from my HighVolume list as posted every Saturday. Furthermore, they are screened for the lowest MaxDD% number meaning they have been showing better resistance to temporary sell offs than all others over the past year.
The below table simply demonstrates the magnitude with which these ETFs are fluctuating above or below their respective individual trend lines (%+/-M/A). A break below, represented by a negative number, shows weakness, while a break above, represented by a positive percentage, shows strength.
For hundreds of ETF choices, be sure to reference Thursday’s StatSheet.
For this just closed-out domestic “Buy” cycle, here’s how some of our candidates have fared:
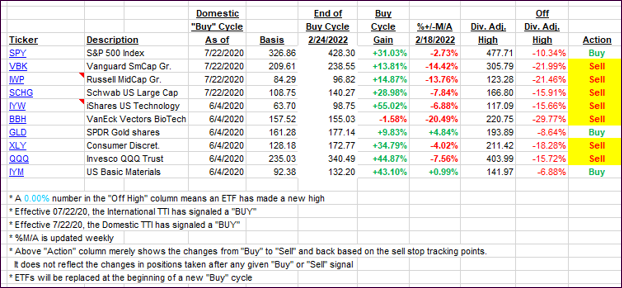
Click image to enlarge.
Again, the %+/-M/A column above shows the position of the various ETFs in relation to their respective long-term trend lines, while the trailing sell stops are being tracked in the “Off High” column. The “Action” column will signal a “Sell” once the -12% point has been taken out in the “Off High” column, which has replaced the prior -8% to -10% limits.
3. Trend Tracking Indexes (TTIs)
Our TTIs edged higher with the international one now having pierced its trend line to the upside for the first time. Here too, I will wait for more confirmation before issuing a new Buy signal.
As posted, I started nibbling in the Domestic arena by adding a couple of positions. However, we are still too close to a potential trend line reversal, so I will hold off with issuing an official “Buy” signal.
If you follow along on your own, you can add positions based on your risk tolerance, but never do so without first establishing your exit point.
This is how we closed 03/22/2022:
Domestic TTI: +1.51% above its M/A (prior close +0.66%)—Sell signal effective 02/24/2022.
International TTI: +0.69% above its M/A (prior close -0.44%)—Sell signal effective 03/08/2022.
Disclosure: I am obliged to inform you that I, as well as my advisory clients, own some of the ETFs listed in the above table. Furthermore, they do not represent a specific investment recommendation for you, they merely show which ETFs from the universe I track are falling within the specified guidelines.
All linked charts above are courtesy of Bloomberg via ZeroHedge.
Contact Ulli