
- Moving the markets
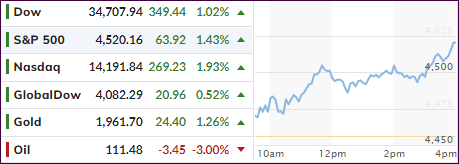
After yesterday’s drubbing, short-term market direction reversed again with the major indexes recovering just about all of Wednesday’s losses.
A drop in jobless claims to the lowest in decades provided the backdrop and gave confidence that the economic recovery remains on track, despite much evidence to the contrary.
Hope that a ceasefire in Ukraine could be forthcoming may have been just overly optimistic thinking, but it helped to support the bullish mood, nonetheless.
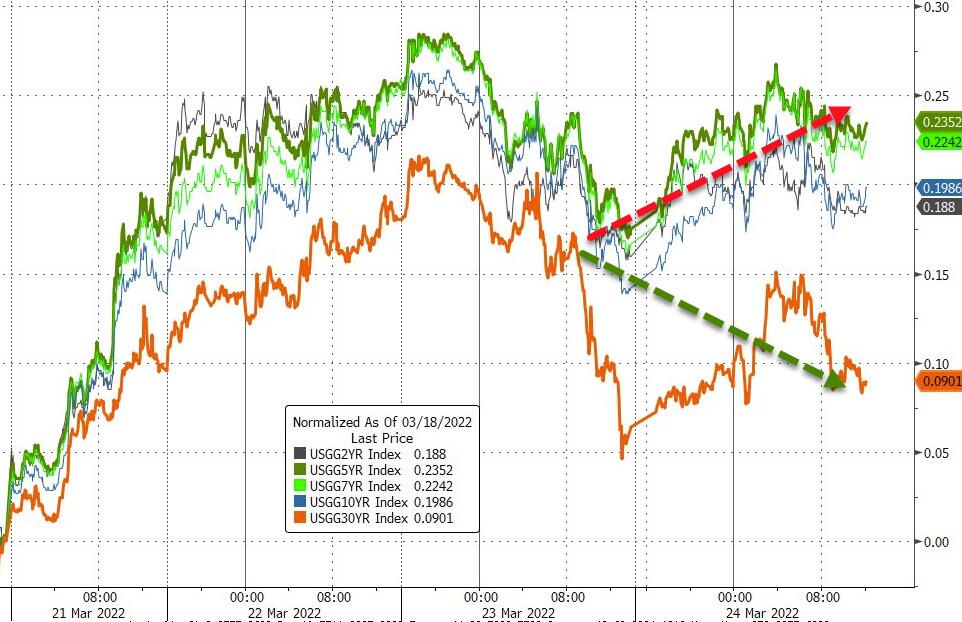
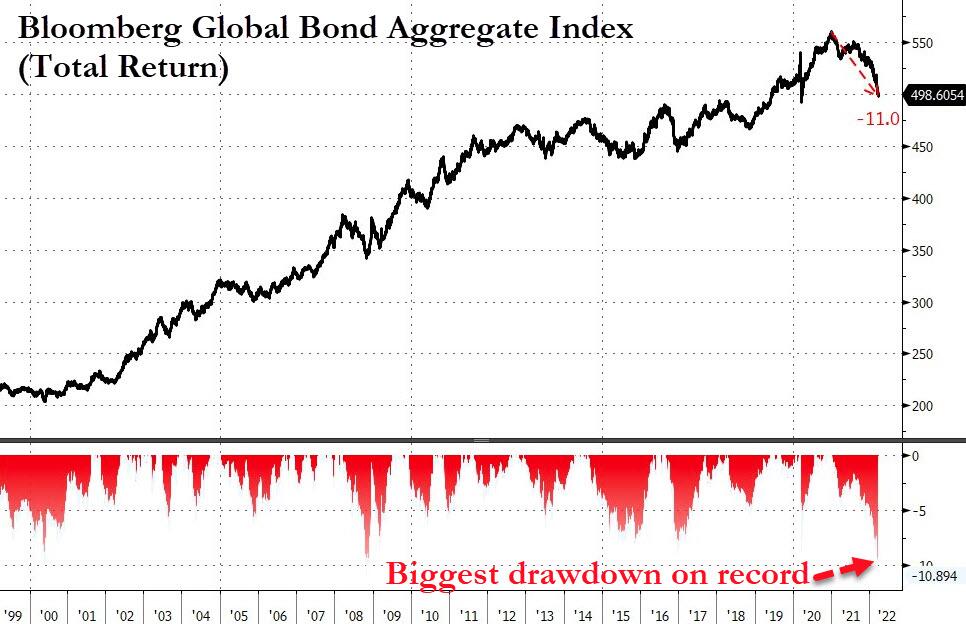
Bond yields spiked again with the 10-year adding 7 bps to close at 2.368%. Global bonds are still suffering the largest drawdown on record, as ZH pointed out, as yields slowly but surely pick up upward momentum.
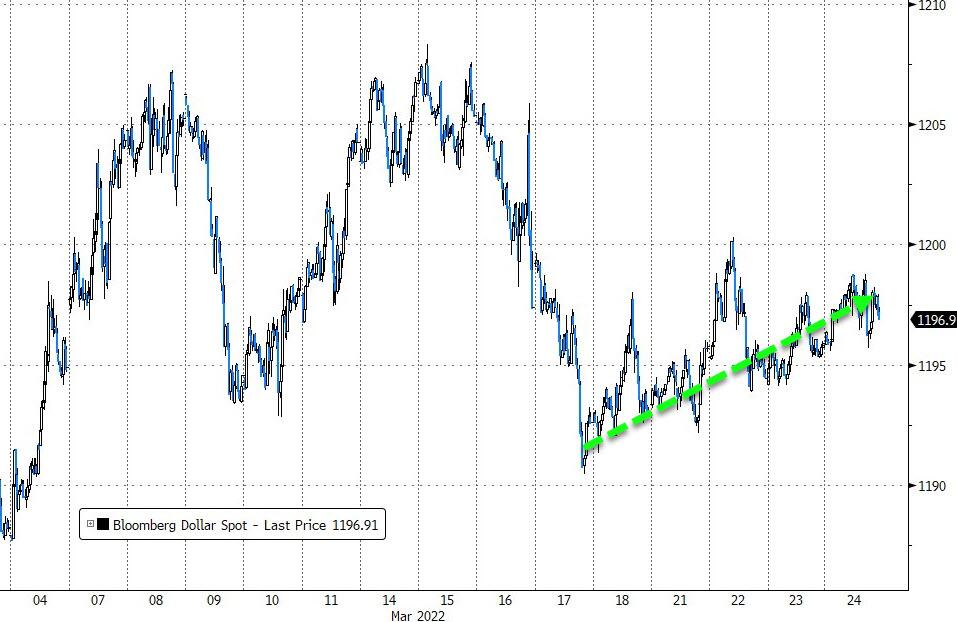
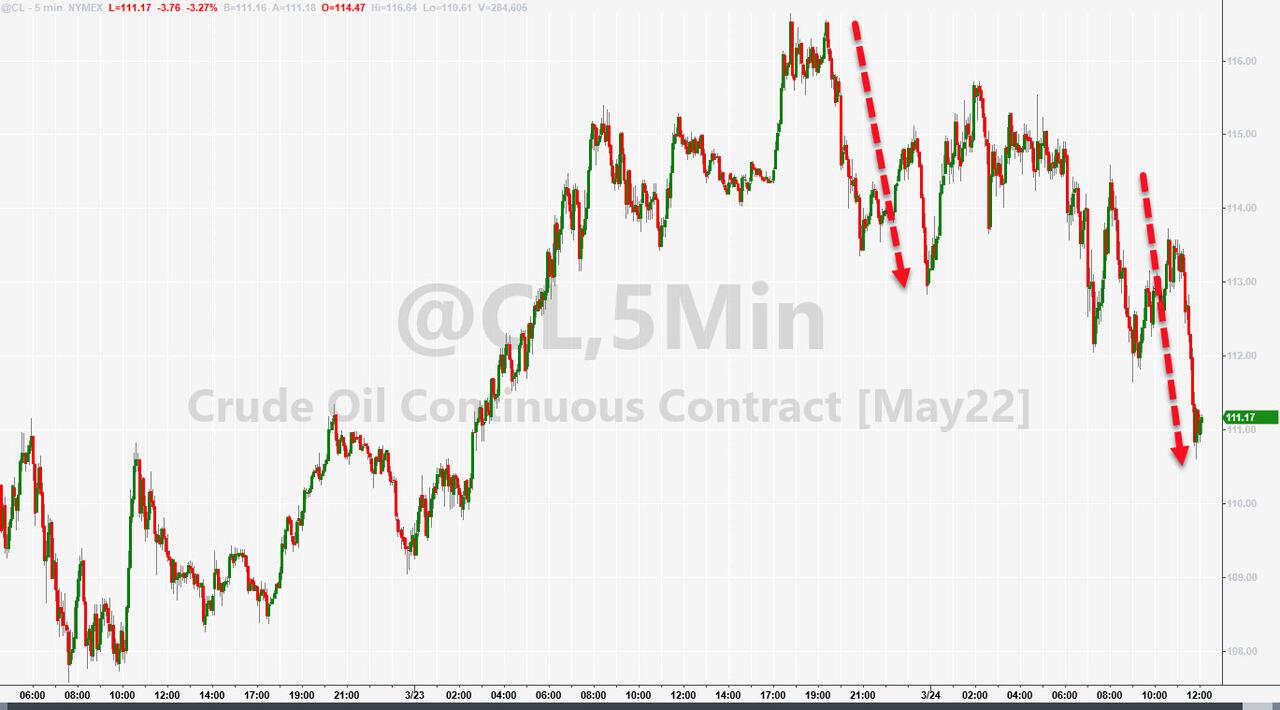
The US Dollar inched higher, Crude Oil got hammered back to the $110 marker, while Gold had a solid session by adding +1.30%.
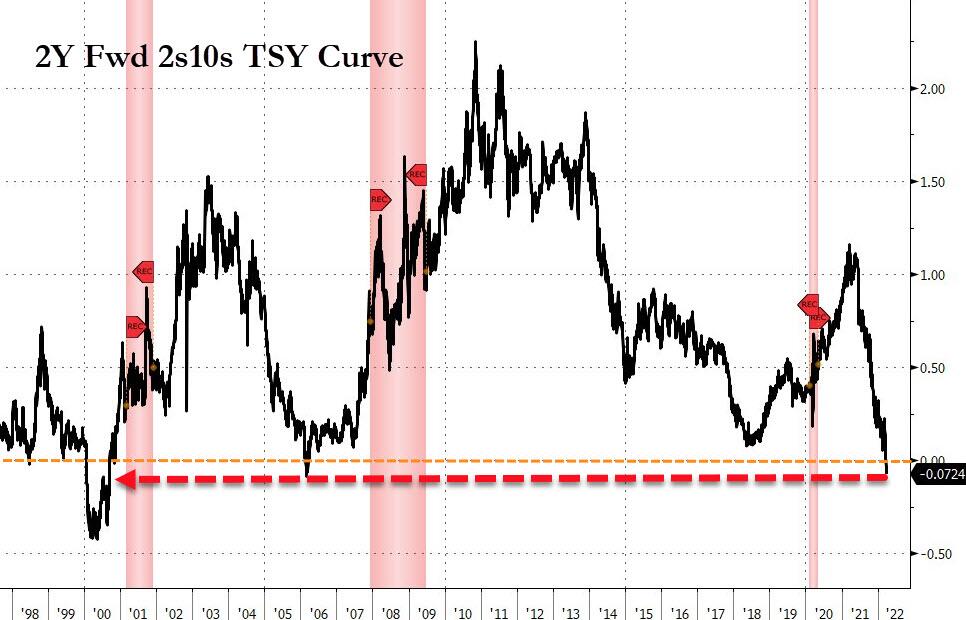
The 2/10 yield curve has now inverted meaning that 2-year bond yields are higher than 10-year ones. This has always been a precursor to a recession, as Bloomberg demonstrates in this chart.
Should that happen, Wall Street traders will be a happy bunch, because it means that lower rates hopefully will be on deck again.
2. ETFs in the Spotlight
In case you missed the announcement and description of this section, you can read it here again.
It features some of the 10 broadly diversified domestic and sector ETFs from my HighVolume list as posted every Saturday. Furthermore, they are screened for the lowest MaxDD% number meaning they have been showing better resistance to temporary sell offs than all others over the past year.
The below table simply demonstrates the magnitude with which these ETFs are fluctuating above or below their respective individual trend lines (%+/-M/A). A break below, represented by a negative number, shows weakness, while a break above, represented by a positive percentage, shows strength.
For hundreds of ETF choices, be sure to reference Thursday’s StatSheet.
For this just closed-out domestic “Buy” cycle, here’s how some of our candidates have fared:
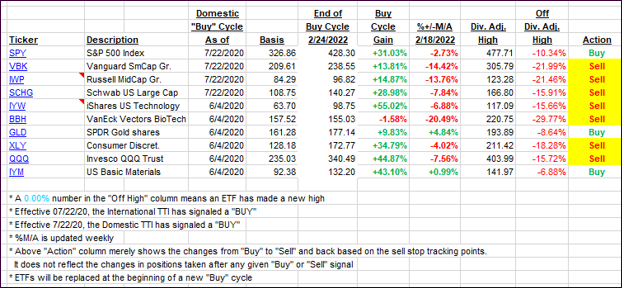
Click image to enlarge.
Again, the %+/-M/A column above shows the position of the various ETFs in relation to their respective long-term trend lines, while the trailing sell stops are being tracked in the “Off High” column. The “Action” column will signal a “Sell” once the -12% point has been taken out in the “Off High” column, which has replaced the prior -8% to -10% limits.
3. Trend Tracking Indexes (TTIs)
Our TTIs rode the roller coaster with the major indexes and reversed after yesterday’s sell off. Again, it’s still too early to come to a solid conclusion as to whether this current “Sell” cycle is over or not.
This is how we closed 03/24/2022:
Domestic TTI: +1.23% above its M/A (prior close +0.06%)—Sell signal effective 02/24/2022.
International TTI: +0.52% above its M/A (prior close +0.01%)—Sell signal effective 03/08/2022.
Disclosure: I am obliged to inform you that I, as well as my advisory clients, own some of the ETFs listed in the above table. Furthermore, they do not represent a specific investment recommendation for you, they merely show which ETFs from the universe I track are falling within the specified guidelines.
All linked charts above are courtesy of Bloomberg via ZeroHedge.
Contact Ulli