
- Moving the markets
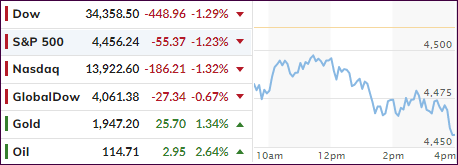
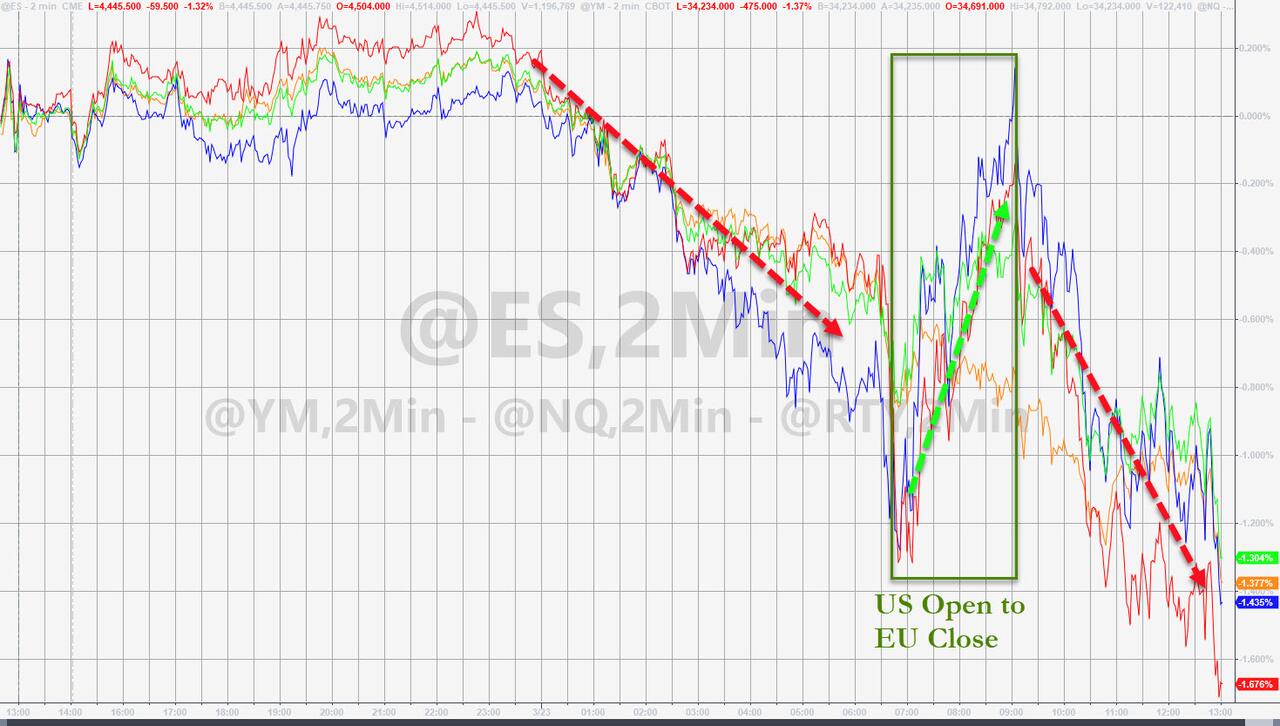
Yesterday’s rebound ran into a brick wall this morning with the major indexes getting stuck below their respective unchanged lines throughout the session. The usual afternoon ramp-a-thon was conspicuously absent leaving stocks no choice but to drop into a sinkhole.
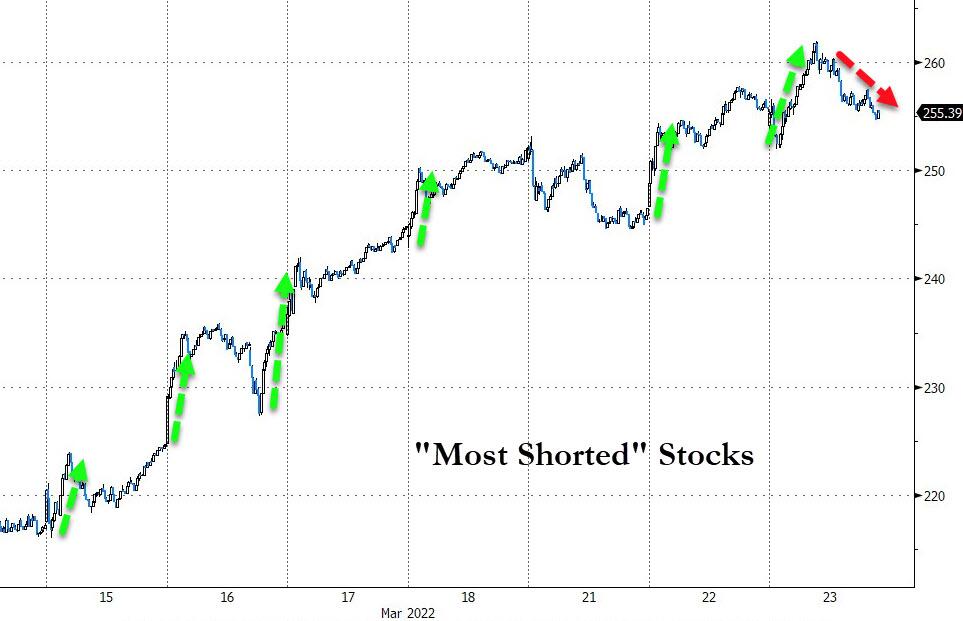
For sure, the path of least resistance was down, with not only a short squeeze lacking, but also with dip buyers apparently having left the trading floor for the day. This sudden downdraft is exactly the reason why I have refrained from confirming a new “Buy” signal. We are in a stalemate market environment where the long-term direction can’t clearly be identified, and the odds of experiencing a whipsaw signal are greatly enhanced.
Yes, the markets are trying to find some footing in the face of spiking interest rates, ever-present inflation fears and an economic slowdown, which may eventually negatively affect earnings. Let’s not forget the war, supply shortages and global energy issues, no matter where you look.
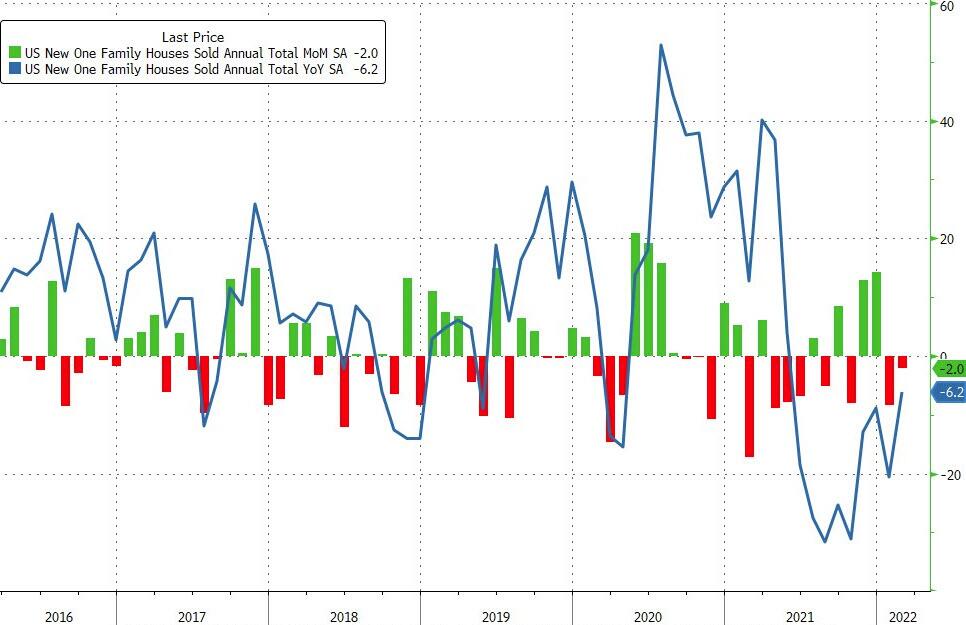
Not helping matters was news that New Home Sales unexpectedly tumbled in February (-2%), as ZH reported, with mortgage applications crashing. What’s even worse was the fact that January’s -4.5% drop was revised to a drastically worse -8.4% plunge. Ouch!
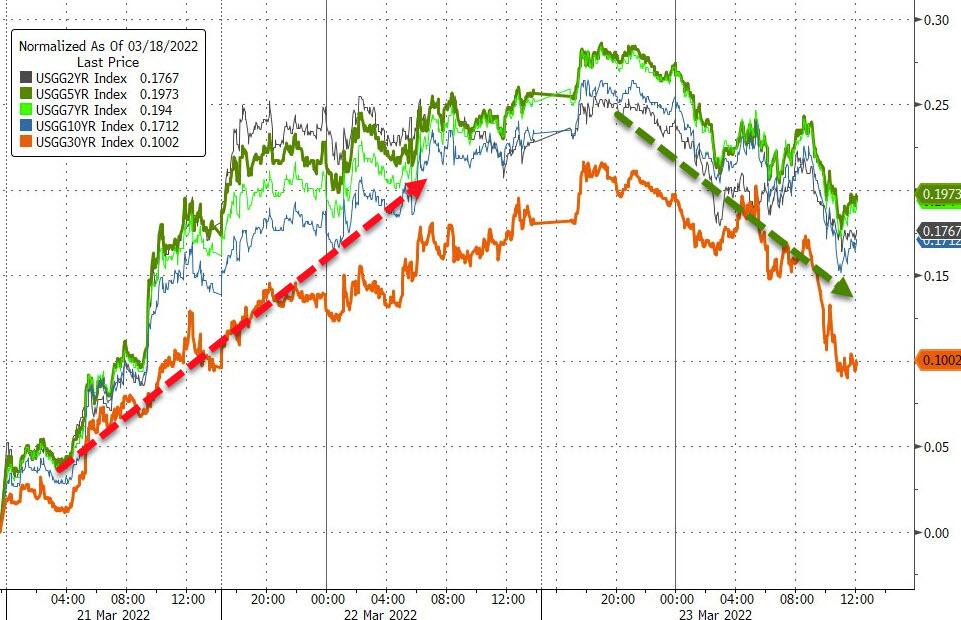
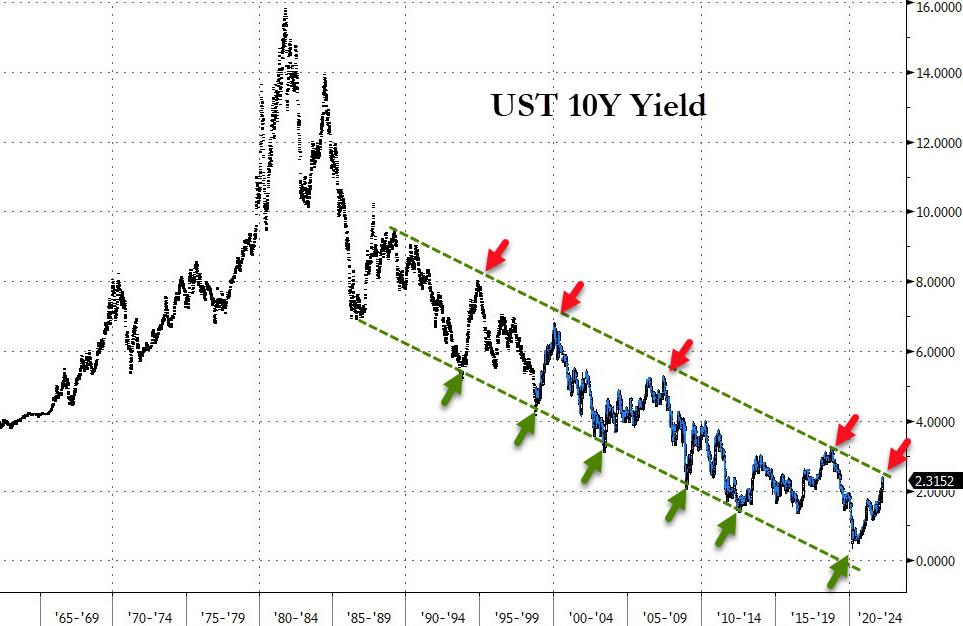
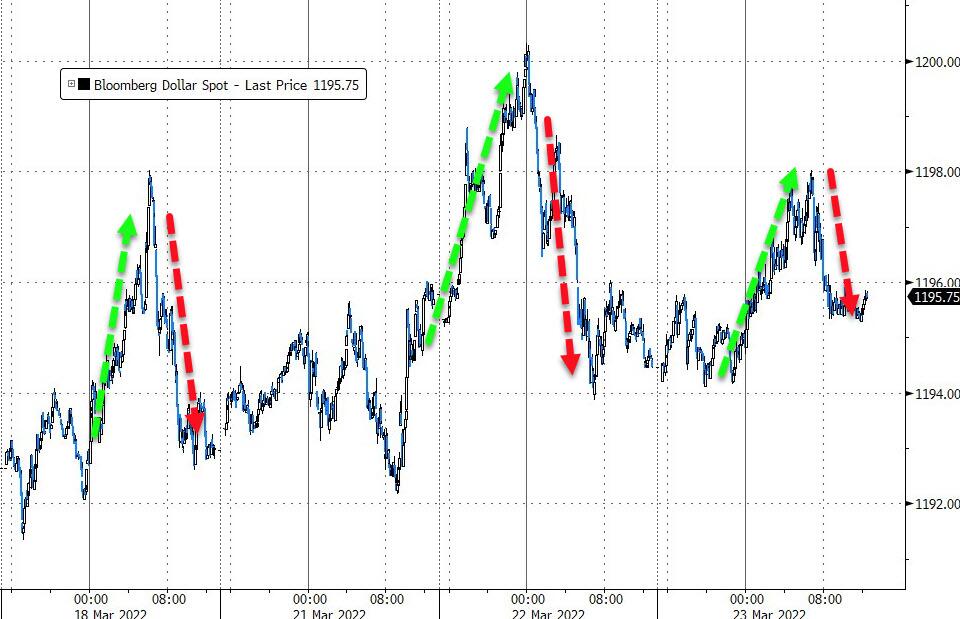
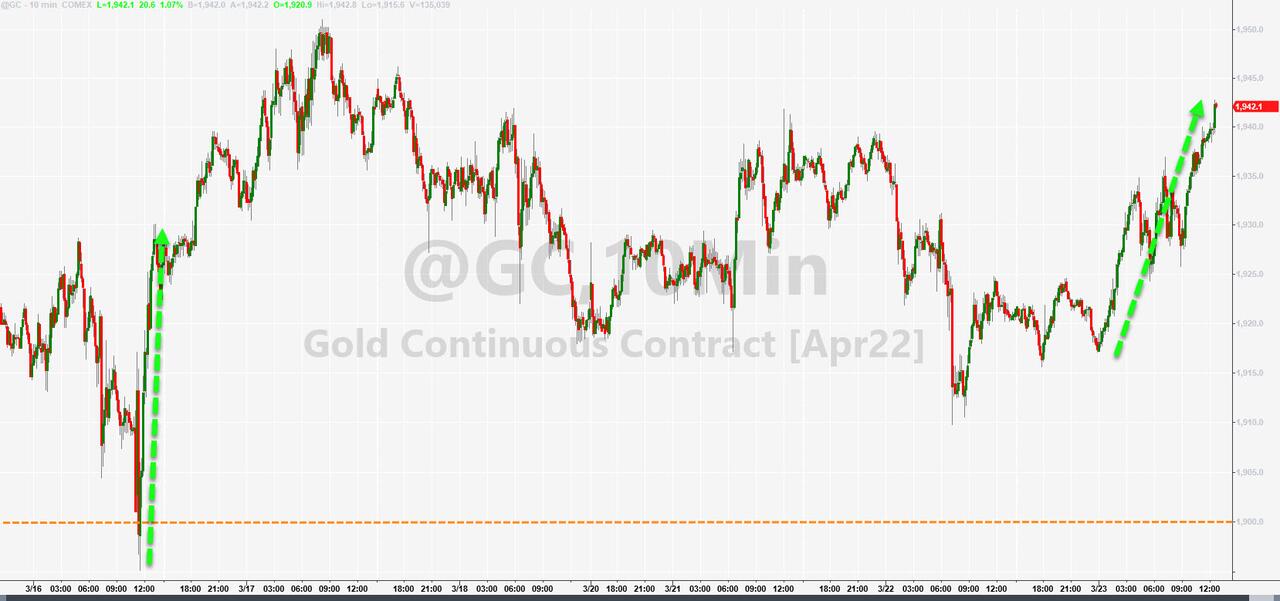
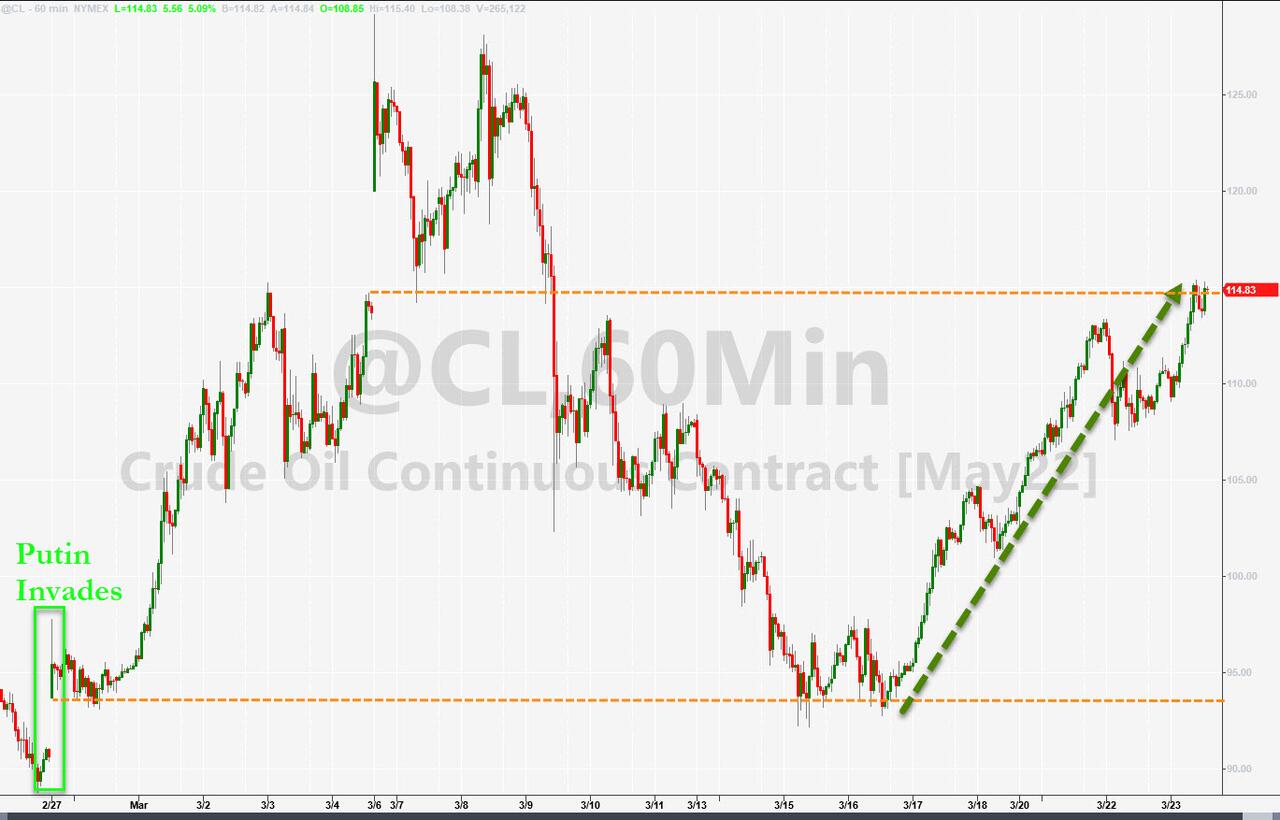
Bond yields dipped, after the recent spikes, with the 10-year settling at 2.29%, down 9 bps. The US Dollar round-tripped and ended moderately higher, while Gold, Energy (VDE +1.74%) and Crude Oil showed a lot of strength by closing solidly in the green.
In terms of Crude Oil and the Energy sector, problems, especially now in the Diesel market, are not over by a long shot, which ZH summed up best:
- This is far from over – even if US equities seemed to be telling a different tale in recent days.
2. ETFs in the Spotlight
In case you missed the announcement and description of this section, you can read it here again.
It features some of the 10 broadly diversified domestic and sector ETFs from my HighVolume list as posted every Saturday. Furthermore, they are screened for the lowest MaxDD% number meaning they have been showing better resistance to temporary sell offs than all others over the past year.
The below table simply demonstrates the magnitude with which these ETFs are fluctuating above or below their respective individual trend lines (%+/-M/A). A break below, represented by a negative number, shows weakness, while a break above, represented by a positive percentage, shows strength.
For hundreds of ETF choices, be sure to reference Thursday’s StatSheet.
For this just closed-out domestic “Buy” cycle, here’s how some of our candidates have fared:
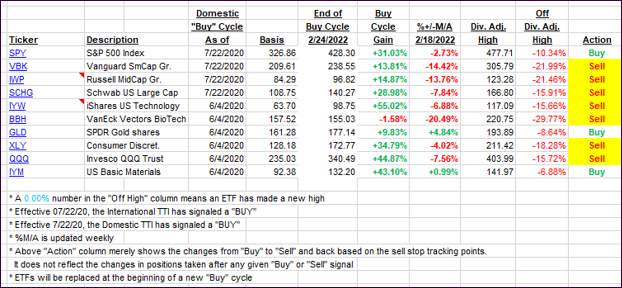
Click image to enlarge.
Again, the %+/-M/A column above shows the position of the various ETFs in relation to their respective long-term trend lines, while the trailing sell stops are being tracked in the “Off High” column. The “Action” column will signal a “Sell” once the -12% point has been taken out in the “Off High” column, which has replaced the prior -8% to -10% limits.
3. Trend Tracking Indexes (TTIs)
Our TTIs got clobbered with the indexes and are now sitting right on top of their respective trend lines. It’s totally uncertain in which direction a final breakout will materialize, and until that has been confirmed, I will keep our “Sell” signals intact.
This is how we closed 03/23/2022:
Domestic TTI: +0.06% above its M/A (prior close +1.51%)—Sell signal effective 02/24/2022.
International TTI: +0.01% above its M/A (prior close +0.69%)—Sell signal effective 03/08/2022.
Disclosure: I am obliged to inform you that I, as well as my advisory clients, own some of the ETFs listed in the above table. Furthermore, they do not represent a specific investment recommendation for you, they merely show which ETFs from the universe I track are falling within the specified guidelines.
All linked charts above are courtesy of Bloomberg via ZeroHedge.
Contact Ulli