Modest Advances Ahead Big Earnings Week

Ulli Market Neutral ETFs Contact

[Chart courtesy of MarketWatch.com]

  1. Moving the markets

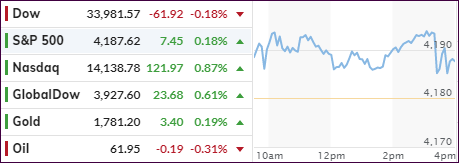
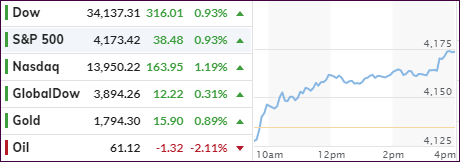
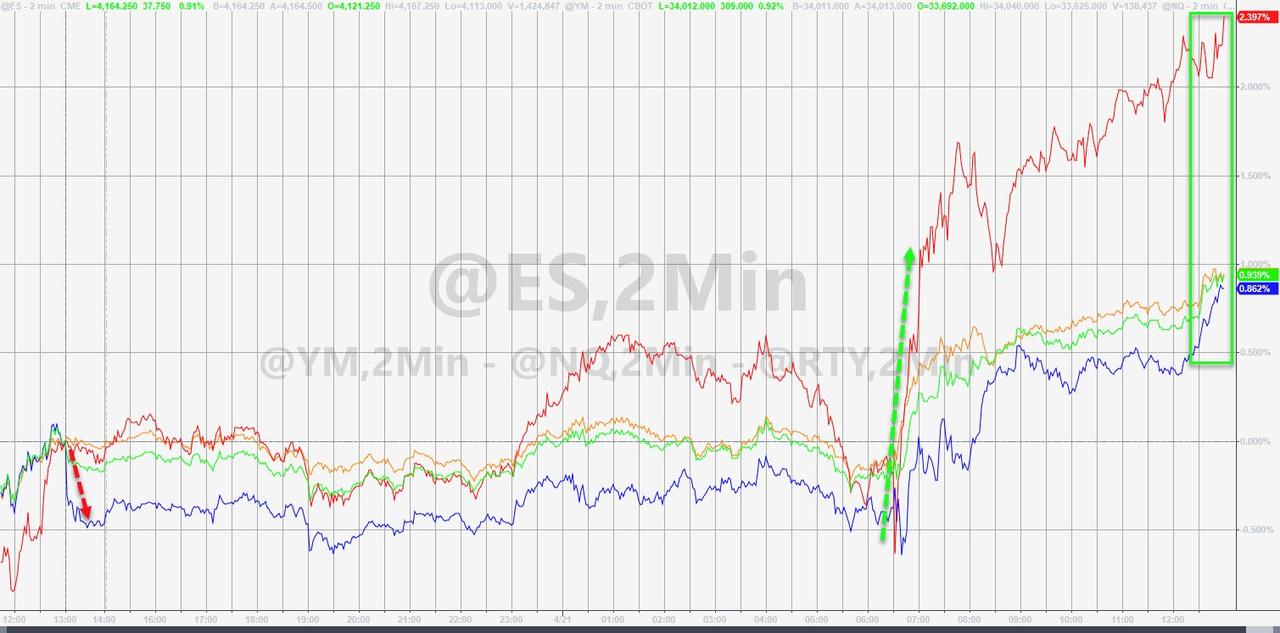
Ahead of a big earnings week, two of the three major indexes managed to eke out some gains, while the Dow slid slightly into the red due to the consumer staples sector retreating over 1%.

The cause was surging commodity prices, which increased inflation fears, as corn and copper, among others, reached their highest levels in some 10 years. Of course, the Fed does not see inflation anywhere, but those of us that regularly buy groceries, fuel up our cars and use energy in our daily lives, have already experienced some of its effects.

Noted CNBC:

Bank of America data showed the number of “inflation” mentions during earnings calls this reporting season has tripled compared to last year, the biggest jump since 2004 when the bank started tracking the number.

On the earnings front, about 1/3 of the S&P 500 companies are set to release their quarterly report cards. Some of the big hitters like Apple, Microsoft, Amazon, and Alphabet are on deck as well.

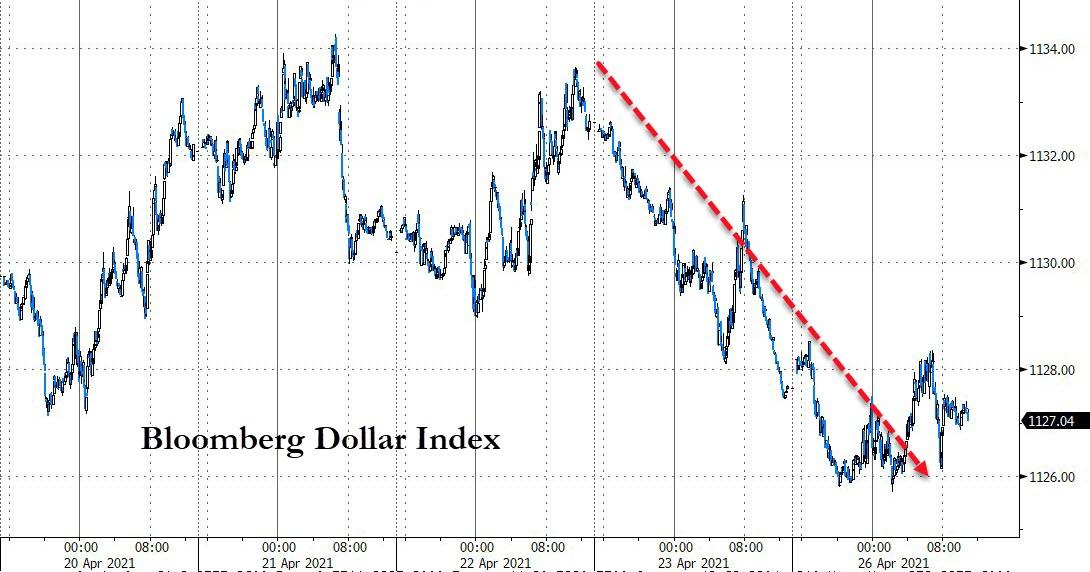
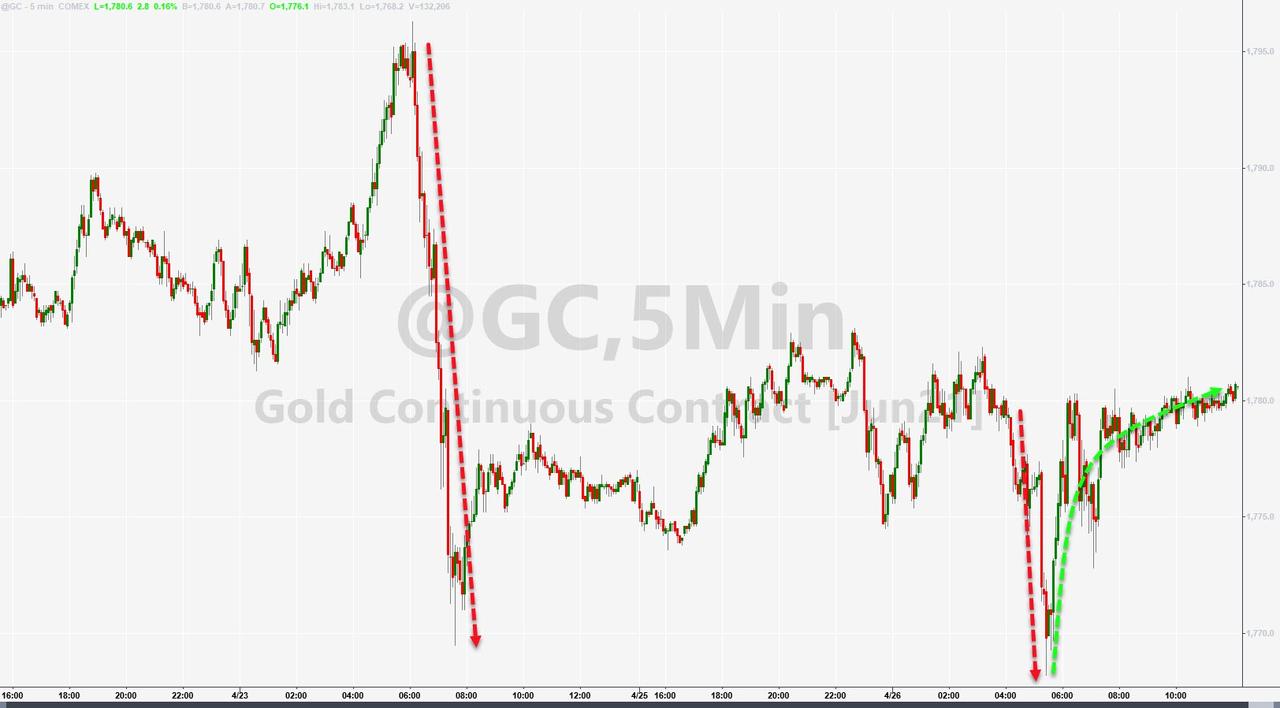
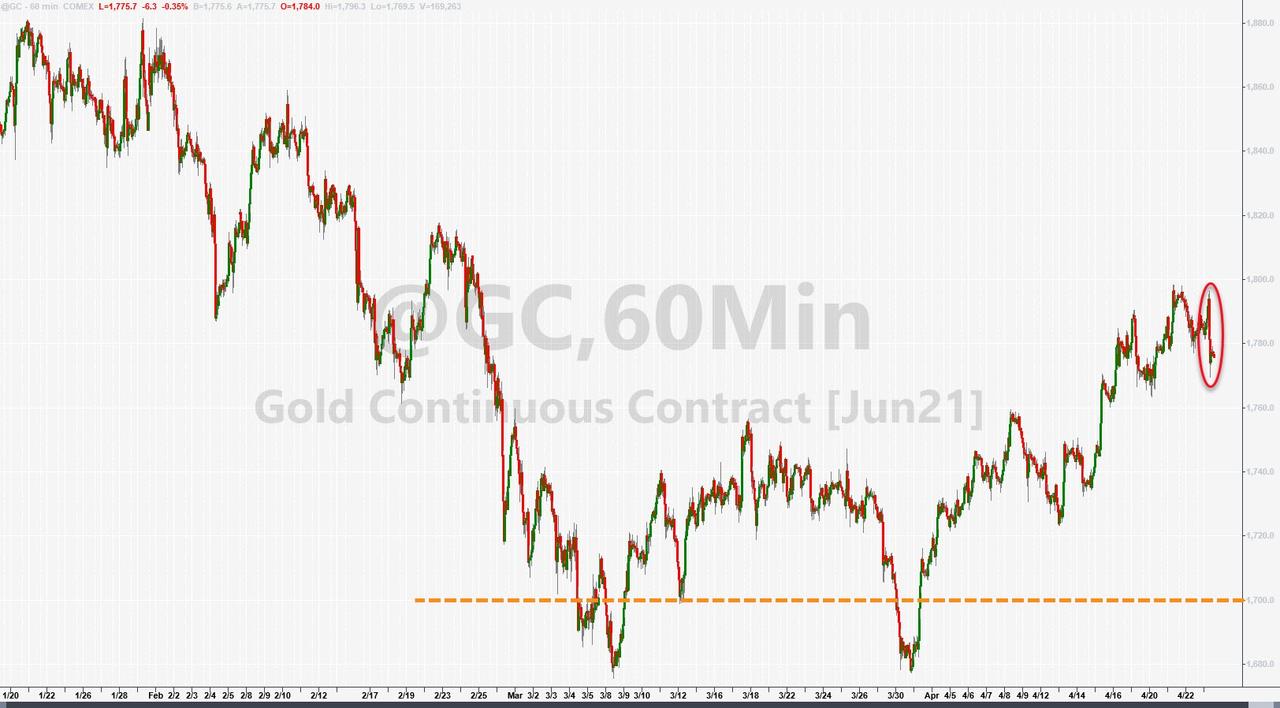
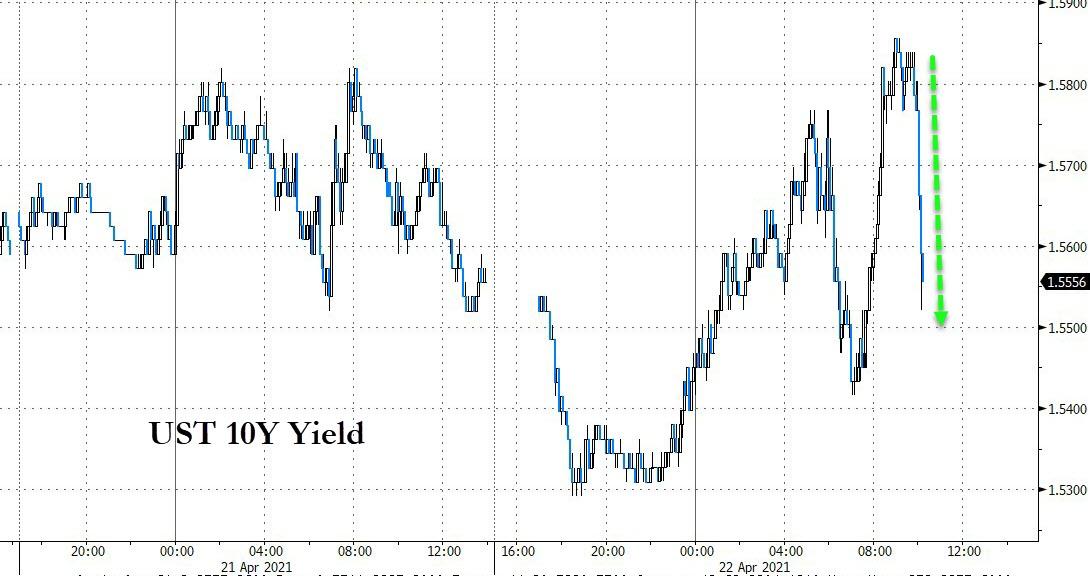
The US Dollar rode a roller coaster and ended slightly lower, but it was enough volatility to give Gold a minor boost. Despite the overall positive tone in equities, bond yields stayed in a tight range and ended the session basically unchanged.

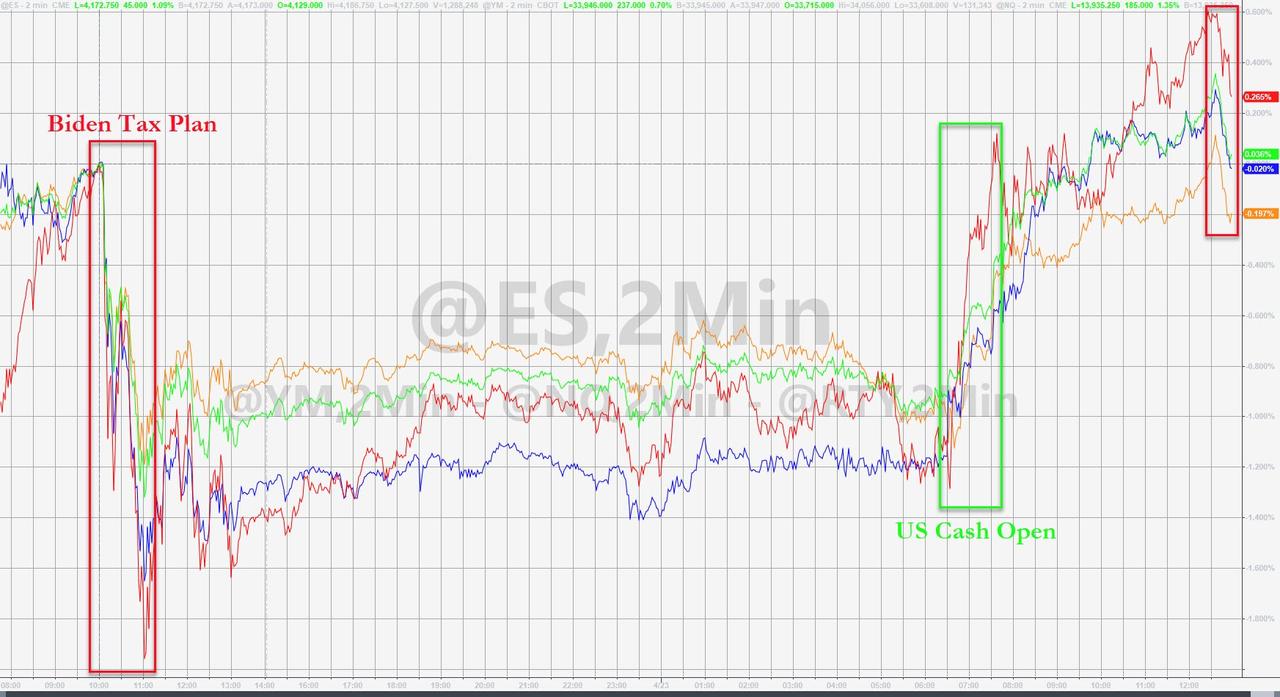
The continued bullish bias in equities has been supported by the easiest Fed monetary policy ever, as ZH pointed to in the below chart by Bloomberg:

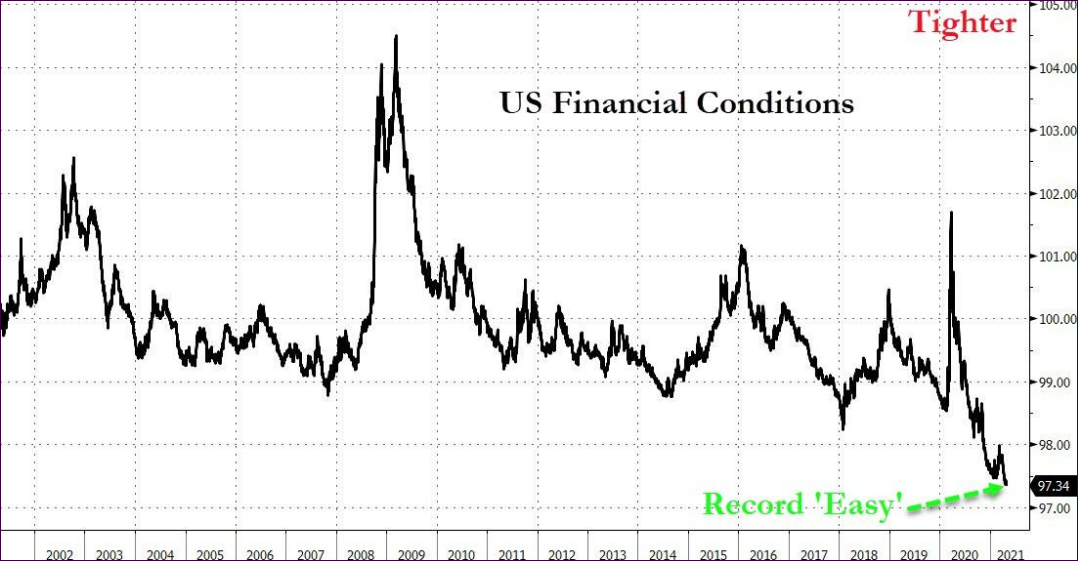
Makes me go “hmm.” How much longer can that go on?

Read More

ETFs On The Cutline – Updated Through 04/23/2021

Ulli ETFs on the Cutline Contact

Below, please find the latest High-Volume ETF Cutline report, which shows how far above or below their respective long-term trend lines (39-week SMA) my currently tracked ETFs are positioned.

This report covers the HV ETF Master List from Thursday’s StatSheet and includes 312 High Volume ETFs, defined as those with an average daily volume of more than $5 million, of which currently 253 (last week 253) are hovering in bullish territory. The yellow line separates those ETFs that are positioned above their trend line (%M/A) from those that have dropped below it.

Take a look:                                                                   

The HV ETF Master Cutline Report

In case you are not familiar with some of the terminology used in the reports, please read the Glossary of Terms. If you missed the original post about the Cutline approach, you can read it here.      

ETF Tracker Newsletter For April 23, 2021

Ulli ETF Tracker Contact

ETF Tracker StatSheet          

You can view the latest version here.

RECOVERING AND RALLYING INTO THE WEEKEND

[Chart courtesy of MarketWatch.com]

  1. Moving the markets

The futures recovered from Thursday’s “capital gains sell-off,” the mood of which carried over into the regular session, with the S&P 500 adding over 1% and thereby ending the week just about unchanged (-0.1%). The Nasdaq and the Dow gave back 0.3% and 0.5% respectively.

For sure, the proposed hike in capital gains taxes remained on everyone’s mind, but cooler heads determined that due to the narrow majority in Congress, this bill might face tremendous hurdles, and that the final version might be scaled back considerably. Goldman Sachs opined that a modest increase to 28% might be more realistic.

In economic news, we saw that New Home Sales exploded in March being higher by 20.7% MoM. YoY the number was an enormous 66.8%, which is misleading due to the base being the lockdown lows in March of 2020.

Bond yields were stuck in a sideways pattern for the past 3 days, while the US Dollar index continued its best imitation of a swan dive. Gold attempted to crack the $1,800 level but failed.  

The major indexes recovered nicely from Tuesday’s and Thursday’s sell-off with “value” and “growth” moving in sync this week, as Bloomberg points to in this chart. The VIX calmed down after some mid-week pumping, and right now equities seem to have found their bullish theme again—at least for the time being.  

Read More

Weekly StatSheet For The ETF Tracker Newsletter – Updated Through 04/22/2021

Ulli ETF StatSheet Contact

ETF Data updated through Thursday, April 22, 2021

Methodology/Use of this StatSheet:

1. From the universe of over 1,800 ETFs, I have selected only those with a trading volume of over $5 million per day (HV ETFs), so that liquidity and a small bid/ask spread are assured.

2. Trend Tracking Indexes (TTIs)

Buy or Sell decisions for Domestic and International ETFs (section 1 and 2), are made based on the respective TTI and its position either above or below its long-term M/A (Moving Average). A crossing of the trend line from below accompanied by some staying power above constitutes a “Buy” signal. Conversely, a clear break below the line constitutes a “Sell” signal. Additionally, I use an 8% trailing stop loss on all positions in these categories to control downside risk.

3. All other investment arenas do not have a TTI and should be traded based on the position of the individual ETF relative to its own respective trend line (%M/A). That’s why those signals are referred to as a “Selective Buy.” In other words, if an ETF crosses its own trendline to the upside, a “Buy” signal is generated. Since these areas tend to be more volatile, I recommend a wider trailing sell stop of 8%-10% depending on your risk tolerance.

If you are unfamiliar with some of the terminology, please see Glossary of Terms and new subscriber information in section 9.     

1. DOMESTIC EQUITY ETFs: BUY — since 07/22/2020

Click on chart to enlarge

Our main directional indicator, the Domestic Trend Tracking Index (TTI-green line in the above chart) has now rallied above its long-term trend line (red) by +19.32% and remains in “BUY” mode as posted.

Read More

Markets Puke On News Of Capital Gains Tax Doubling

Ulli Market Commentary Contact

[Chart courtesy of MarketWatch.com]

  1. Moving the markets

A weak opening reversed quickly, as the major indexes found enough mojo to reclaim their respective unchanged lines. That is until news struck fear in the hearts of traders because of the Biden Administration’s plan for the capital gains tax to be almost doubled.

Via ZH, Bloomberg explained it this way:

The plan would boost the capital gains rate to 39.6% for those earning $1 million or more, an increase from the current base rate of 20%, the people said on the condition of anonymity because the plan is not yet public.

A 3.8% tax on investment income that funds Obamacare would be kept in place, pushing the tax rate on returns on financial assets higher than the top rate on wage and salary income, they said.

The proposal could reverse a long-standing provision of the tax code that taxes returns on investment lower than on labor. Biden campaigned on equalizing the capital gains and income tax rates for wealthy individuals, saying it’s unfair that many of them pay lower rates than middle-class workers.

For $1 million earners in high-tax states, rates on capital gains could be above 50%.

For New Yorkers, the combined state and federal capital gains rate could be as high as 52.22%. For Californians, it could be 56.7%.

Ouch! However, things could get even worse, if this change would be made retroactively for 2021, thereby giving no one with a taxable account a chance to cash out at the current lower rate.

Needless to say, markets reversed instantly with all major indexes puking with the Dow shedding 300 points within seconds. Benefiting were bonds, which rallied as yields dropped.

For sure, uncertainty has risen a notch, but it is unclear whether this proposal can be passed in its present form, but it indicates that future policies may a lot less market friendly than what we’ve seen in the past.

It remains to be seen if more market fallout is to come, although the bounce in the last hour can be seen as a positive.

Read More

Two Days Of Dropping Followed By A Day Of Popping

Ulli Market Commentary Contact

[Chart courtesy of MarketWatch.com]

  1. Moving the markets

The futures already pointed to a reversal, with the S&P switching from red to green, which continued into the regular session, as all three major indexes attempted to wipe out the losses of the past two days.

As the chart above shows, there was no hesitation nor any looking back with the bulls clearly being in charge driving the indexes out of their recent doldrums. The Nasdaq lagged for a while, as Netflix proved to be a drag with an 8% plunge, but in the end, the index picked up speed and led the majors with a 1.19% advance.

SmallCaps came back from hibernation with VBK recovering 2.04%, which was closely followed by our value play, RPV, which added a solid 1.94%. Even the equally weighted S&P index (RSP) outperformed its Large Cap SPY cousin with an increase of 1.31% vs. 0.92%.

So far, the earnings season has been touted a success with companies delivering solid quarterly results, however, most analysts are now focused on the outlook of companies willing to make any forecasts.   

More than 70 S&P 500 companies have reported so far, according to CNBC, and they have on average posted a 23% upside to analysts’ earnings expectations. The volatility index (VIX), which rises when markets fall, dropped after advancing two days in a row, as all was calm in the trading community today.

Sure, there are always things to worry about, like the course of Covid, inflation concerns, debts and deficits, and the occasional earnings miss. But, right now, the bulls appear to have the upper hand, and major trends continue to be higher with new ATHs being made almost weekly.  

Read More