
ETF Tracker StatSheet
You can view the latest version here.
RECOVERING AND RALLYING INTO THE WEEKEND
- Moving the markets
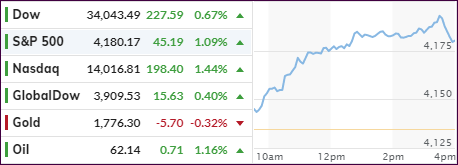
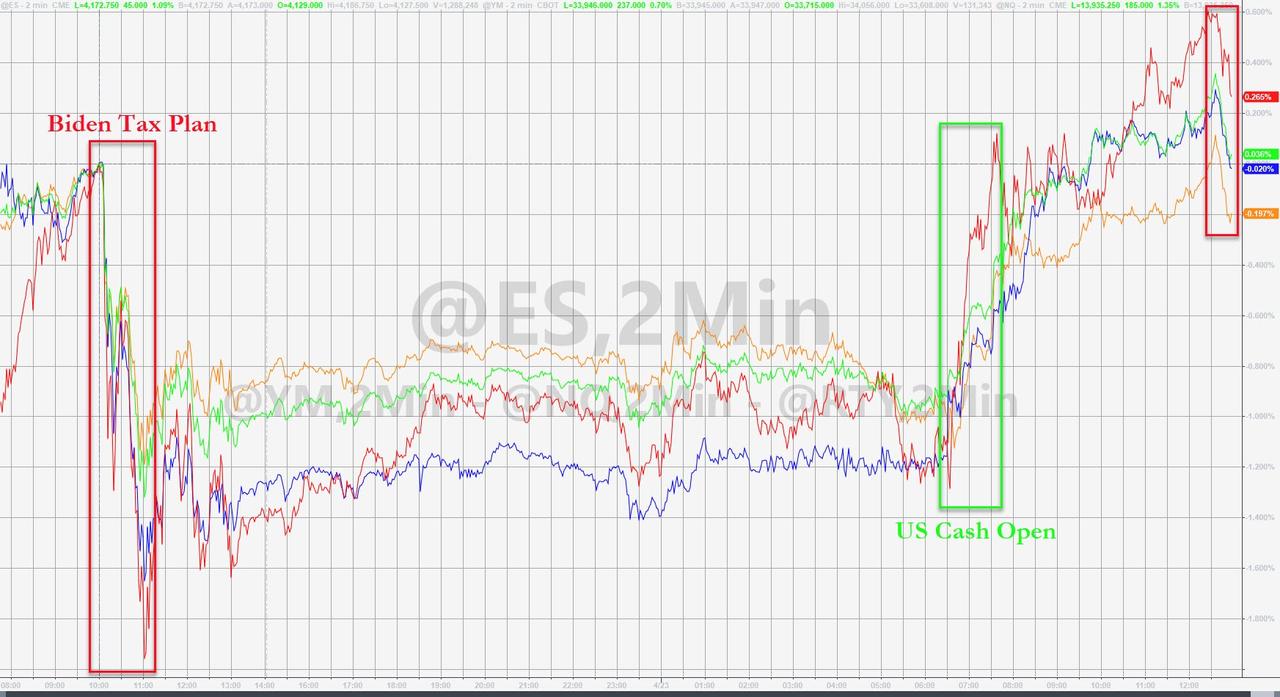
The futures recovered from Thursday’s “capital gains sell-off,” the mood of which carried over into the regular session, with the S&P 500 adding over 1% and thereby ending the week just about unchanged (-0.1%). The Nasdaq and the Dow gave back 0.3% and 0.5% respectively.
For sure, the proposed hike in capital gains taxes remained on everyone’s mind, but cooler heads determined that due to the narrow majority in Congress, this bill might face tremendous hurdles, and that the final version might be scaled back considerably. Goldman Sachs opined that a modest increase to 28% might be more realistic.
In economic news, we saw that New Home Sales exploded in March being higher by 20.7% MoM. YoY the number was an enormous 66.8%, which is misleading due to the base being the lockdown lows in March of 2020.
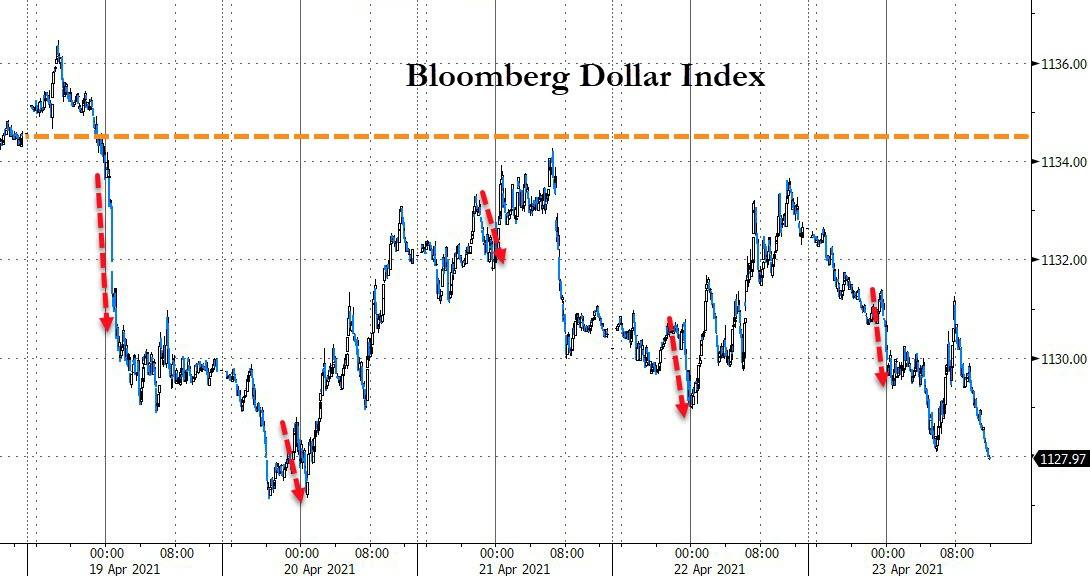
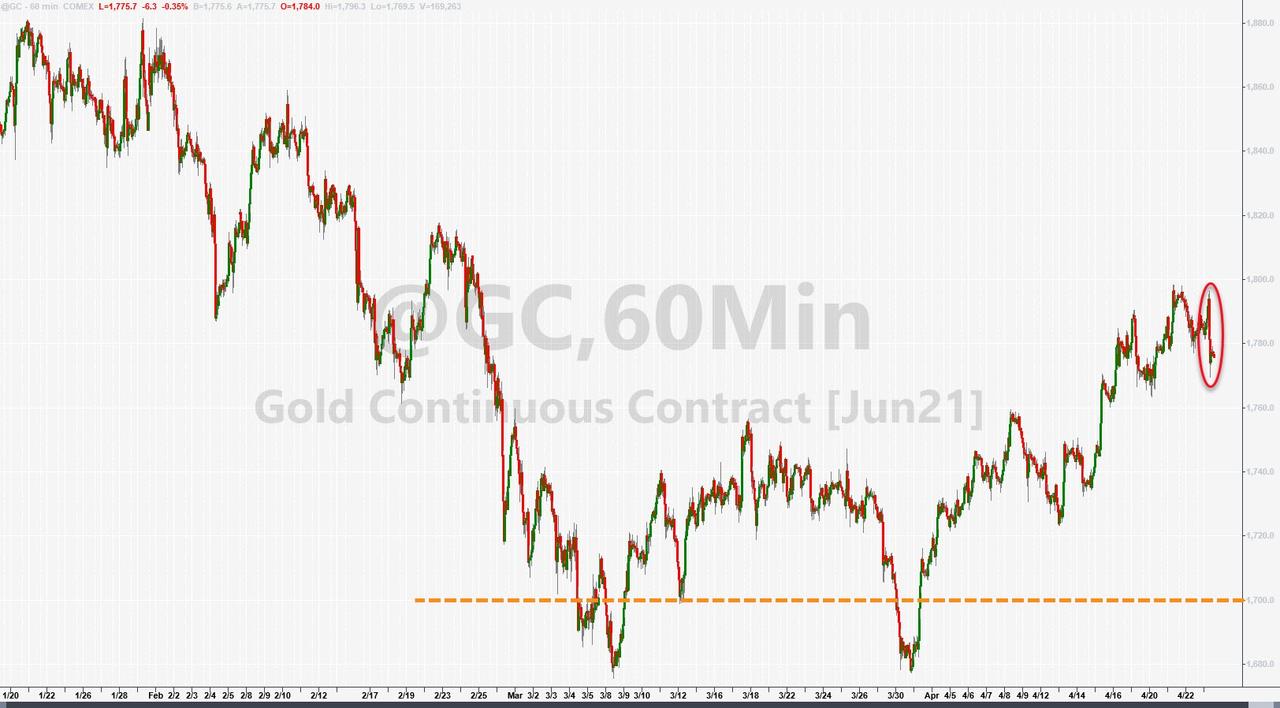
Bond yields were stuck in a sideways pattern for the past 3 days, while the US Dollar index continued its best imitation of a swan dive. Gold attempted to crack the $1,800 level but failed.
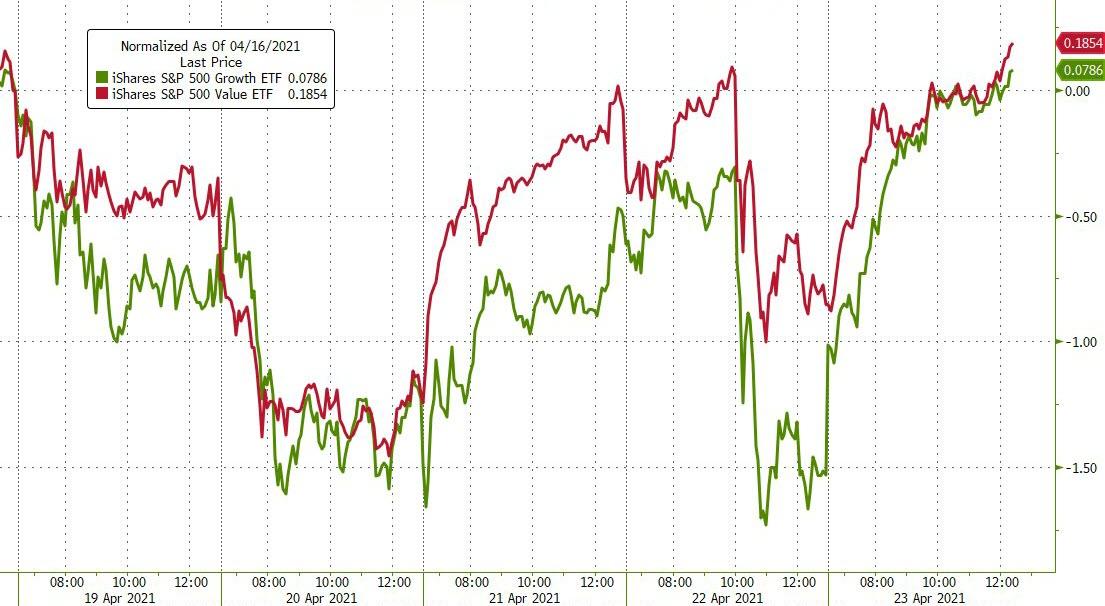
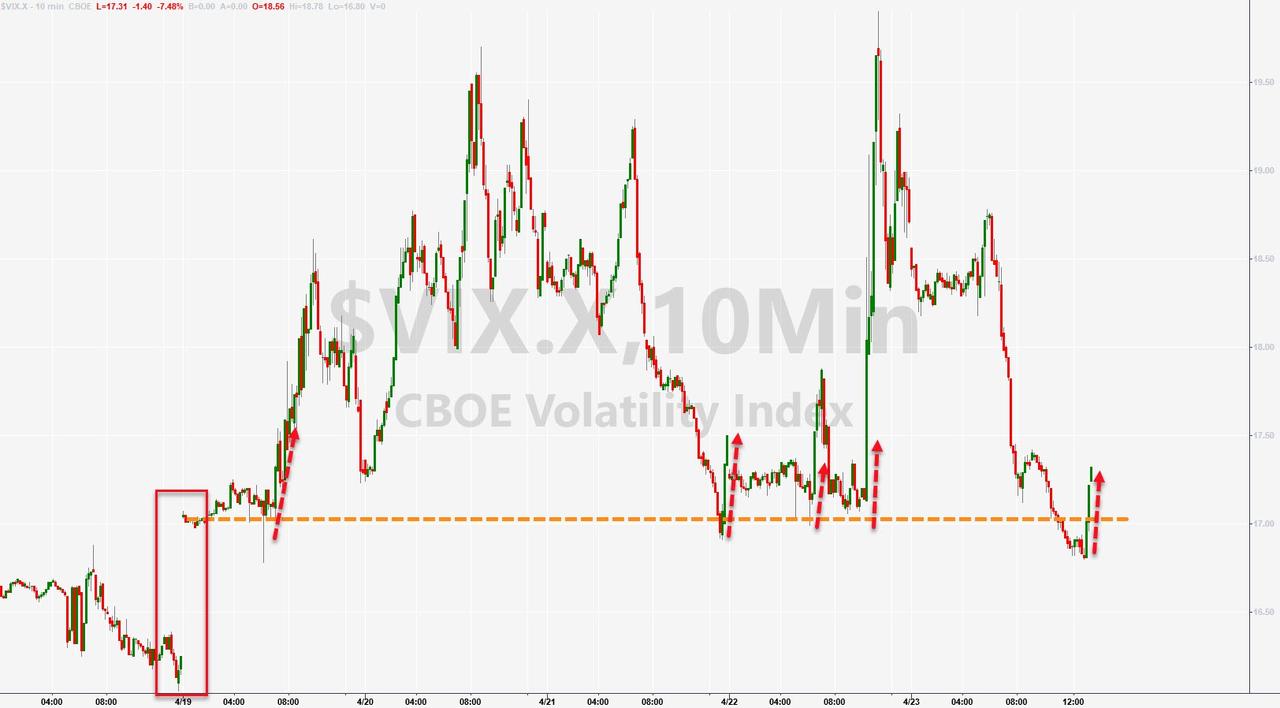
The major indexes recovered nicely from Tuesday’s and Thursday’s sell-off with “value” and “growth” moving in sync this week, as Bloomberg points to in this chart. The VIX calmed down after some mid-week pumping, and right now equities seem to have found their bullish theme again—at least for the time being.
2. ETFs in the Spotlight
In case you missed the announcement and description of this section, you can read it here again.
It features some of the 10 broadly diversified domestic and sector ETFs from my HighVolume list as posted every Saturday. Furthermore, they are screened for the lowest MaxDD% number meaning they have been showing better resistance to temporary sell offs than all others over the past year.
The below table simply demonstrates the magnitude with which these ETFs are fluctuating above or below their respective individual trend lines (%+/-M/A). A break below, represented by a negative number, shows weakness, while a break above, represented by a positive percentage, shows strength.
For hundreds of ETF choices, be sure to reference Thursday’s StatSheet.
For this current domestic “Buy” cycle, here’s how some our candidates have fared:
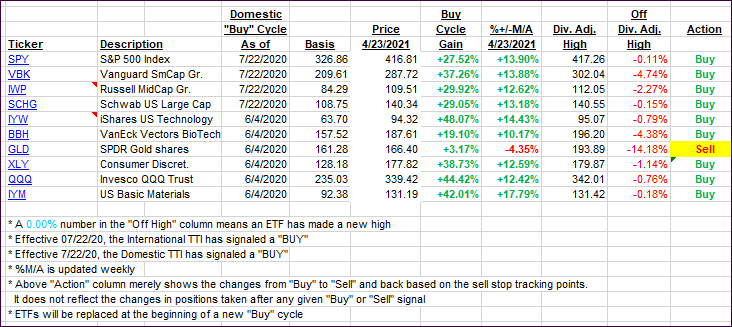
Click image to enlarge.
Again, the %+/-M/A column above shows the position of the various ETFs in relation to their respective long-term trend lines, while the trailing sell stops are being tracked in the “Off High” column. The “Action” column will signal a “Sell” once the -8% point has been taken out in the “Off High” column. For more volatile sector ETFs, the trigger point is -10%.
3. Trend Tracking Indexes (TTIs)
Our TTIs were mixed and did not change by a considerable margin.
This is how we closed 4/23/2021:
Domestic TTI: +19.53% above its M/A (prior close +19.32%)—Buy signal effective 07/22/2020.
International TTI: +15.20% above its M/A (prior close +15.36%)—Buy signals effective 07/22/2020.
Disclosure: I am obliged to inform you that I, as well as my advisory clients, own some of the ETFs listed in the above table. Furthermore, they do not represent a specific investment recommendation for you, they merely show which ETFs from the universe I track are falling within the specified guidelines.
———————————————————-
WOULD YOU LIKE TO HAVE YOUR INVESTMENTS PROFESSIONALLY MANAGED?
Do you have the time to follow our investment plans yourself? If you are a busy professional who would like to have his portfolio managed using our methodology, please contact me directly or get more details here.
———————————————————
Back issues of the ETF Tracker are available on the web.
Contact Ulli