Flopping And Chopping

Ulli Market Commentary Contact

[Chart courtesy of MarketWatch.com]

  1. Moving the markets

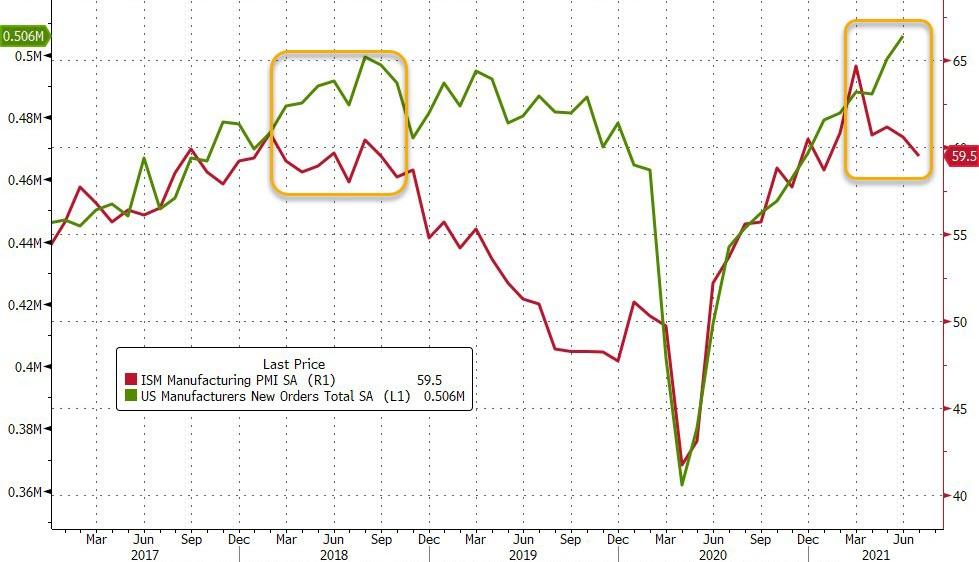
The growth meme was the talk of the day on Wall Street, as concerns mounted again that not all is well in the world of economics.

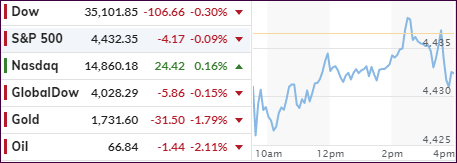
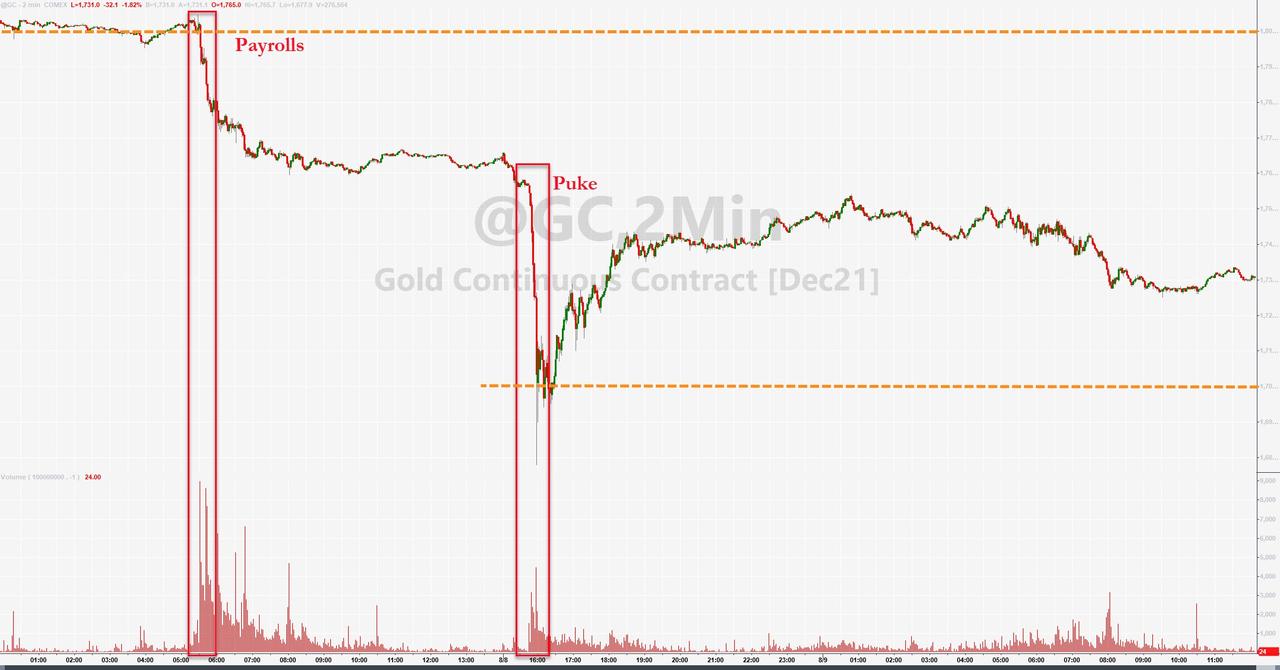
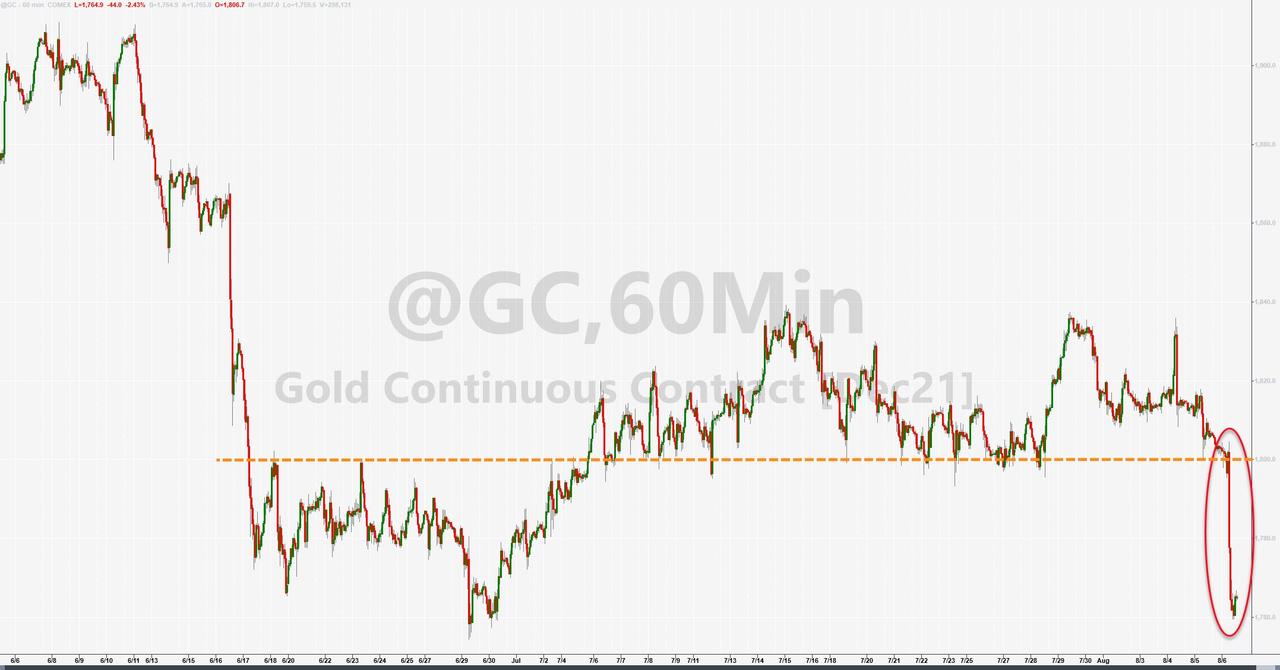
Things started on a shaky foundation in the futures markets, with all major indexes in the red, while gold got hammered almost 3%, as one entity unloaded $4 billion in gold contracts. This was obviously an act of manipulation because an investor concerned with not moving markets adversely would liquidate a holding slowly and meticulously and not dump it all at once.

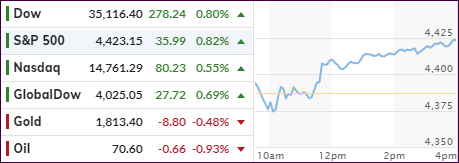
As the chart above shows, a mid-day rebound pushed the S&P 500 back above its flatline, but it slipped into the close with a minor loss, with the Dow following suit. The Nasdaq showed more bullishness and eked out a small gain.

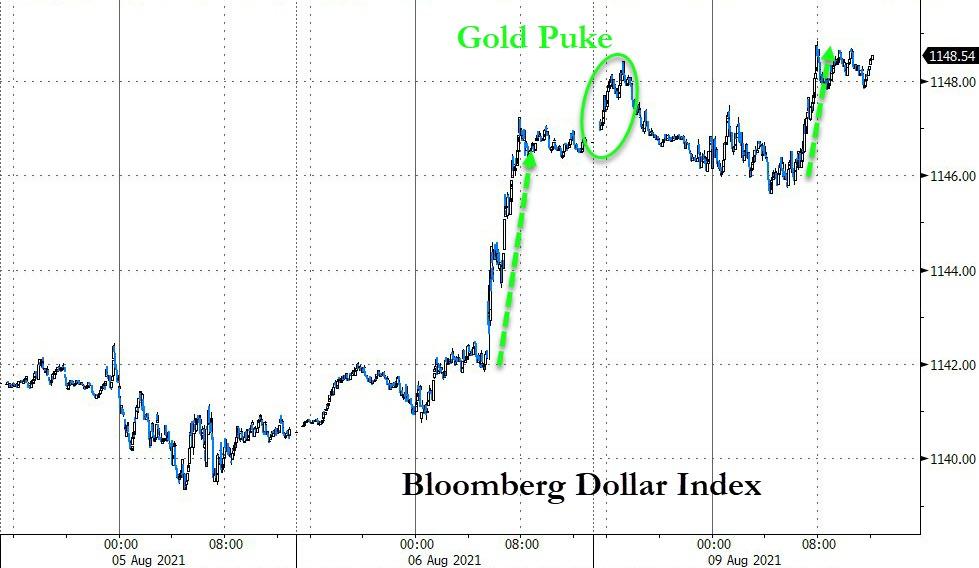
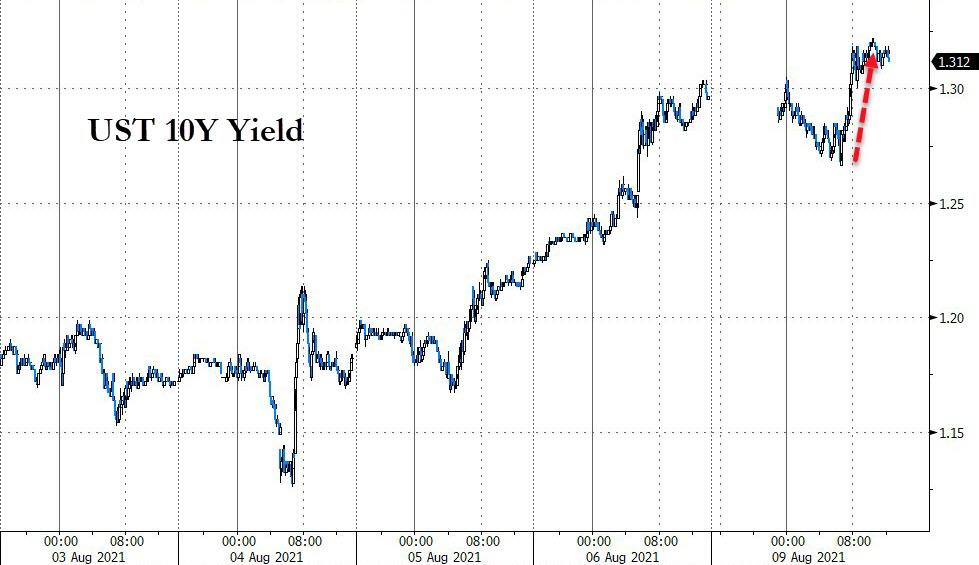
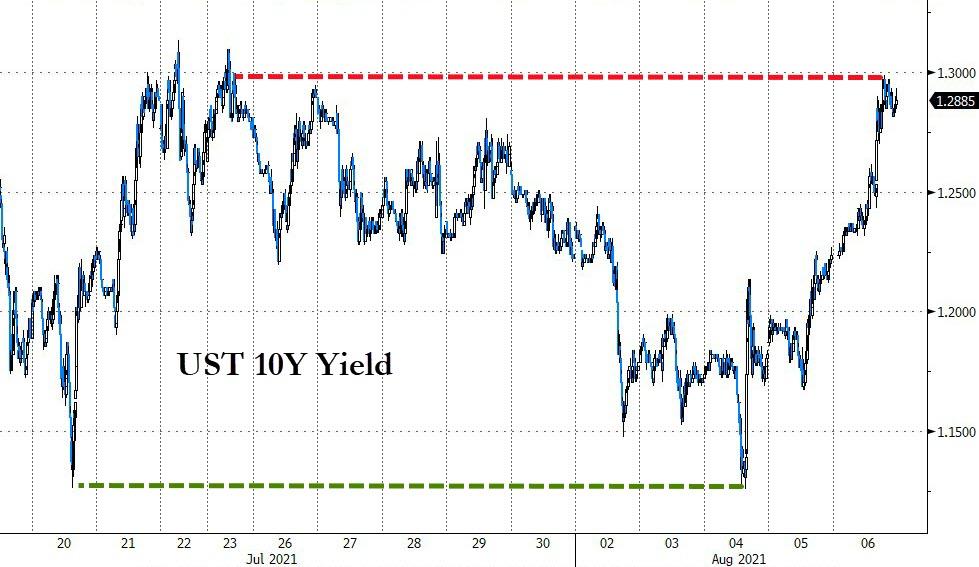
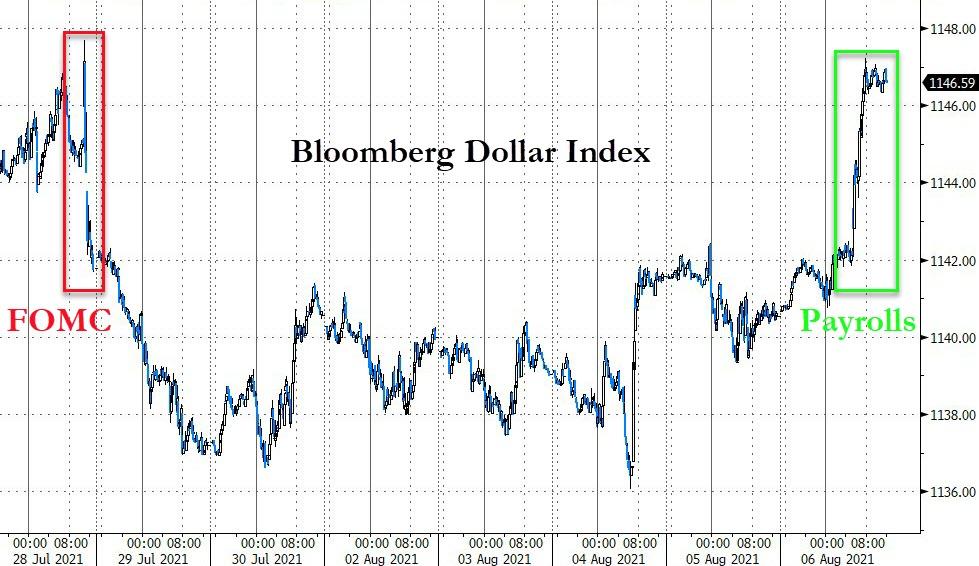
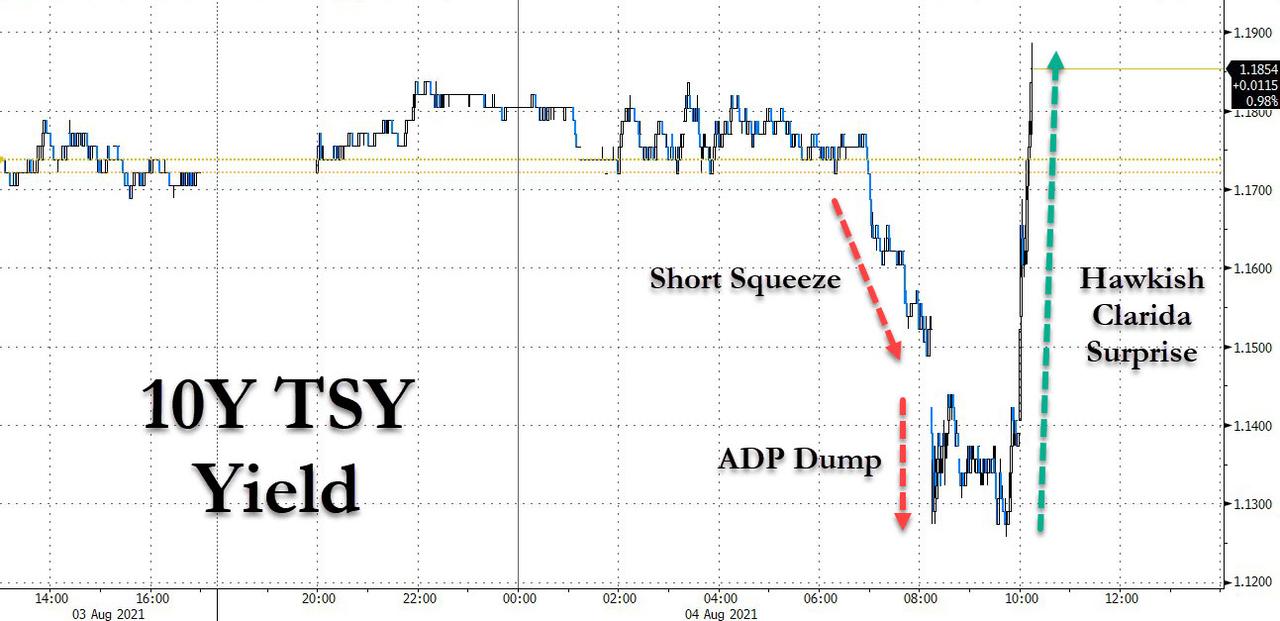
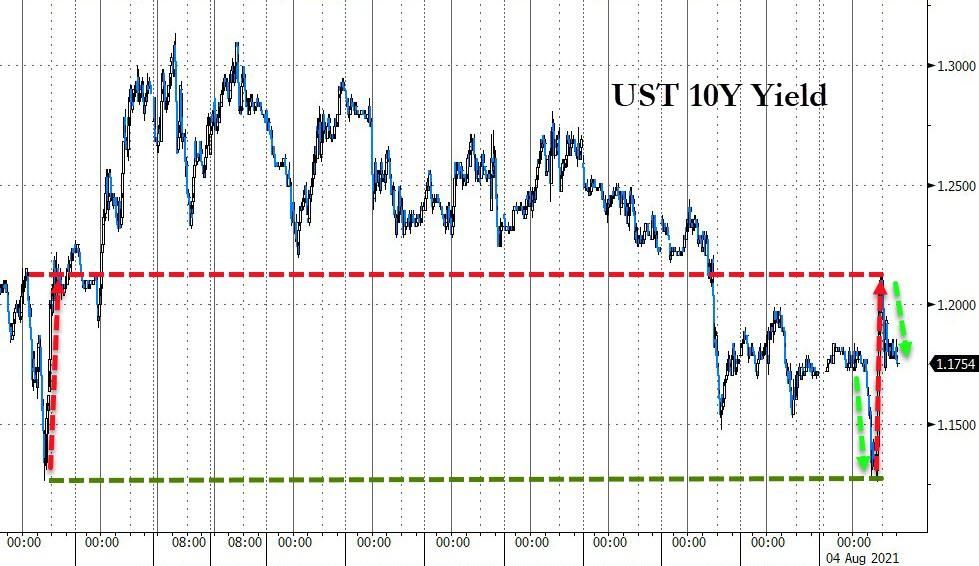
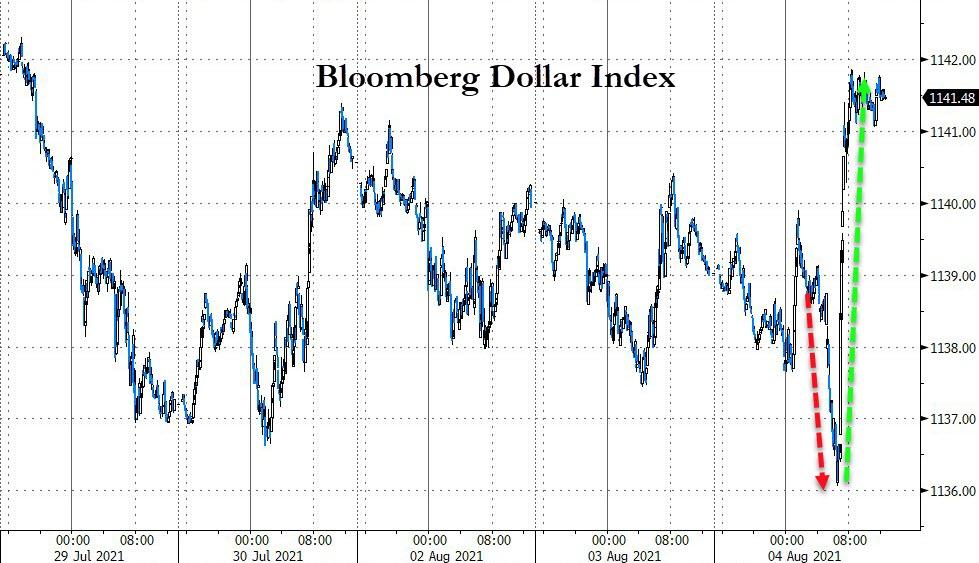
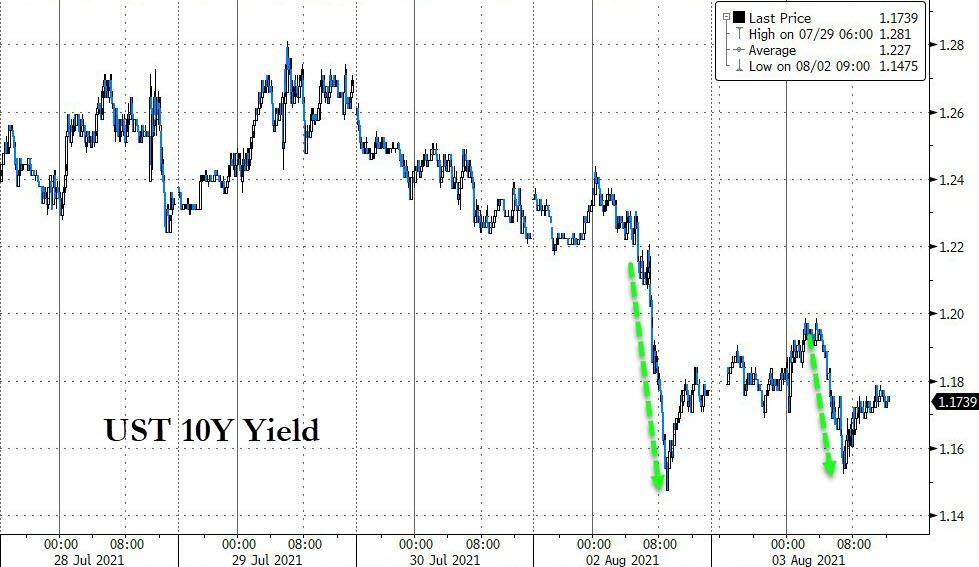
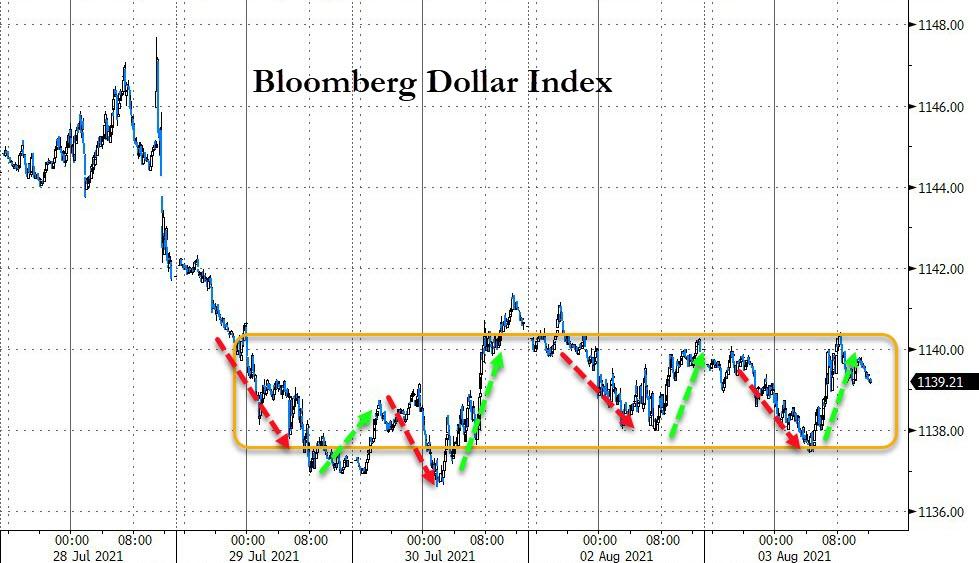
The US Dollar continued its upswing from last Friday but wavered during this session yet gained modestly in the end. Not helping gold nor stocks was the 10-year bond yield which, after an early pullback, found some momentum and reclaimed its 1.3% level.  

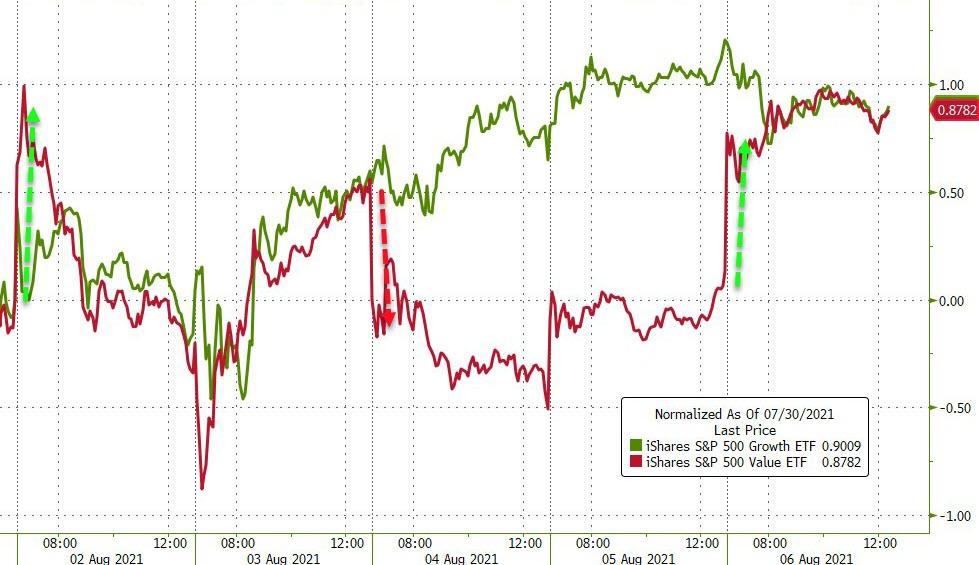
Small Caps (VBK) slipped moderately while Value (RPV) gained a tad, as financials (XLF) were favored (+0.26%) due to rising bond yields.

Looking at the big picture, the markets went nowhere with some gainers offsetting some losers.   

Read More

ETFs On The Cutline – Updated Through 08/06/2021

Ulli ETFs on the Cutline Contact

Below, please find the latest High-Volume ETF Cutline report, which shows how far above or below their respective long-term trend lines (39-week SMA) my currently tracked ETFs are positioned.

This report covers the HV ETF Master List from Thursday’s StatSheet and includes 312 High Volume ETFs, defined as those with an average daily volume of more than $5 million, of which currently 250 (last week 260) are hovering in bullish territory. The yellow line separates those ETFs that are positioned above their trend line (%M/A) from those that have dropped below it.

Take a look:                                                                   

The HV ETF Master Cutline Report

In case you are not familiar with some of the terminology used in the reports, please read the Glossary of Terms. If you missed the original post about the Cutline approach, you can read it here.      

ETF Tracker Newsletter For August 6, 2021

Ulli ETF Tracker Contact

ETF Tracker StatSheet          

You can view the latest version here.

JOBS REPORT BOOSTS MAJOR INDEXES

[Chart courtesy of MarketWatch.com]

  1. Moving the markets

A stronger-than-expected jobs report pushed the Dow and S&P 500 into record territory, while the Nasdaq faded and never made it into the green, as traders favored stocks that could benefit from faster economic growth.

The jobs report showed that 943k jobs were added in July, which was higher than the 845k expected. The unemployment rate dipped to 5.4%, below the estimate of 5.7%. Again, the headline number was all that mattered, although the old theme prevailed under the hood in that leisure and hospitality jobs (+380k) were more than half of the total, while another 261k came from the education sector.

ZeroHedge reported that there are now more job openings than unemployed workers, and small business owners continue to struggle to find qualified workers for their open positions.

Weakness in “Growth” and strength in “Value” was the meme of the day, however, both ended up some 0.9% for the week. Financials benefitted as well due to the rise in yields, with XLF gaining a solid 2.02% on the day.

The 10-year bond yield completed its cycle by first plunging to July 20th lows and then spiking to July 21st highs, a kind of bond roller coaster we don’t witness very often. The US Dollar index ripped higher on the back of increased yields and, as a result, sent Gold packing and back below its hard fought for $1,800 level. The precious metal surrendered 2.48% on the day.

After this jobs report, the question is whether the Fed will see this improvement as a reason to make a formal tapering announcement in November, the probability of which is 25% (up from 20%) and 55% that it will happen in December.

Read More

Weekly StatSheet For The ETF Tracker Newsletter – Updated Through 08/05/2021

Ulli ETF StatSheet Contact

ETF Data updated through Thursday, August 5, 2021

Methodology/Use of this StatSheet:

1. From the universe of over 1,800 ETFs, I have selected only those with a trading volume of over $5 million per day (HV ETFs), so that liquidity and a small bid/ask spread are assured.

2. Trend Tracking Indexes (TTIs)

Buy or Sell decisions for Domestic and International ETFs (section 1 and 2), are made based on the respective TTI and its position either above or below its long-term M/A (Moving Average). A crossing of the trend line from below accompanied by some staying power above constitutes a “Buy” signal. Conversely, a clear break below the line constitutes a “Sell” signal. Additionally, I use an 8% trailing stop loss on all positions in these categories to control downside risk.

3. All other investment arenas do not have a TTI and should be traded based on the position of the individual ETF relative to its own respective trend line (%M/A). That’s why those signals are referred to as a “Selective Buy.” In other words, if an ETF crosses its own trendline to the upside, a “Buy” signal is generated. Since these areas tend to be more volatile, I recommend a wider trailing sell stop of 8%-10% depending on your risk tolerance.

If you are unfamiliar with some of the terminology, please see Glossary of Terms and new subscriber information in section 9.     

1. DOMESTIC EQUITY ETFs: BUY — since 07/22/2020

Click on chart to enlarge

Our main directional indicator, the Domestic Trend Tracking Index (TTI-green line in the above chart) has now rallied above its long-term trend line (red) by +10.84% and remains in “BUY” mode as posted.

Read More

Bond Rollercoaster Punishes Equities

Ulli Market Commentary Contact

[Chart courtesy of MarketWatch.com]

  1. Moving the markets

A variety of factors combined to knock down equities with the 10-year bond yield getting whacked around like a rubber ball in a trampoline factory.

First, General Motors dropped some 7%, which weighed heavily on the broad market as the automaker missed earnings expectations, but it managed to issue a positive guidance for the remainder of the year.

Second, in economic news, the private ADP payroll survey confirmed a weakening environment with a meager gain of only 330k jobs for July vs. expectations of 653k. This could be a harbinger of things to come when the Labor Department’s official jobs report will be posted on Friday. However, at times, one report is not indicative of the other.

Third, an early short squeeze in the bond market set up a negative tone with the 10-year yield dipping to below 1.13%, after which all hell broke loose. The cause was remarks from Fed Vice Chair Richard Clarida opining that “the Fed may be much closer to tightening than last week’s FOMC release implied.”

Ouch, no one saw that one coming and bond yields responded to that much hawkishness by spiking straight up to almost 1.19% before easing back to 1.16%, as this chart shows.

The US Dollar index first dumped to 6-week lows and then pumped on Clarida’s hawkish remarks. Gold followed suit and rode its own rollercoaster and ended up slightly in the green. Despite this wild ride, the losses for the major indexes were moderate with the Nasdaq escaping unscathed.

Observing equity reaction to even the slightest hint of rising bond yields just goes to show the market’s total dependence on low rates/yields. Unfortunately, yields will have to go up at some point, as rising rates will be the only tool available to deal with the ever-increasing inflationary threat.

If you were around in 1980, you’ll recall that this is how then Fed Chairman Volker reigned in the crisis. And no, this time will not be different.  

Read More

From Zero To Hero

Ulli Market Commentary Contact

[Chart courtesy of MarketWatch.com]

  1. Moving the markets

A sloppy opening and quick pullback put the major indexes on the defensive with all three of them sinking into the red. It was a reversal from yesterday’s action when an early pump turned into a late dump.

Bond yields proved to be the stabilizing factor with 10-year yields rebounding from Monday’s drop to nearly five-month lows, which was repeated early this morning, and giving stocks a good enough reason to follow suit. Remember, that sliding bond yields indicate economic weakness, while rising ones, within reason, account for economic expansion.

Factory orders printed better-than-expected and lent support to the theme that the economy is still in expansion mode, at least for this day. Lately, econ reports paint at best a mixed picture, which is why we are seeing some of these extreme moves in the markets.

The US Dollar bounced off its lows and, together with rising bond yields, kept gold in check with the precious metal ETF GLD closing just about unchanged.

The ongoing battle between Small Caps (VBK) and “value” (RPV) was clearly won by the latter with a solid gain of +1.37%, while the former barely stayed in the green.

August started the month with two opposite trading days and increased volatility, as the latest headline news continues to be the dominating factor for market direction.

Read More