
- Moving the markets
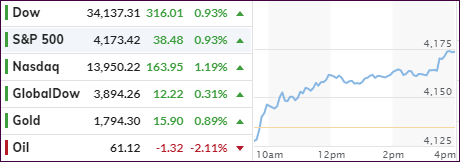
The futures already pointed to a reversal, with the S&P switching from red to green, which continued into the regular session, as all three major indexes attempted to wipe out the losses of the past two days.
As the chart above shows, there was no hesitation nor any looking back with the bulls clearly being in charge driving the indexes out of their recent doldrums. The Nasdaq lagged for a while, as Netflix proved to be a drag with an 8% plunge, but in the end, the index picked up speed and led the majors with a 1.19% advance.
SmallCaps came back from hibernation with VBK recovering 2.04%, which was closely followed by our value play, RPV, which added a solid 1.94%. Even the equally weighted S&P index (RSP) outperformed its Large Cap SPY cousin with an increase of 1.31% vs. 0.92%.
So far, the earnings season has been touted a success with companies delivering solid quarterly results, however, most analysts are now focused on the outlook of companies willing to make any forecasts.
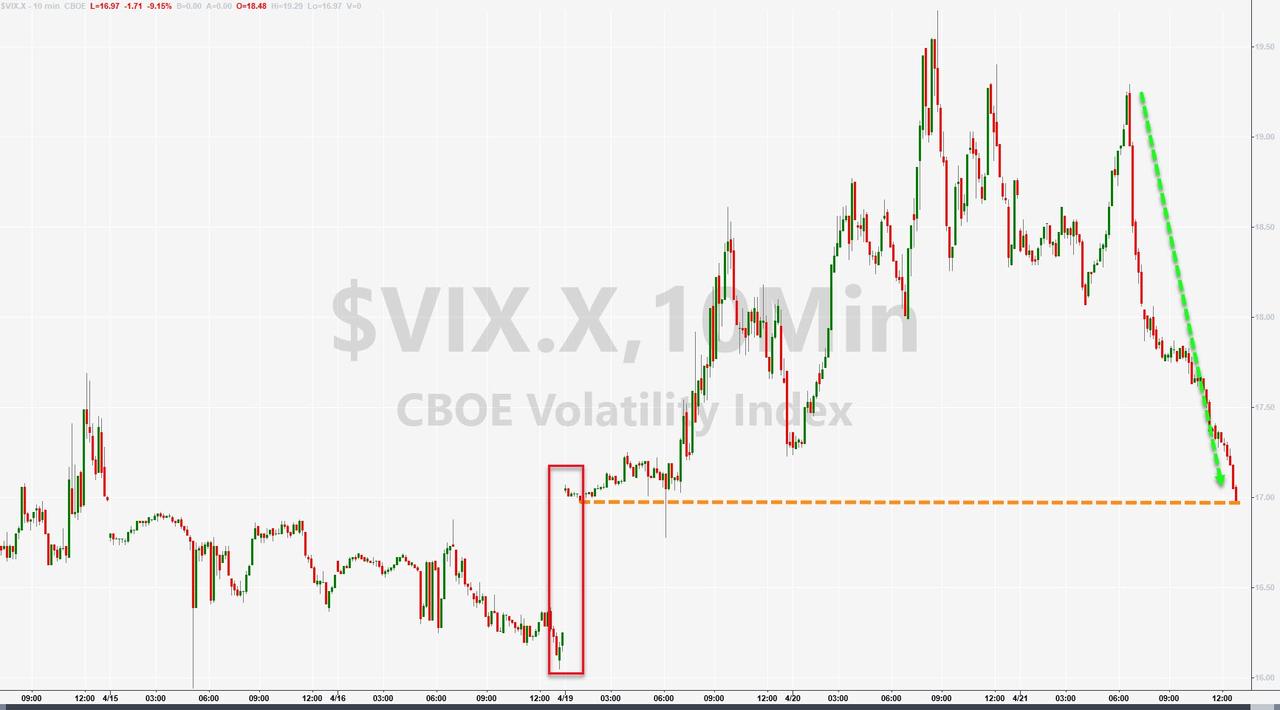
More than 70 S&P 500 companies have reported so far, according to CNBC, and they have on average posted a 23% upside to analysts’ earnings expectations. The volatility index (VIX), which rises when markets fall, dropped after advancing two days in a row, as all was calm in the trading community today.
Sure, there are always things to worry about, like the course of Covid, inflation concerns, debts and deficits, and the occasional earnings miss. But, right now, the bulls appear to have the upper hand, and major trends continue to be higher with new ATHs being made almost weekly.
2. ETFs in the Spotlight
In case you missed the announcement and description of this section, you can read it here again.
It features some of the 10 broadly diversified domestic and sector ETFs from my HighVolume list as posted every Saturday. Furthermore, they are screened for the lowest MaxDD% number meaning they have been showing better resistance to temporary sell offs than all others over the past year.
The below table simply demonstrates the magnitude with which these ETFs are fluctuating above or below their respective individual trend lines (%+/-M/A). A break below, represented by a negative number, shows weakness, while a break above, represented by a positive percentage, shows strength.
For hundreds of ETF choices, be sure to reference Thursday’s StatSheet.
For this current domestic “Buy” cycle, here’s how some our candidates have fared:
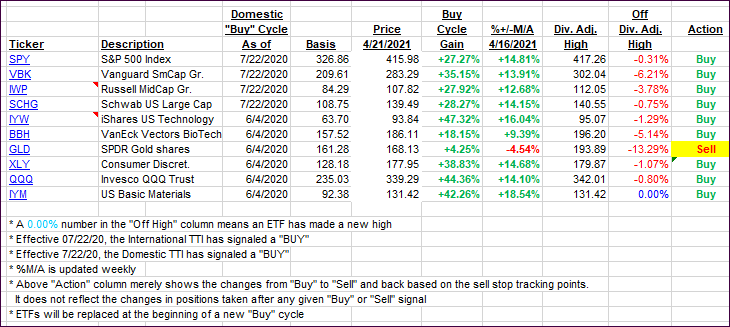
Click image to enlarge.
Again, the %+/-M/A column above shows the position of the various ETFs in relation to their respective long-term trend lines, while the trailing sell stops are being tracked in the “Off High” column. The “Action” column will signal a “Sell” once the -8% point has been taken out in the “Off High” column. For more volatile sector ETFs, the trigger point is -10%.
3. Trend Tracking Indexes (TTIs)
Our TTIs rallied with especially the Domestic one benefiting from today’s broad advance.
This is how we closed 4/21/2021:
Domestic TTI: +20.08% above its M/A (prior close +18.51%)—Buy signal effective 07/22/2020.
International TTI: +15.58% above its M/A (prior close +15.14%)—Buy signals effective 07/22/2020.
Disclosure: I am obliged to inform you that I, as well as my advisory clients, own some of the ETFs listed in the above table. Furthermore, they do not represent a specific investment recommendation for you, they merely show which ETFs from the universe I track are falling within the specified guidelines.
Contact Ulli