
- Moving the markets
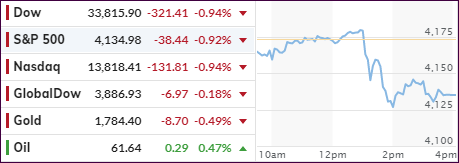
A weak opening reversed quickly, as the major indexes found enough mojo to reclaim their respective unchanged lines. That is until news struck fear in the hearts of traders because of the Biden Administration’s plan for the capital gains tax to be almost doubled.
Via ZH, Bloomberg explained it this way:
The plan would boost the capital gains rate to 39.6% for those earning $1 million or more, an increase from the current base rate of 20%, the people said on the condition of anonymity because the plan is not yet public.
A 3.8% tax on investment income that funds Obamacare would be kept in place, pushing the tax rate on returns on financial assets higher than the top rate on wage and salary income, they said.
The proposal could reverse a long-standing provision of the tax code that taxes returns on investment lower than on labor. Biden campaigned on equalizing the capital gains and income tax rates for wealthy individuals, saying it’s unfair that many of them pay lower rates than middle-class workers.
For $1 million earners in high-tax states, rates on capital gains could be above 50%.
For New Yorkers, the combined state and federal capital gains rate could be as high as 52.22%. For Californians, it could be 56.7%.
Ouch! However, things could get even worse, if this change would be made retroactively for 2021, thereby giving no one with a taxable account a chance to cash out at the current lower rate.
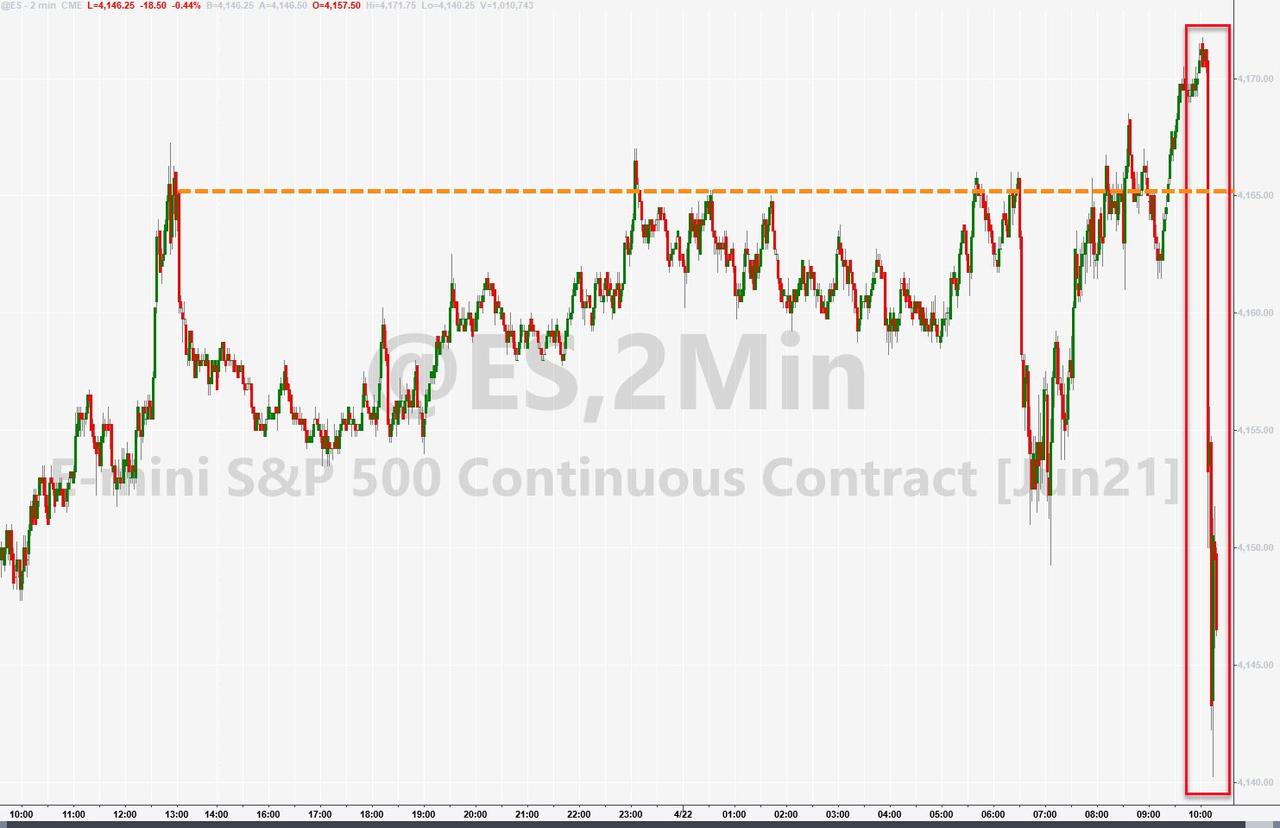
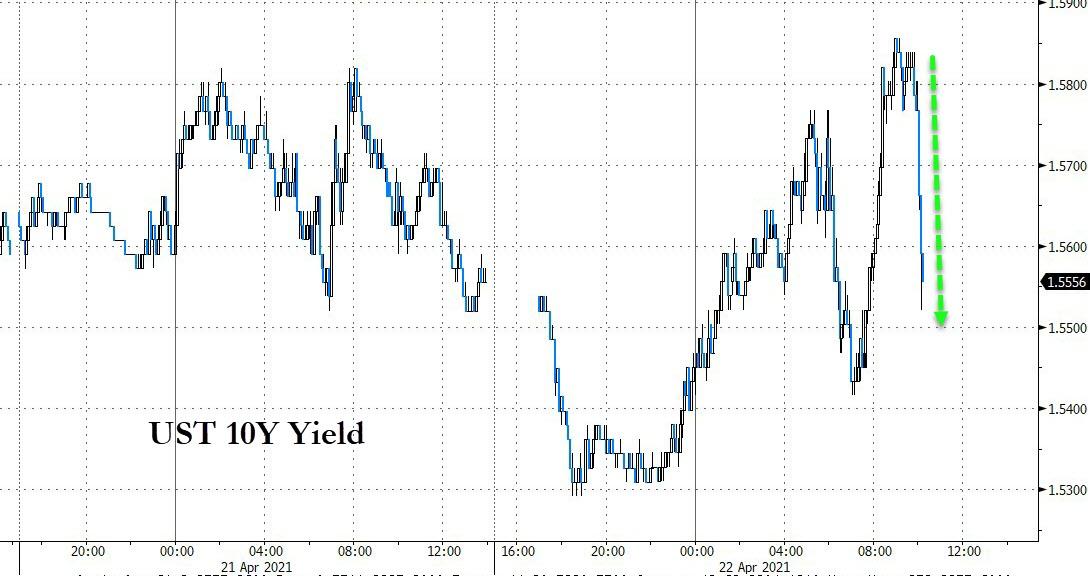
Needless to say, markets reversed instantly with all major indexes puking with the Dow shedding 300 points within seconds. Benefiting were bonds, which rallied as yields dropped.
For sure, uncertainty has risen a notch, but it is unclear whether this proposal can be passed in its present form, but it indicates that future policies may a lot less market friendly than what we’ve seen in the past.
It remains to be seen if more market fallout is to come, although the bounce in the last hour can be seen as a positive.
2. ETFs in the Spotlight
In case you missed the announcement and description of this section, you can read it here again.
It features some of the 10 broadly diversified domestic and sector ETFs from my HighVolume list as posted every Saturday. Furthermore, they are screened for the lowest MaxDD% number meaning they have been showing better resistance to temporary sell offs than all others over the past year.
The below table simply demonstrates the magnitude with which these ETFs are fluctuating above or below their respective individual trend lines (%+/-M/A). A break below, represented by a negative number, shows weakness, while a break above, represented by a positive percentage, shows strength.
For hundreds of ETF choices, be sure to reference Thursday’s StatSheet.
For this current domestic “Buy” cycle, here’s how some our candidates have fared:
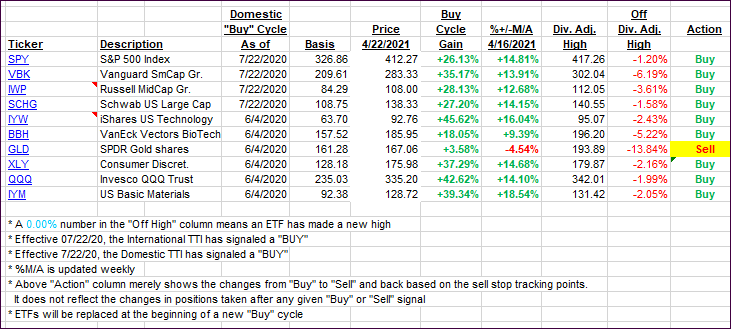
Click image to enlarge.
Again, the %+/-M/A column above shows the position of the various ETFs in relation to their respective long-term trend lines, while the trailing sell stops are being tracked in the “Off High” column. The “Action” column will signal a “Sell” once the -8% point has been taken out in the “Off High” column. For more volatile sector ETFs, the trigger point is -10%.
3. Trend Tracking Indexes (TTIs)
Our TTIs pulled back due to news about a doubling of the capital gains tax wreaking havoc with the markets.
This is how we closed 4/22/2021:
Domestic TTI: +19.32% above its M/A (prior close +20.08%)—Buy signal effective 07/22/2020.
International TTI: +15.36% above its M/A (prior close +15.58%)—Buy signals effective 07/22/2020.
Disclosure: I am obliged to inform you that I, as well as my advisory clients, own some of the ETFs listed in the above table. Furthermore, they do not represent a specific investment recommendation for you, they merely show which ETFs from the universe I track are falling within the specified guidelines.
Contact Ulli