
- Moving the markets
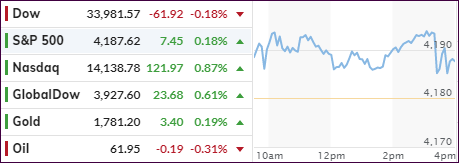
Ahead of a big earnings week, two of the three major indexes managed to eke out some gains, while the Dow slid slightly into the red due to the consumer staples sector retreating over 1%.
The cause was surging commodity prices, which increased inflation fears, as corn and copper, among others, reached their highest levels in some 10 years. Of course, the Fed does not see inflation anywhere, but those of us that regularly buy groceries, fuel up our cars and use energy in our daily lives, have already experienced some of its effects.
Noted CNBC:
Bank of America data showed the number of “inflation” mentions during earnings calls this reporting season has tripled compared to last year, the biggest jump since 2004 when the bank started tracking the number.
On the earnings front, about 1/3 of the S&P 500 companies are set to release their quarterly report cards. Some of the big hitters like Apple, Microsoft, Amazon, and Alphabet are on deck as well.
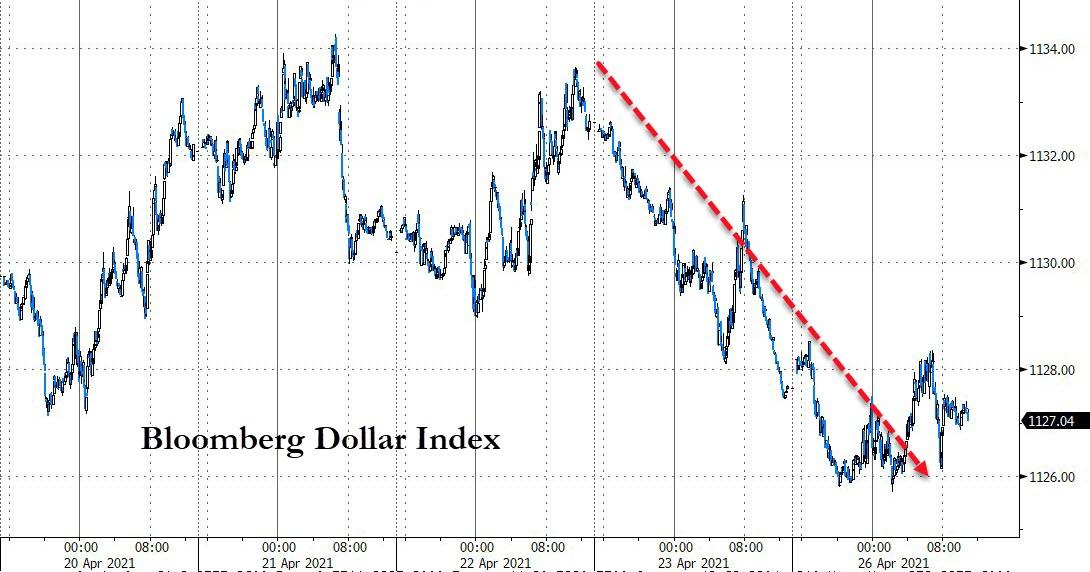
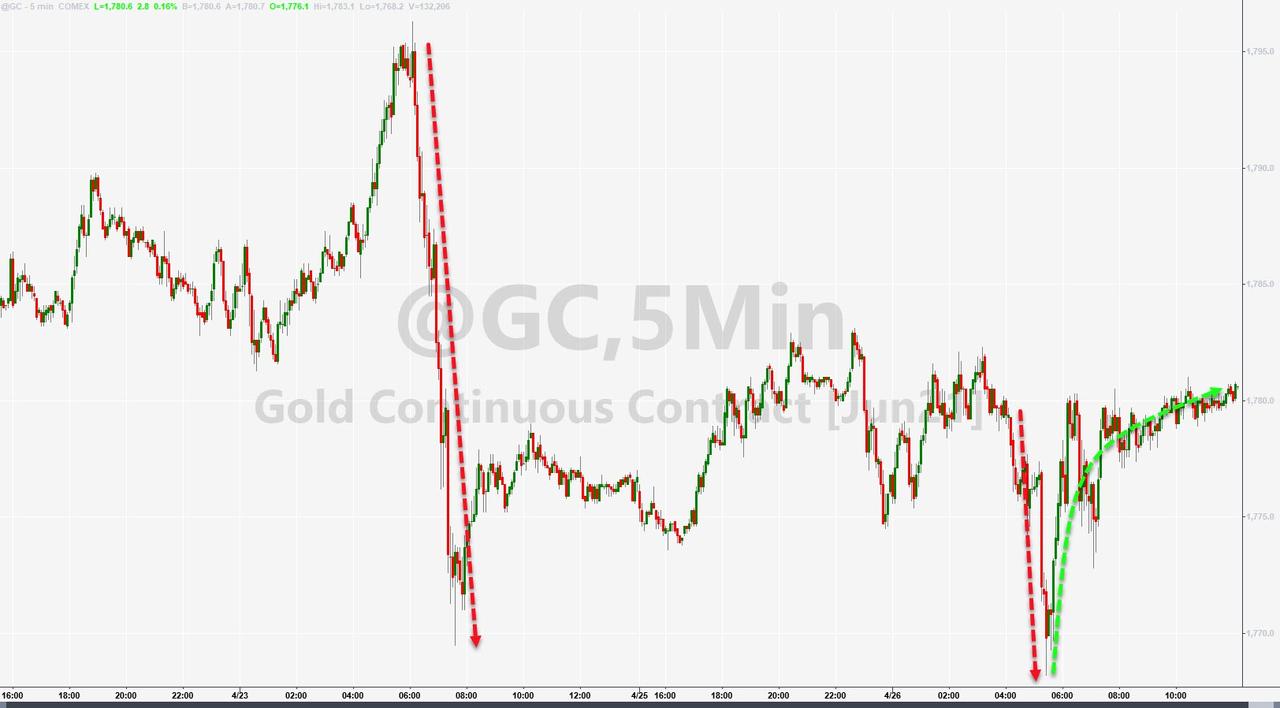
The US Dollar rode a roller coaster and ended slightly lower, but it was enough volatility to give Gold a minor boost. Despite the overall positive tone in equities, bond yields stayed in a tight range and ended the session basically unchanged.
The continued bullish bias in equities has been supported by the easiest Fed monetary policy ever, as ZH pointed to in the below chart by Bloomberg:
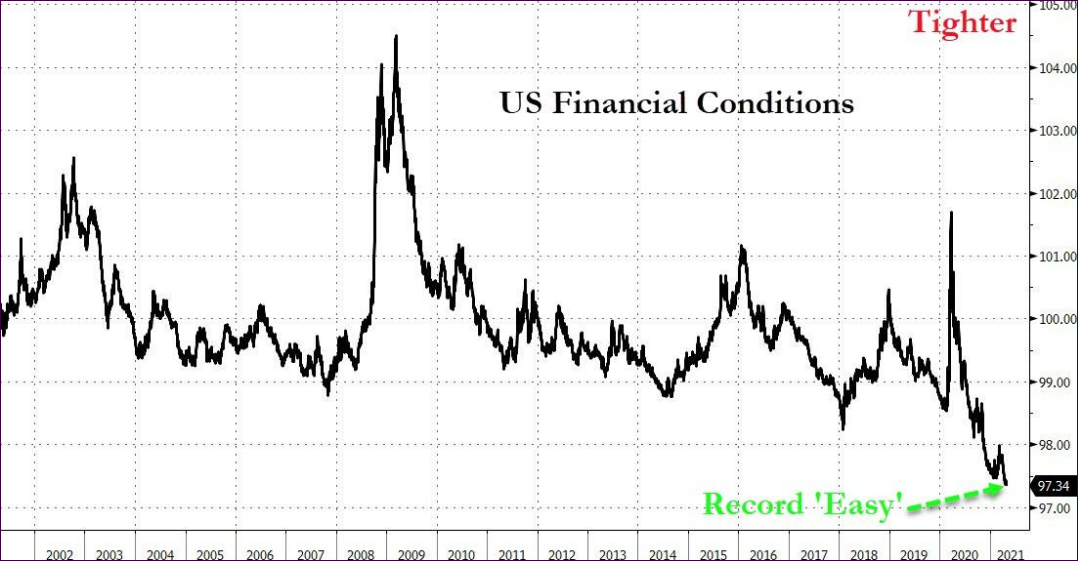
Makes me go “hmm.” How much longer can that go on?
2. ETFs in the Spotlight
In case you missed the announcement and description of this section, you can read it here again.
It features some of the 10 broadly diversified domestic and sector ETFs from my HighVolume list as posted every Saturday. Furthermore, they are screened for the lowest MaxDD% number meaning they have been showing better resistance to temporary sell offs than all others over the past year.
The below table simply demonstrates the magnitude with which these ETFs are fluctuating above or below their respective individual trend lines (%+/-M/A). A break below, represented by a negative number, shows weakness, while a break above, represented by a positive percentage, shows strength.
For hundreds of ETF choices, be sure to reference Thursday’s StatSheet.
For this current domestic “Buy” cycle, here’s how some our candidates have fared:
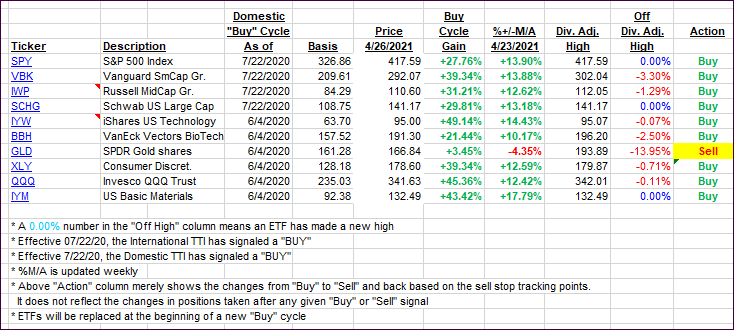
Click image to enlarge.
Again, the %+/-M/A column above shows the position of the various ETFs in relation to their respective long-term trend lines, while the trailing sell stops are being tracked in the “Off High” column. The “Action” column will signal a “Sell” once the -8% point has been taken out in the “Off High” column. For more volatile sector ETFs, the trigger point is -10%.
3. Trend Tracking Indexes (TTIs)
Our TTIs inched up a tad as trading was subdued due to the upcoming big earnings week.
This is how we closed 4/26/2021:
Domestic TTI: +19.73% above its M/A (prior close +19.53%)—Buy signal effective 07/22/2020.
International TTI: +15.73% above its M/A (prior close +15.20%)—Buy signals effective 07/22/2020.
Disclosure: I am obliged to inform you that I, as well as my advisory clients, own some of the ETFs listed in the above table. Furthermore, they do not represent a specific investment recommendation for you, they merely show which ETFs from the universe I track are falling within the specified guidelines.
Contact Ulli