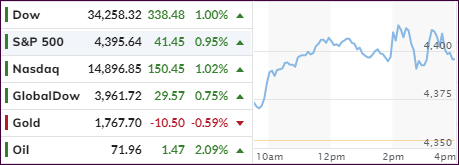
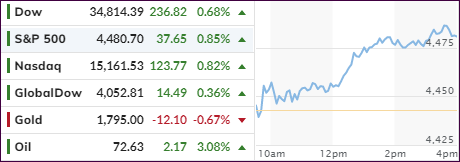
Despite the Fed’s (FOMC) most hawkish statement in 3 years, the markets took it as a positive and propelled the major indexes out of their recent doldrums, with all 3 of them advancing around 1% for the session.
Support for stocks came from the fact that the Fed will not initiate an immediate rollback of monetary stimulus, which has been a supporting actor to keep the markets elevated over the recent years.
The FOMC signaled a rate hike in 2022, with Fed head Powell noting that “tapering ending around mid-2022 may be appropriate.” That matched expectations that the start of taper might begin in December at a reduction of $15 billion per month, which means the actual announcement will be still forthcoming.
Added analyst Graham Summers:
By way of comparison, during the Fed’s last QE taper (that pertaining to QE 3 in 2017), the Fed reduced the pace of its then-QE program by $10 billion every THREE months, with the pace stopping at $30 billion per month.
Again, the current proposed tightening is much faster and aggressive than the last.
The big question is how the markets digest this. The last time the Fed attempted to taper a major QE program, it ultimately blew up the corporate debt markets resulting in stocks collapsing 20% in a matter of weeks.
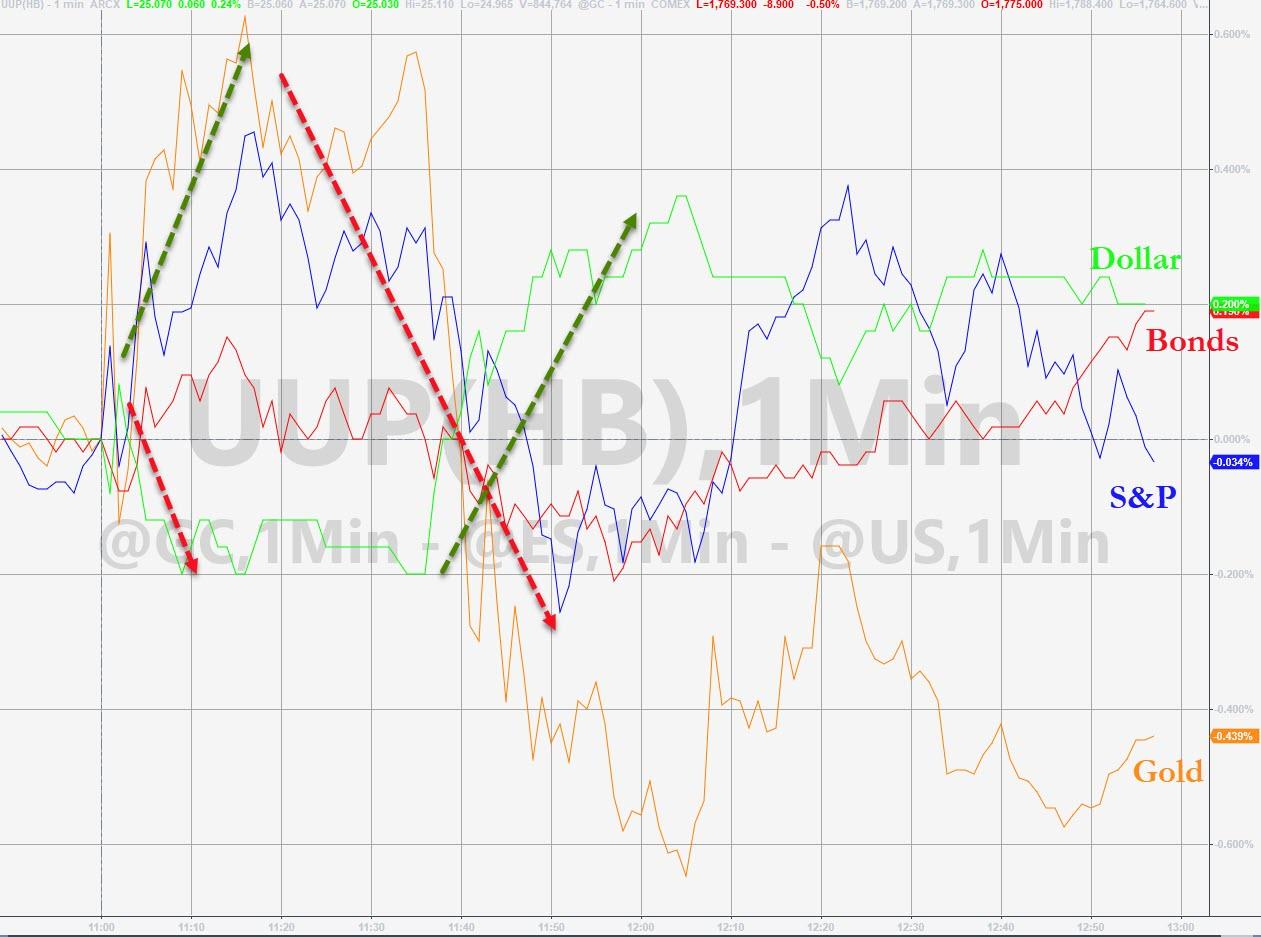
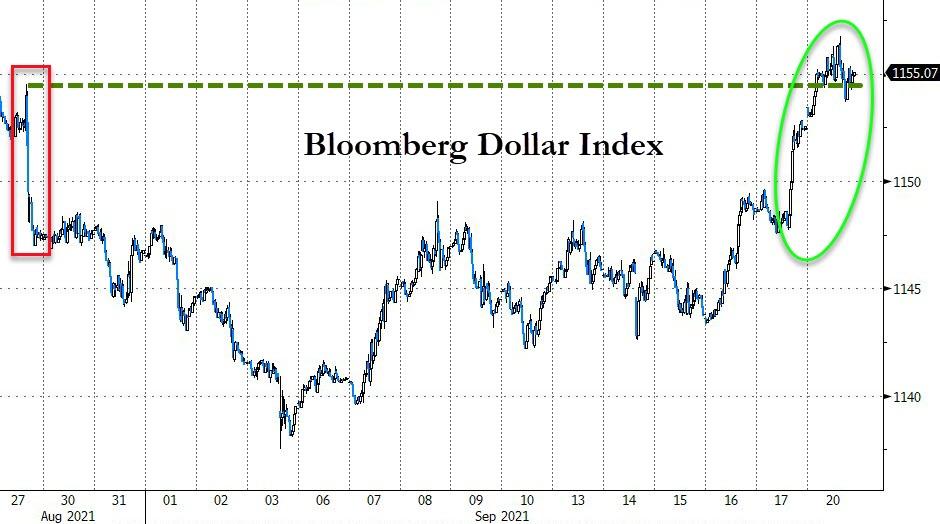
The market’s rise was interrupted by reversals, with equities coming off their highs, the US Dollar crawling out of an early hole and ramping higher, while gold lost its early shine and was dumped into the close.
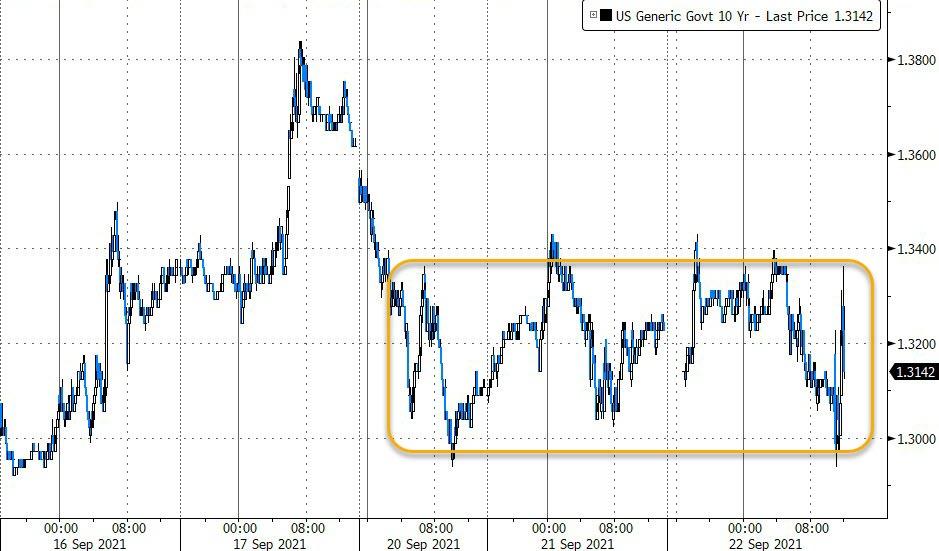
10-year bond yields bounced around aimlessly and remained stuck in their 3-day trading range.
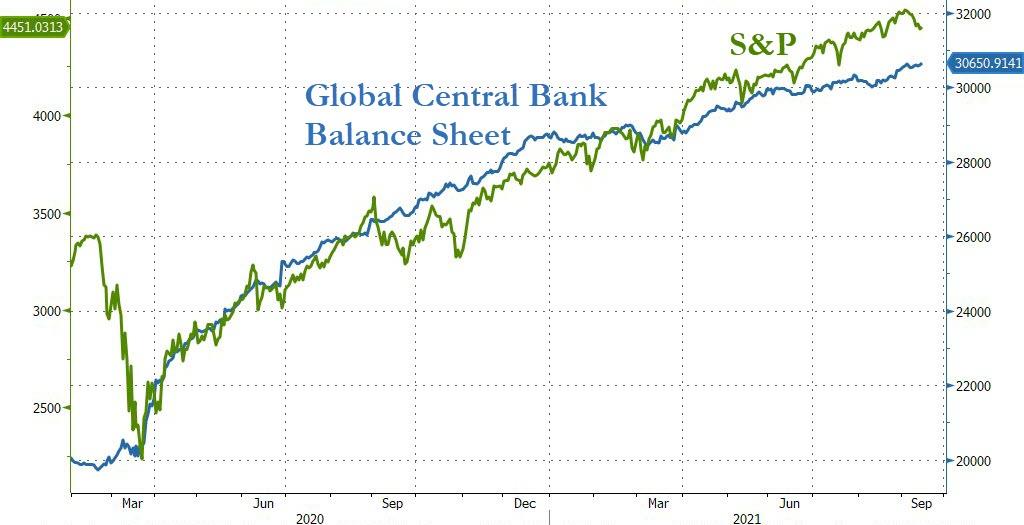
It was an interesting ride, but in the end reality comes down to the direction of the Fed’s balance sheet, no matter what the underlying economic conditions indicate, as Bloomberg demonstrates in this chart.
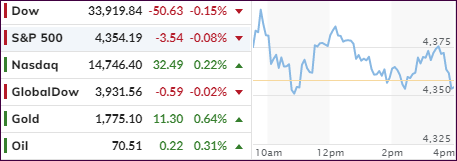
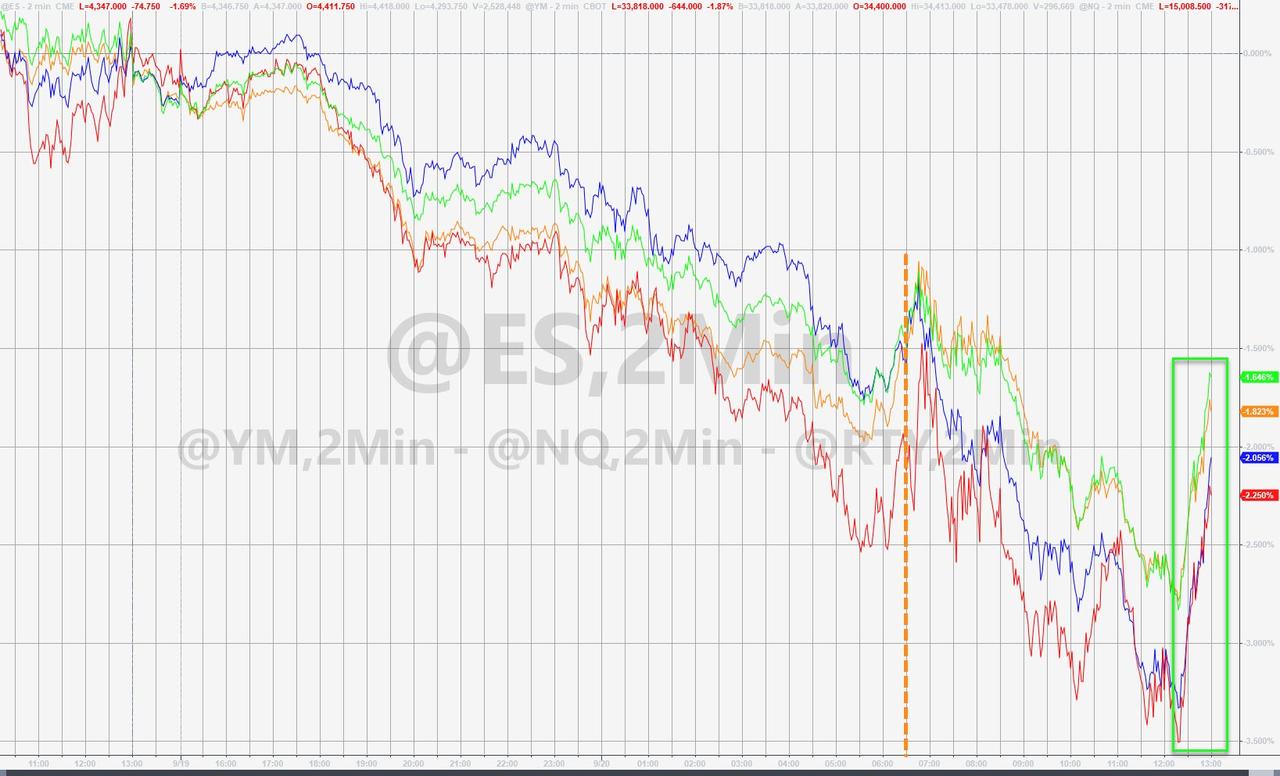
An early bounce, indicating dip buyers stepping in to take advantage of lower prices because of yesterday’s slam, ran out of steam with the major indexes lacking bullish conviction to turn this session into a turnaround Tuesday.
Despite valiant efforts, the Dow and the S&P 500 gave up all early gains and slipped slightly into the red, but the Nasdaq managed to buck the trend by closing marginally in the green.
In my advisor practice, we finally pulled the trigger and sold the value ETF RPV, which had been dancing around its trailing sell stop for quite some time and did not show any signs of life during the early rebound.
This ETF performed well early in the year but has lately been a disappointment. This move reduces some our equity exposure which, given current uncertainties, appears to be a wise choice. Once volatility dies down again, and we are moving into the seasonally strong part of the year, we will replace this empty spot with a more appropriate ETF.
All eyes were on the current Fed meeting with the results due out tomorrow. Traders are looking for Fed head Powell to reveal some of the Central Bank’s plans to taper its bond buying agenda, especially the timing of such. Also eagerly awaited are the quarterly economic forecasts along with a statement on interest rates.
ZeroHege posted an interesting take about tomorrow’s September 22nd:
As infamous market-seer, W.D. Gann once noted, September 22nd (the Autumnal Equinox) is the most important date in markets – when markets are more likely to reverse than any other day of the year. For some reason, stocks, commodities, and currencies have a curious tendency to make major tops or bottoms on this day.
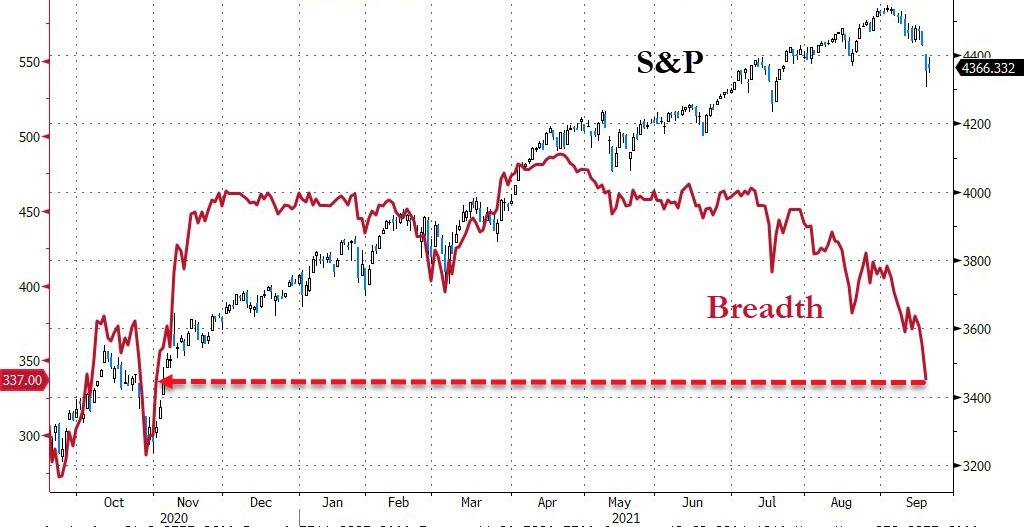
Today’s rebound was lacking breadth, which compares the number of stocks below their respective 200-day Moving Averages to the index, a picture that is worth a thousand words. This another reason why reduced equity exposure in these uncertain times is a good idea.
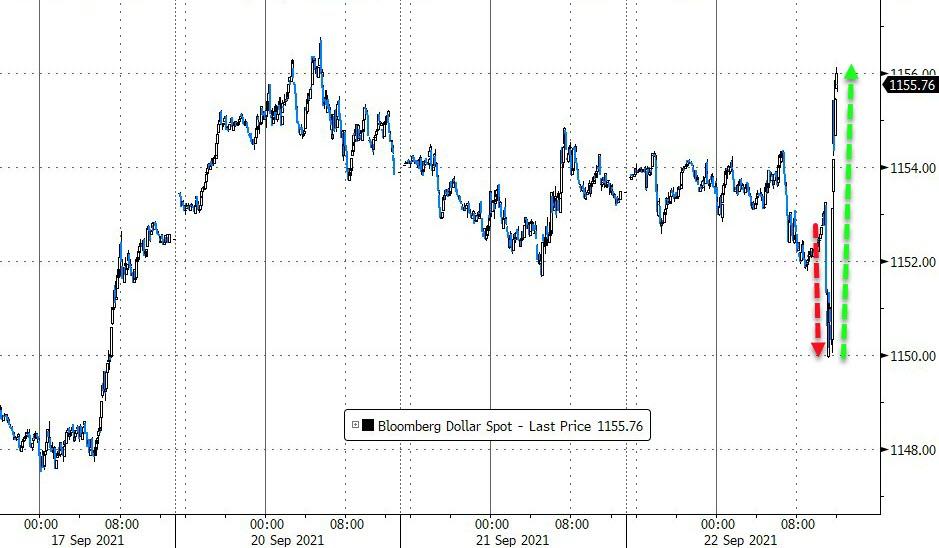
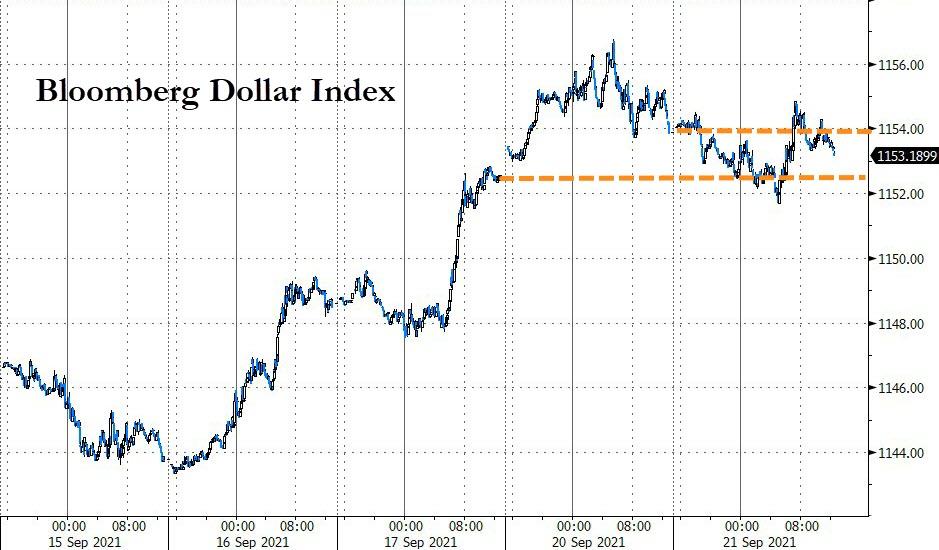
The US Dollar rode the roller coaster and ended just about unchanged, while bond yields edged higher with the 10-year now back over 1.32%. Gold rose +0.64% and managed to be a haven of safety, at least for this day.
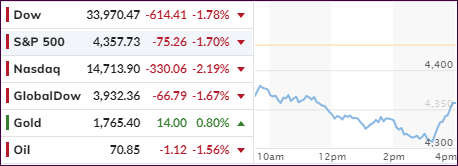
The market mantra of the past few weeks of “digging a hole and climbing out of it” failed miserably today, as dip buyers remained conspicuously absent thereby handing the directional baton to the bears.
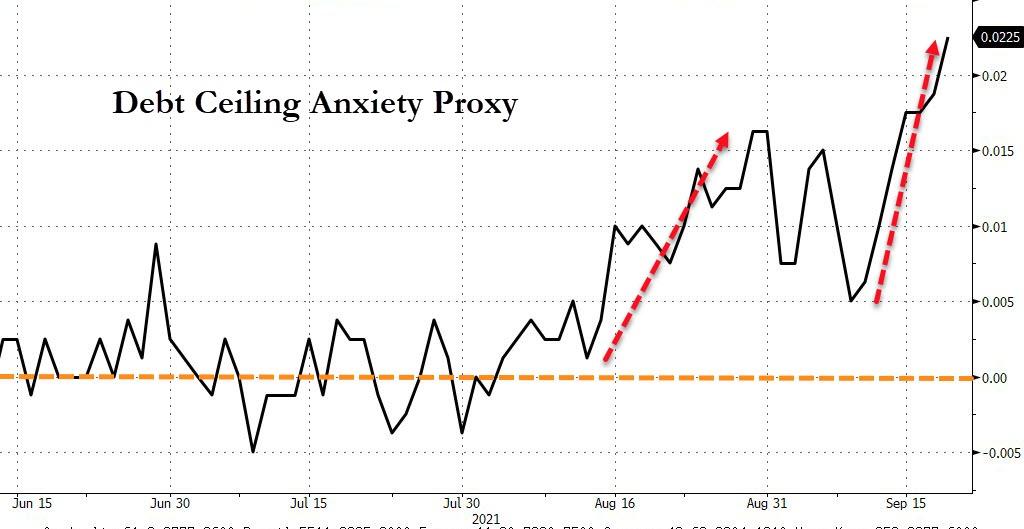
A host of factors combined forces to pull the markets down, including Delta troubles, Fed taper talk, the upcoming debt ceiling battle, seasonality in that the second half of September has been historically one of the worst periods for stocks, inflation fears, and the fact that we are way overdue for a correction if not the bursting of the bubble.
The latter only needed a pin prick, and that may have just occurred via the collapse of the Evergrande empire, a massive Chinese property developer with worldwide projects, which has become insolvent because of $300 billion in bad loans. Their stock plunged 80% YTD.
This story has been developing over the past week or so, with fears increasing that the cockroach theory may play out again in that there is never just one. While we don’t know the other names yet, contagion has already begun as a variety of Chinese construction/real estate ventures are collapsing and developers and industrial producers getting punished.
Some analysts have referred to Evergrande as being the next Lehman Brothers, the demise of which was instrumental in collapsing the financial markets in 2008.
All this uncertainty resulted in equities being hit, but it’s noteworthy that a last hour rebound prevented a worse outcome. It remains to be seen whether there is more downside to come, or if dip buyers will re-appear.
There were no winners, but as was to be expected bond yields dropped, and the US Dollar rode the range but closed about unchanged. Gold was the shining star by gaining +0.79%, which was one of the few green numbers on the computer screens.
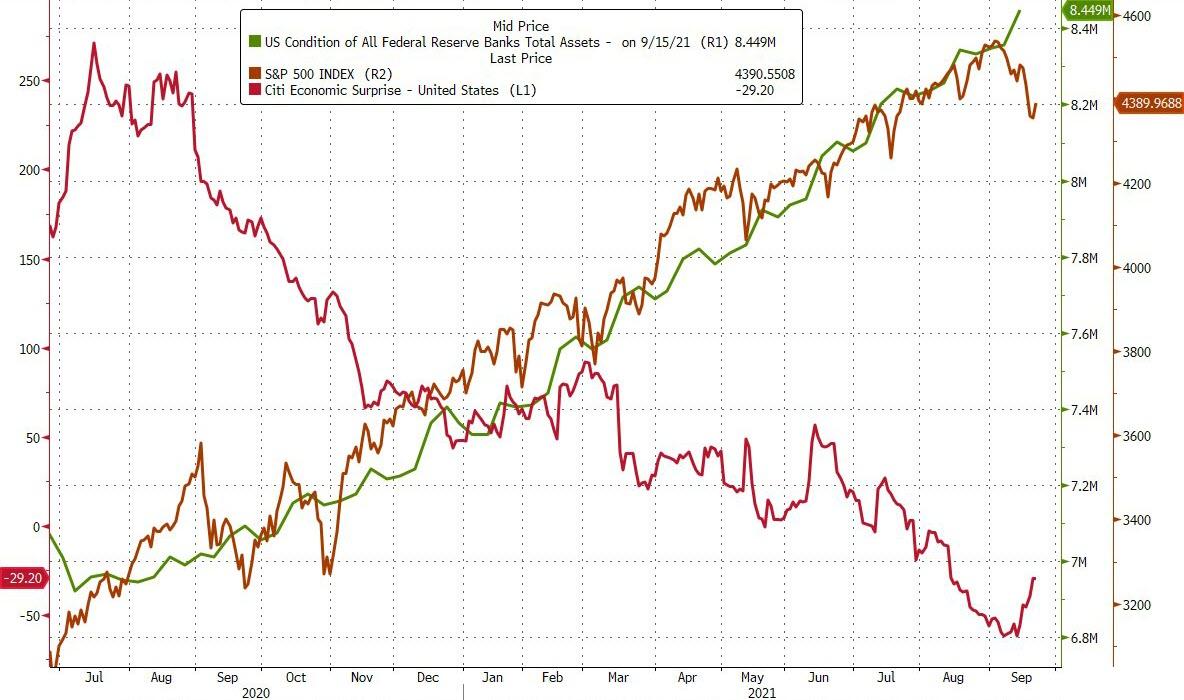
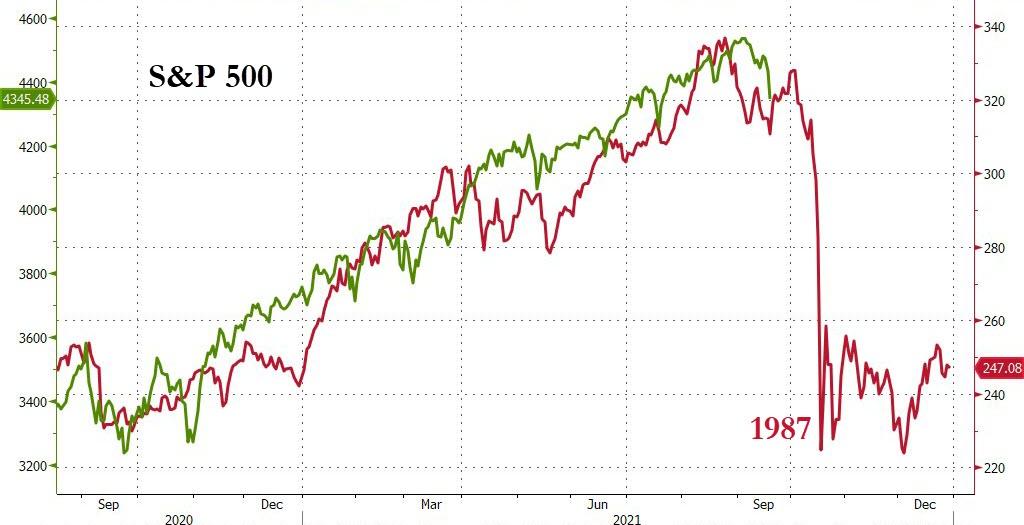
We have now reached a point where markets could break either way, meaning they could recover or the bubble might burst entirely, which brings up the interesting question as to whether history might repeat itself, as Bloomberg demonstrates in this chart.
That is why it’s critical to have an exit strategy in place designed to prevent the participation in the worst-case scenario. As you know, I use a combination of trailing sell stops and my Trend Tracking Indexes (TTIs). You can see their latest update in section 3 below.
My posting schedule for this week has slightly changed again and is updated here.
ETF Data updated through Thursday, September 16, 2021
Methodology/Use of this StatSheet:
1. From the universe of over 1,800 ETFs, I have selected only those with a trading volume of over $5 million per day (HV ETFs), so that liquidity and a small bid/ask spread are assured.
2. Trend Tracking Indexes (TTIs)
Buy or Sell decisions for Domestic and International ETFs (section 1 and 2), are made based on the respective TTI and its position either above or below its long-term M/A (Moving Average). A crossing of the trend line from below accompanied by some staying power above constitutes a “Buy” signal. Conversely, a clear break below the line constitutes a “Sell” signal. Additionally, I use an 8% trailing stop loss on all positions in these categories to control downside risk.
3. All other investment arenas do not have a TTI and should be traded based on the position of the individual ETF relative to its own respective trend line (%M/A). That’s why those signals are referred to as a “Selective Buy.” In other words, if an ETF crosses its own trendline to the upside, a “Buy” signal is generated. Since these areas tend to be more volatile, I recommend a wider trailing sell stop of 8%-10% depending on your risk tolerance.
If you are unfamiliar with some of the terminology, please see Glossary of Termsand new subscriber information in section 9.
1. DOMESTIC EQUITY ETFs: BUY— since 07/22/2020
Click on chart to enlarge
Our main directional indicator, the Domestic Trend Tracking Index (TTI-green line in the above chart) has now rallied above its long-term trend line (red) by +7.45% and remains in “BUY” mode as posted.
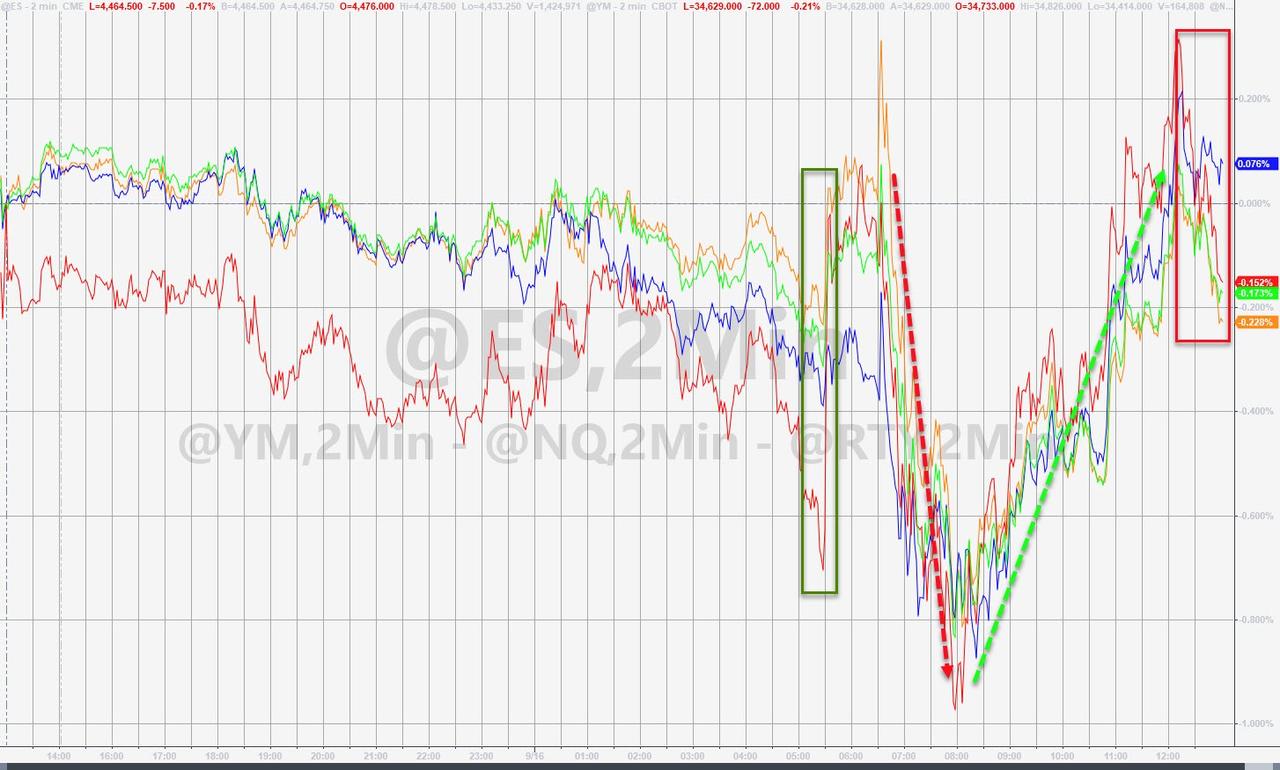
An early purge in the markets was met with a subsequent surge, which propelled the major indexes back to their respective unchanged lines, but only the Nasdaq managed to score a green close.
Retail sales surprised by rising 0.7% MoM, which was exactly the opposite of expectation of a 0.8% MoM drop. Helping this enormous “beat” was a revision of the initial July estimate from a gain to a decline, which makes the validity of this current number questionable.
Meanwhile, the latest weekly unemployment insurance data revealed that 332k first-time claims were filed, a slightly worse number than the 320k expected.
Still, uncertainty about a host of issues affect the markets, which one analyst described like this:
The stress factors facing the market have not materially changed, including the Delta variant, earnings headwinds from supply chain and labor challenges, fiscal and monetary tailwind shifting to headwinds and bubbling concerns around China.
Dip buyers could not resist and got today’s rebound started assisted by another short squeeze, the combination of which wiped out most of the early losses.
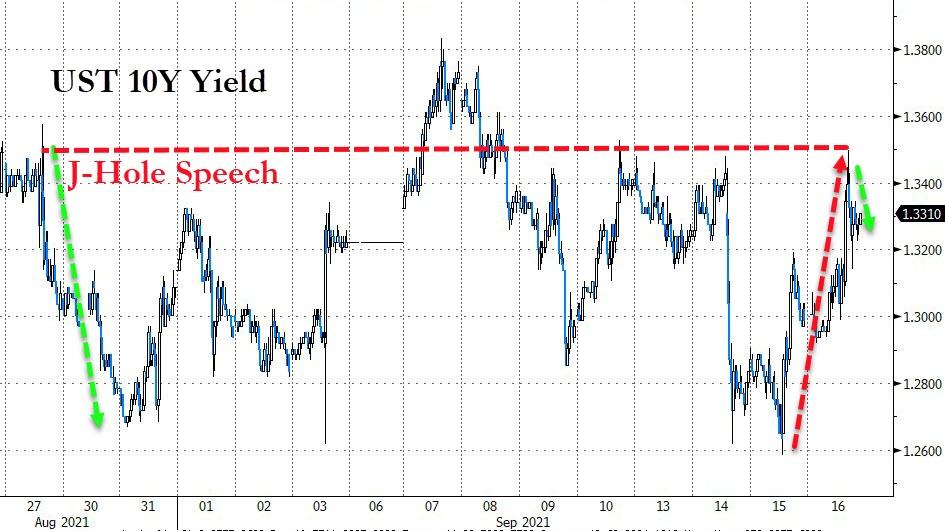
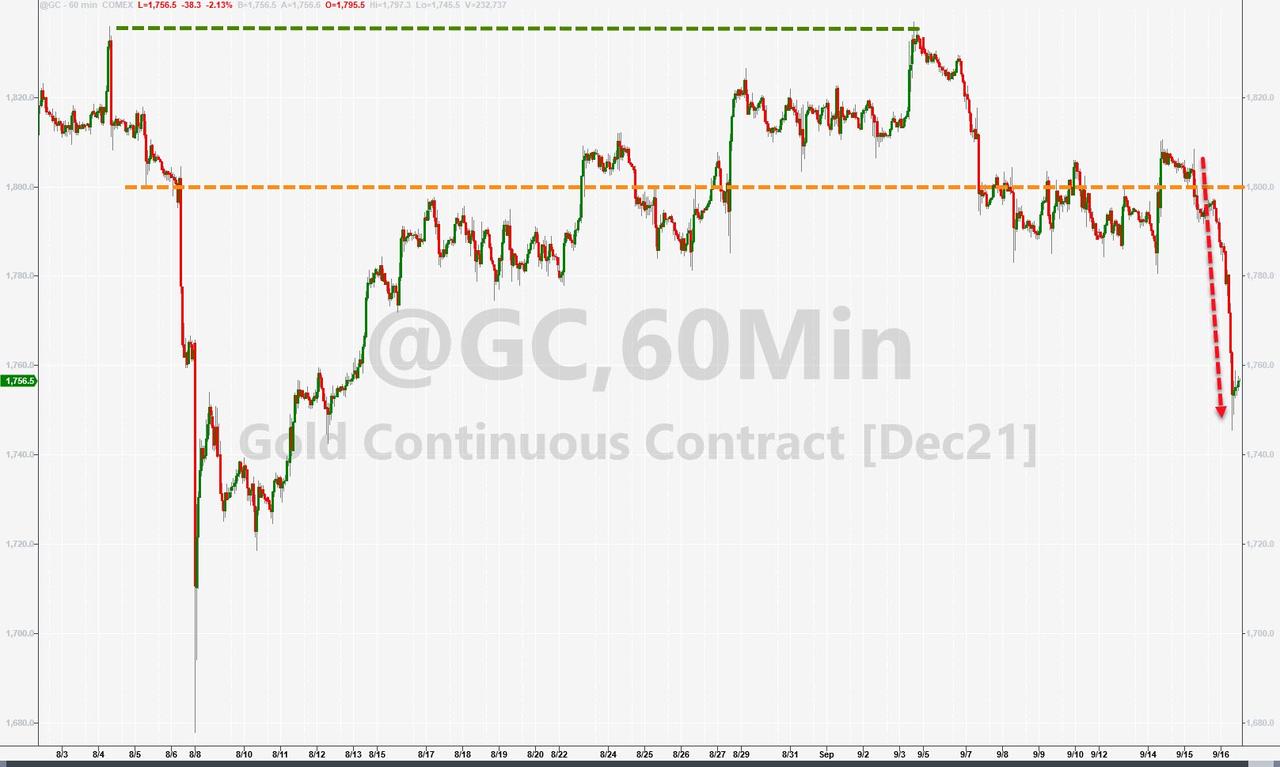
The US Dollar Index spiked, as did Bond yields with the 10-year reaching the 1.33% level. As a result, as we’ve seen many times before, this double punch sent Gold reeling and back below its $1,800 level.
As Bloomberg shows in this chart, the S&P 500 seems to have gotten ahead of reality, namely the Fed’s balance sheet expansion, so a pullback would be in order. It could happen tomorrow during quadruple witching hour, when a huge number of options will expire, which is an event that can wreak havoc with the markets.
As a reminder, I will be out tomorrow, so there will be no market commentary. My regular posting schedule will resume on Monday.
Continue reading…
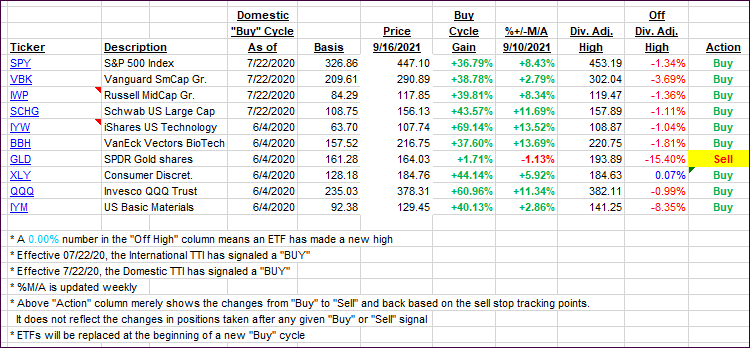
2. ETFs in the Spotlight
In case you missed the announcement and description of this section, you can read it here again.
It features some of the 10 broadly diversified domestic and sector ETFs from my HighVolume list as posted every Saturday. Furthermore, they are screened for the lowest MaxDD% number meaning they have been showing better resistance to temporary sell offs than all others over the past year.
The below table simply demonstrates the magnitude with which these ETFs are fluctuating above or below their respective individual trend lines (%+/-M/A). A break below, represented by a negative number, shows weakness, while a break above, represented by a positive percentage, shows strength.
For hundreds of ETF choices, be sure to reference Thursday’s StatSheet.
For this current domestic “Buy” cycle, here’s how some our candidates have fared:
Click image to enlarge.
Again, the %+/-M/A column above shows the position of the various ETFs in relation to their respective long-term trend lines, while the trailing sell stops are being tracked in the “Off High” column. The “Action” column will signal a “Sell” once the -8% point has been taken out in the “Off High” column. For more volatile sector ETFs, the trigger point is -10%.
3. Trend Tracking Indexes (TTIs)
Our TTIs pulled back a tad, as the major indexes dug themselves out of an early hole.
This is how we closed 09/16/2021:
Domestic TTI: +7.45% above its M/A (prior close +7.65%)—Buy signal effective 07/22/2020.
International TTI: +4.52% above its M/A (prior close +4.89%)—Buy signals effective 07/22/2020.
Disclosure: I am obliged to inform you that I, as well as my advisory clients, own some of the ETFs listed in the above table. Furthermore, they do not represent a specific investment recommendation for you, they merely show which ETFs from the universe I track are falling within the specified guidelines.
All linked charts above are courtesy of Bloomberg via ZeroHedge.
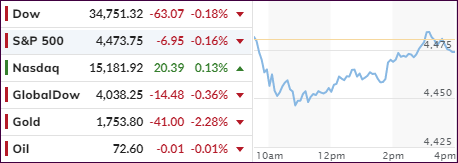
Despite a shaky start, the major indexes found support and managed to overcome the September doldrums, at least for this day. Bullish momentum surfaced with equities accelerating to the upside during the afternoon session, and all three indices closed the day with solid gains.
While the battle between Small Caps (VBK) and Value (RPV) continued unabated, both gained, but the latter outperformed the former by a 2:1 ratio. Helping to stabilize bullish sentiment early on was the Empire manufacturing index, which not only accelerated in August but also beat 18 consensus estimates.
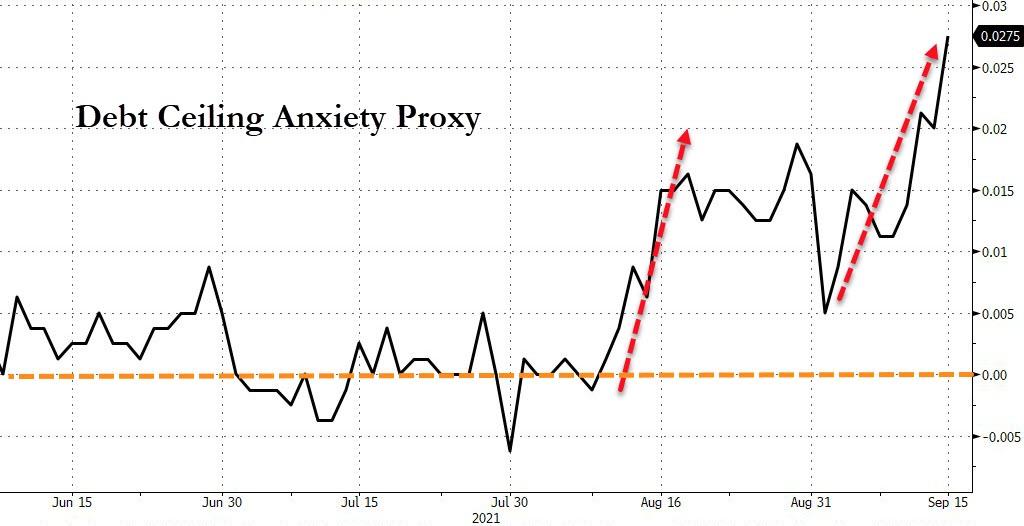
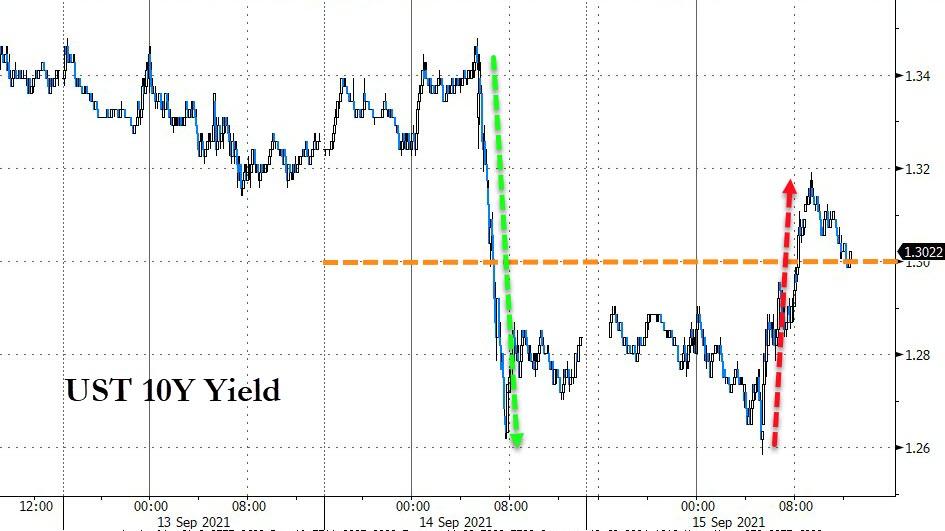
Anxiety about the upcoming Debt ceiling discussions, were moved to the front burner again, yet did not hamper equities but pulled the US Dollar lower, while pushing bond yields higher with the 10-year closing at the 1.3% level.
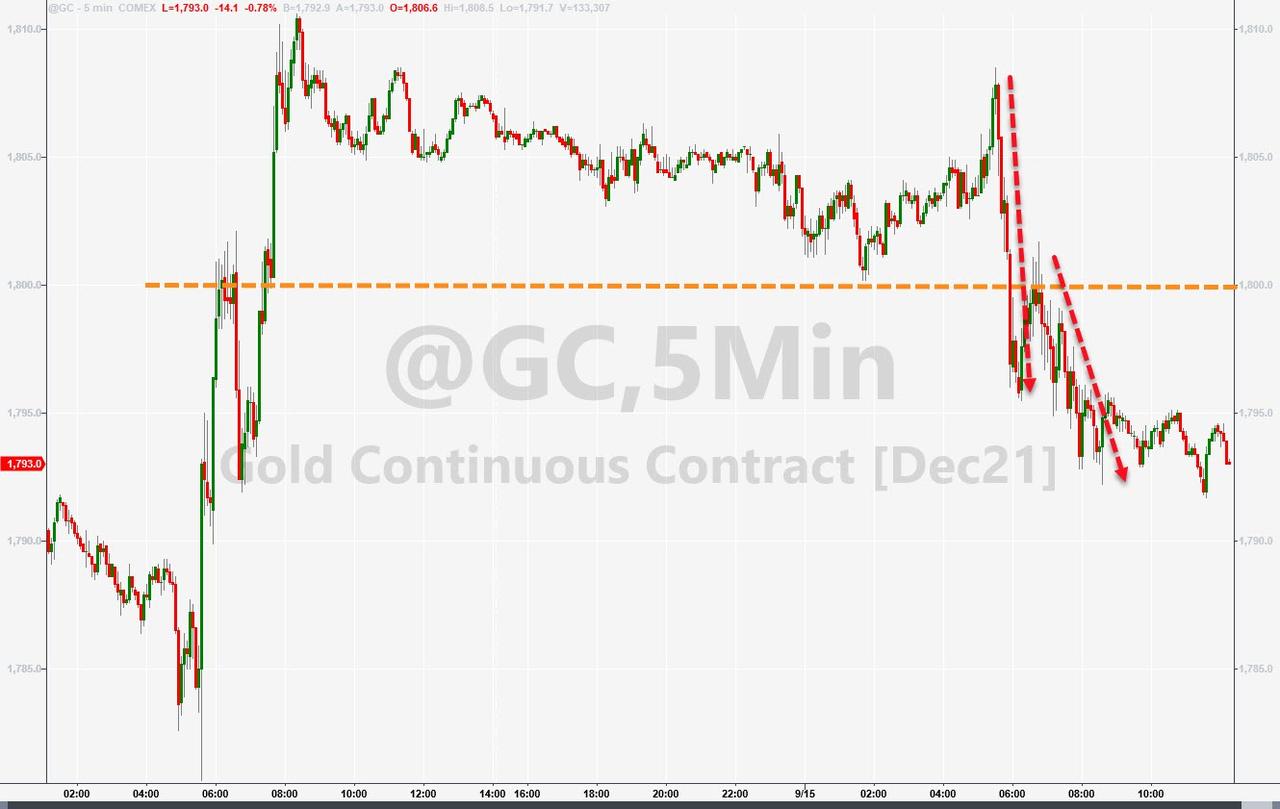
This combination did not work well for Gold, which slipped and lost its $1,800 level again.
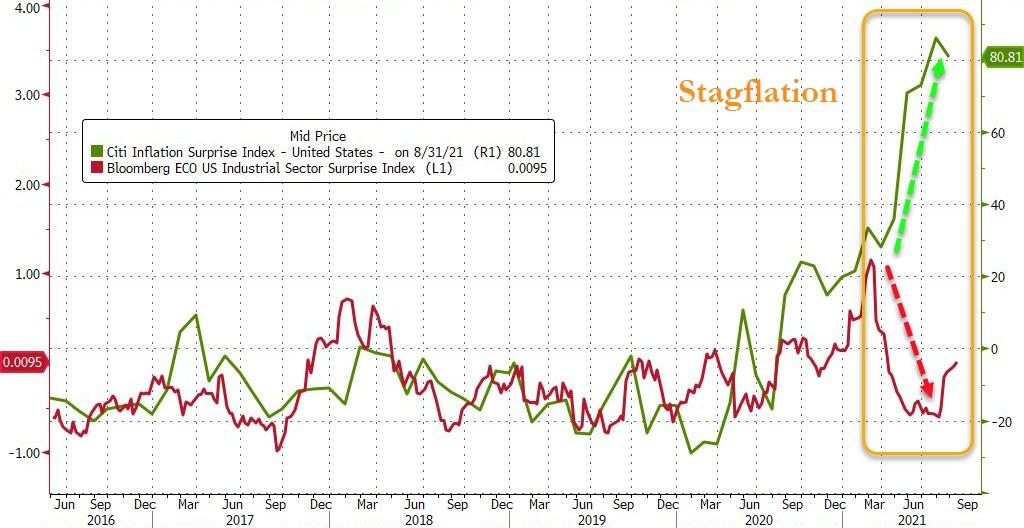
In the end, as Bloomberg charted here, inflation remains with us, with the Industrial Sector Surprise Index limping lower, which translates into the dreaded “S” word, namely Stagflation. Hmm, as Zero Hedge put it, that could be the Fed’s worst nightmare scenario.


