
- Moving the markets
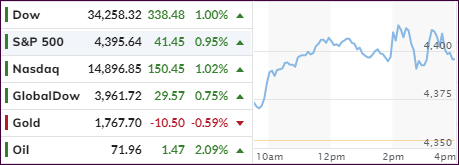
Despite the Fed’s (FOMC) most hawkish statement in 3 years, the markets took it as a positive and propelled the major indexes out of their recent doldrums, with all 3 of them advancing around 1% for the session.
Support for stocks came from the fact that the Fed will not initiate an immediate rollback of monetary stimulus, which has been a supporting actor to keep the markets elevated over the recent years.
The FOMC signaled a rate hike in 2022, with Fed head Powell noting that “tapering ending around mid-2022 may be appropriate.” That matched expectations that the start of taper might begin in December at a reduction of $15 billion per month, which means the actual announcement will be still forthcoming.
Added analyst Graham Summers:
By way of comparison, during the Fed’s last QE taper (that pertaining to QE 3 in 2017), the Fed reduced the pace of its then-QE program by $10 billion every THREE months, with the pace stopping at $30 billion per month.
Again, the current proposed tightening is much faster and aggressive than the last.
The big question is how the markets digest this. The last time the Fed attempted to taper a major QE program, it ultimately blew up the corporate debt markets resulting in stocks collapsing 20% in a matter of weeks.
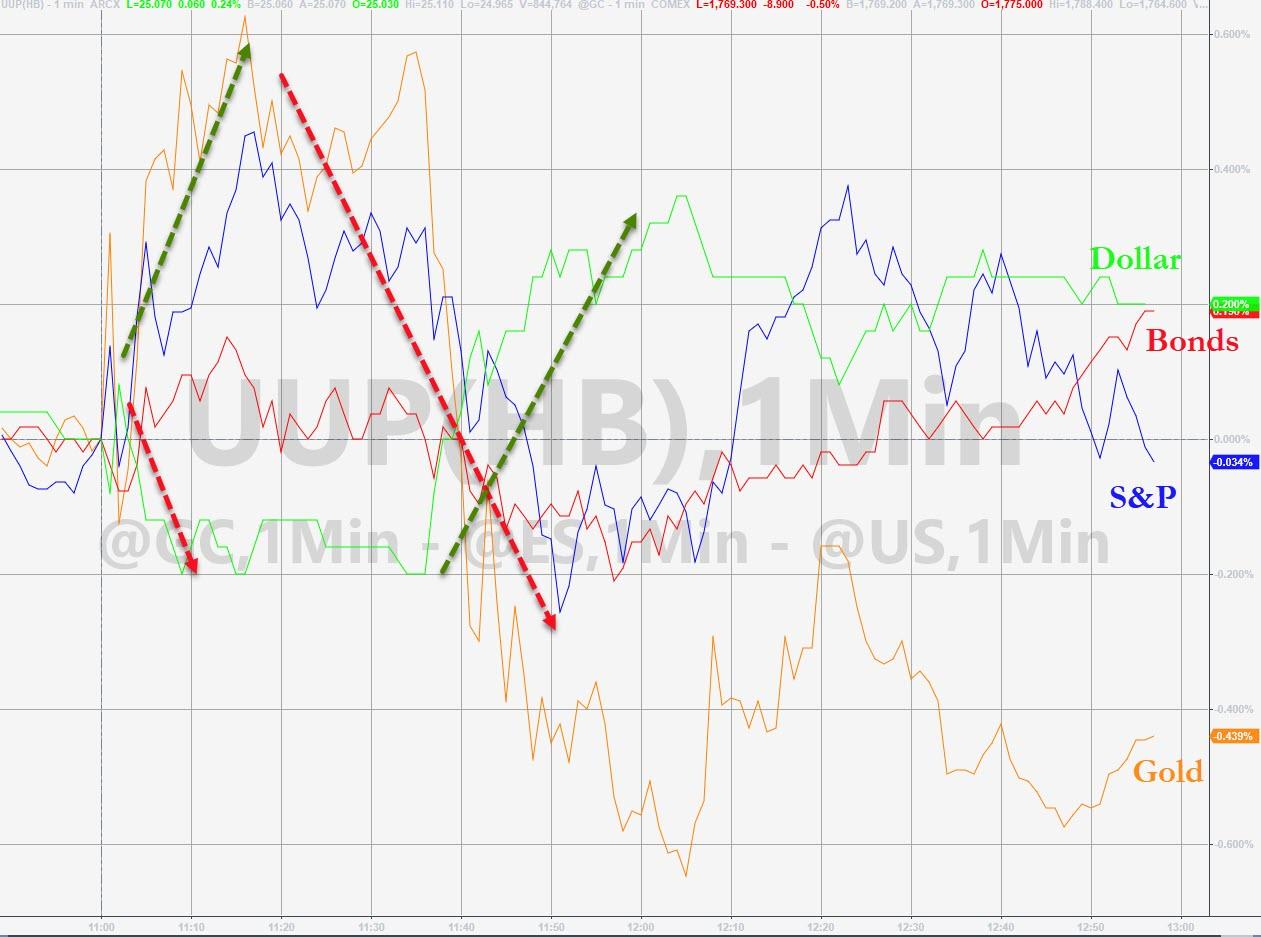
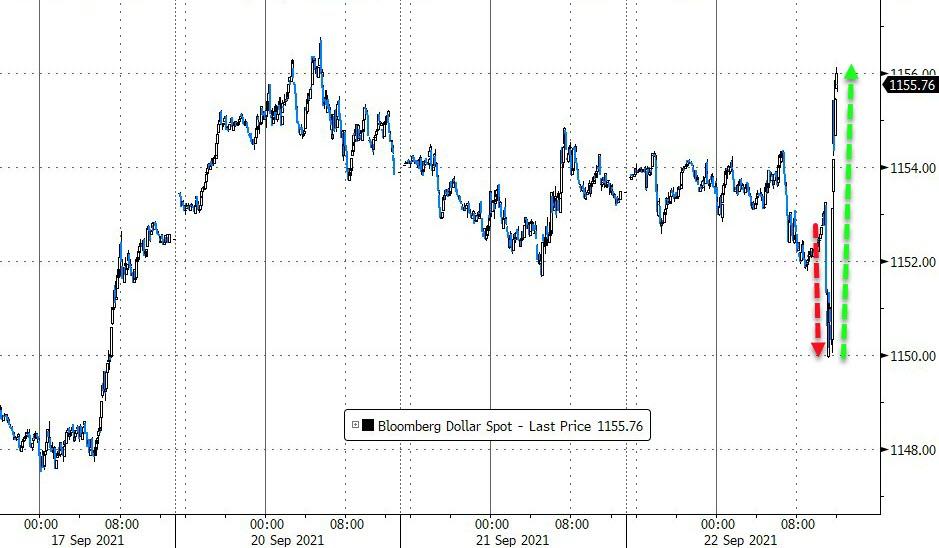
The market’s rise was interrupted by reversals, with equities coming off their highs, the US Dollar crawling out of an early hole and ramping higher, while gold lost its early shine and was dumped into the close.
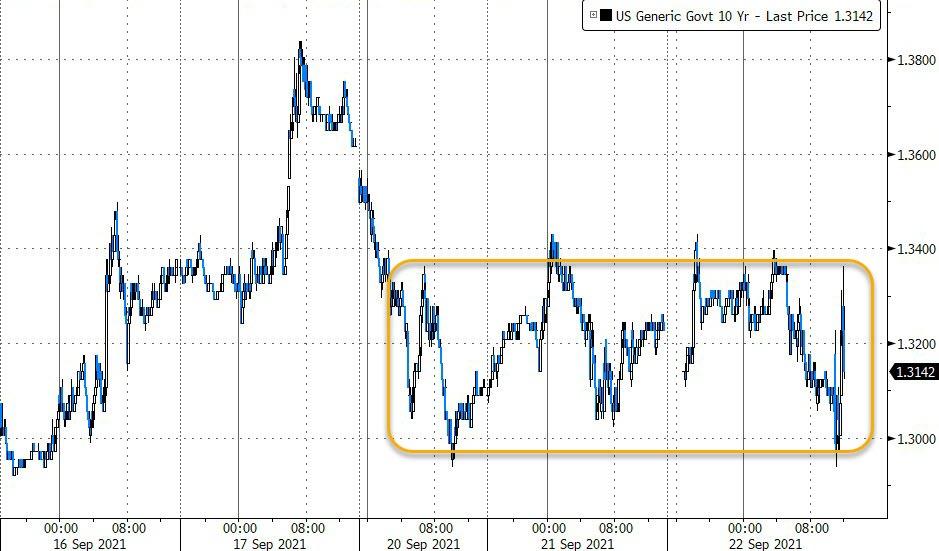
10-year bond yields bounced around aimlessly and remained stuck in their 3-day trading range.
It was an interesting ride, but in the end reality comes down to the direction of the Fed’s balance sheet, no matter what the underlying economic conditions indicate, as Bloomberg demonstrates in this chart.
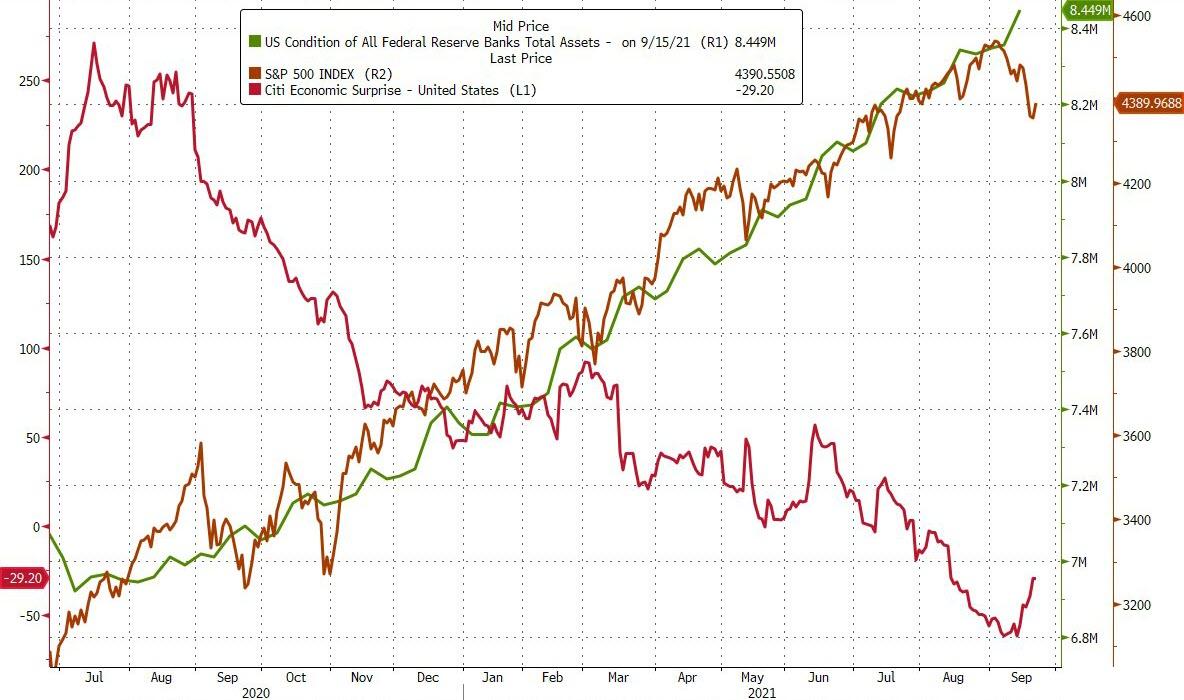
2. ETFs in the Spotlight
In case you missed the announcement and description of this section, you can read it here again.
It features some of the 10 broadly diversified domestic and sector ETFs from my HighVolume list as posted every Saturday. Furthermore, they are screened for the lowest MaxDD% number meaning they have been showing better resistance to temporary sell offs than all others over the past year.
The below table simply demonstrates the magnitude with which these ETFs are fluctuating above or below their respective individual trend lines (%+/-M/A). A break below, represented by a negative number, shows weakness, while a break above, represented by a positive percentage, shows strength.
For hundreds of ETF choices, be sure to reference Thursday’s StatSheet.
For this current domestic “Buy” cycle, here’s how some our candidates have fared:

Click image to enlarge.
Again, the %+/-M/A column above shows the position of the various ETFs in relation to their respective long-term trend lines, while the trailing sell stops are being tracked in the “Off High” column. The “Action” column will signal a “Sell” once the -8% point has been taken out in the “Off High” column. For more volatile sector ETFs, the trigger point is -10%.
3. Trend Tracking Indexes (TTIs)
Our TTIs recovered and advanced as the bullish theme returned.
This is how we closed 09/22/2021:
Domestic TTI: +4.78% above its M/A (prior close +3.62%)—Buy signal effective 07/22/2020.
International TTI: +2.19% above its M/A (prior close +1.41%)—Buy signals effective 07/22/2020.
Disclosure: I am obliged to inform you that I, as well as my advisory clients, own some of the ETFs listed in the above table. Furthermore, they do not represent a specific investment recommendation for you, they merely show which ETFs from the universe I track are falling within the specified guidelines.
Contact Ulli