
- Moving the markets
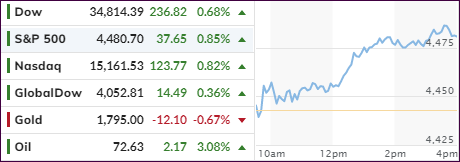
Despite a shaky start, the major indexes found support and managed to overcome the September doldrums, at least for this day. Bullish momentum surfaced with equities accelerating to the upside during the afternoon session, and all three indices closed the day with solid gains.
While the battle between Small Caps (VBK) and Value (RPV) continued unabated, both gained, but the latter outperformed the former by a 2:1 ratio. Helping to stabilize bullish sentiment early on was the Empire manufacturing index, which not only accelerated in August but also beat 18 consensus estimates.
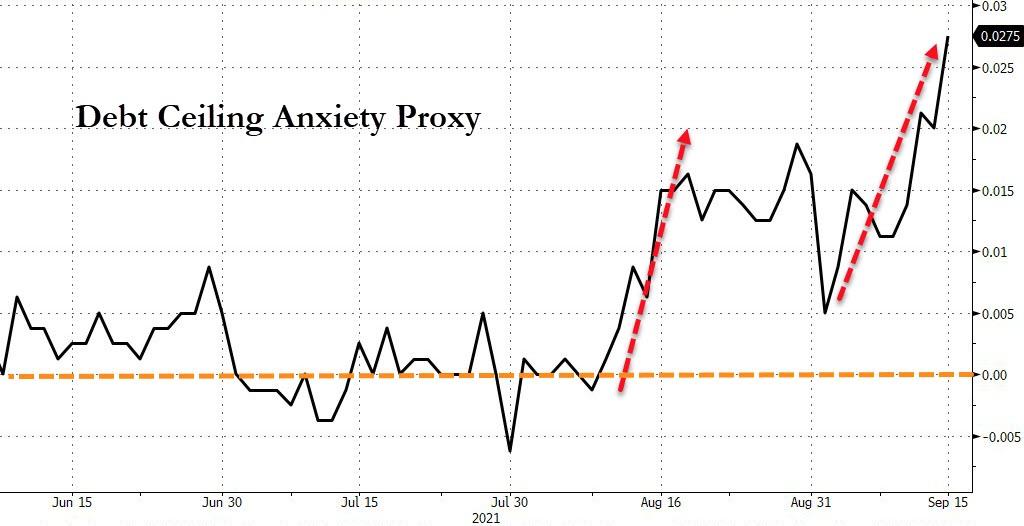
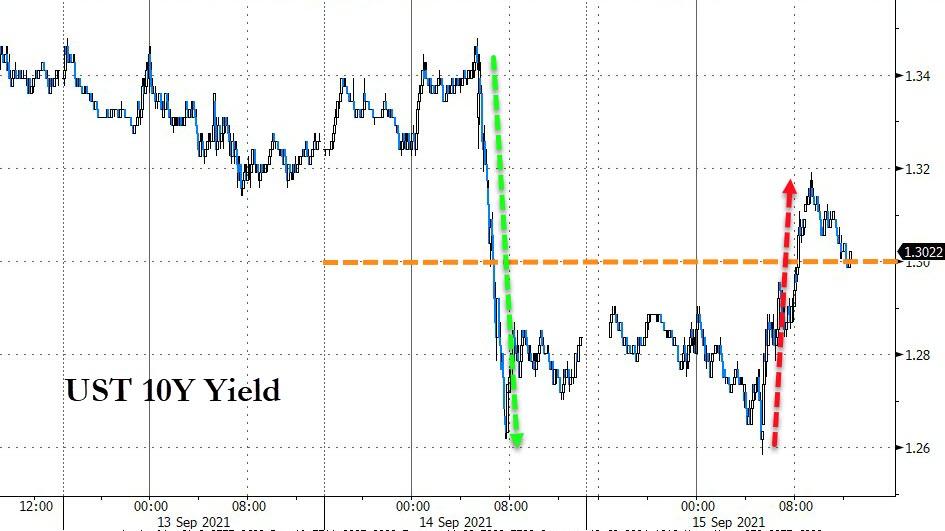
Anxiety about the upcoming Debt ceiling discussions, were moved to the front burner again, yet did not hamper equities but pulled the US Dollar lower, while pushing bond yields higher with the 10-year closing at the 1.3% level.
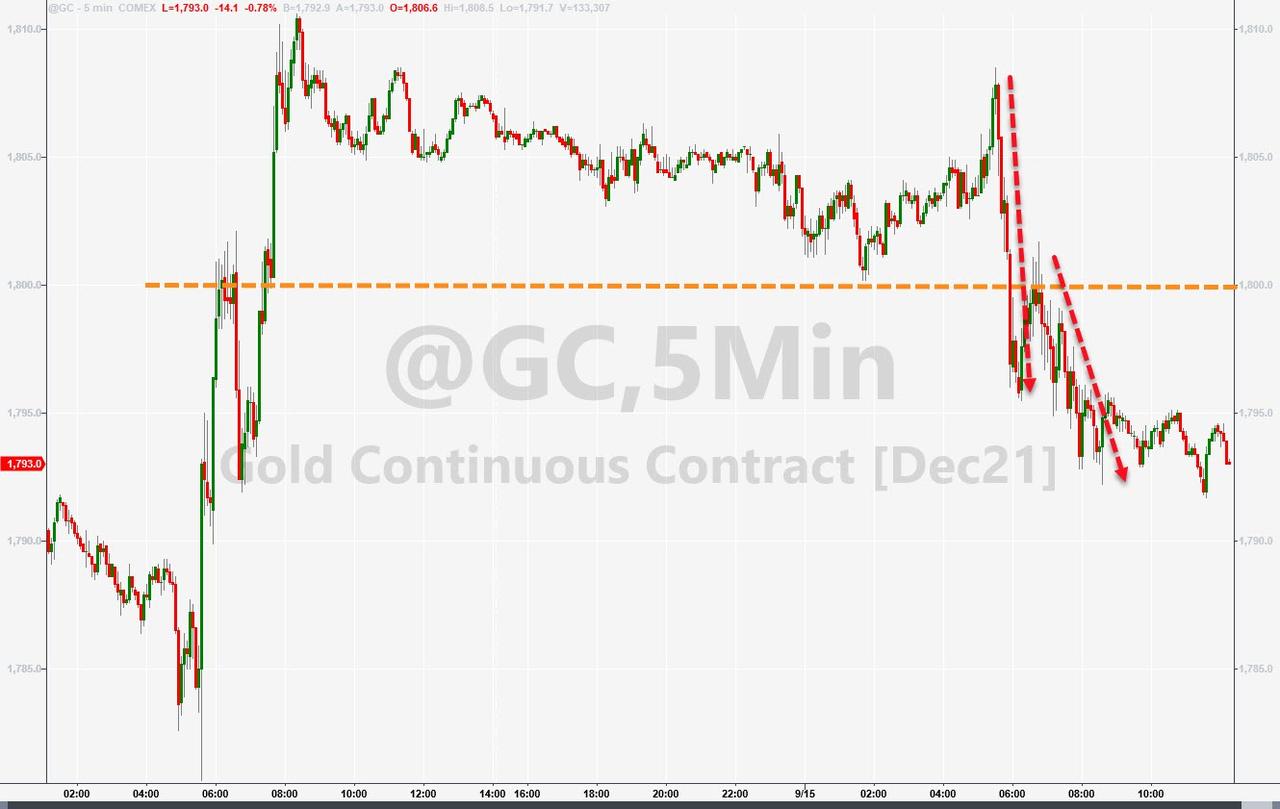
This combination did not work well for Gold, which slipped and lost its $1,800 level again.
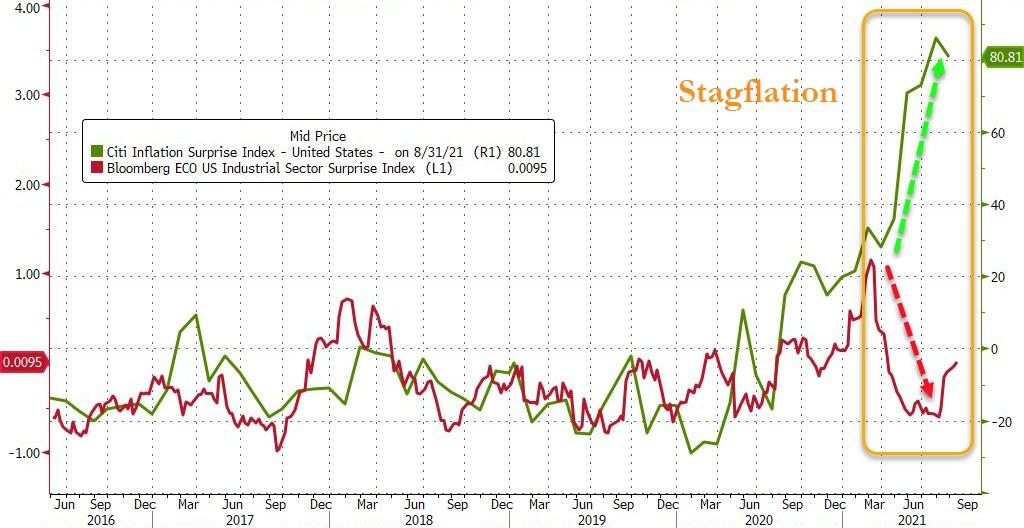
In the end, as Bloomberg charted here, inflation remains with us, with the Industrial Sector Surprise Index limping lower, which translates into the dreaded “S” word, namely Stagflation. Hmm, as Zero Hedge put it, that could be the Fed’s worst nightmare scenario.
2. ETFs in the Spotlight
In case you missed the announcement and description of this section, you can read it here again.
It features some of the 10 broadly diversified domestic and sector ETFs from my HighVolume list as posted every Saturday. Furthermore, they are screened for the lowest MaxDD% number meaning they have been showing better resistance to temporary sell offs than all others over the past year.
The below table simply demonstrates the magnitude with which these ETFs are fluctuating above or below their respective individual trend lines (%+/-M/A). A break below, represented by a negative number, shows weakness, while a break above, represented by a positive percentage, shows strength.
For hundreds of ETF choices, be sure to reference Thursday’s StatSheet.
For this current domestic “Buy” cycle, here’s how some our candidates have fared:
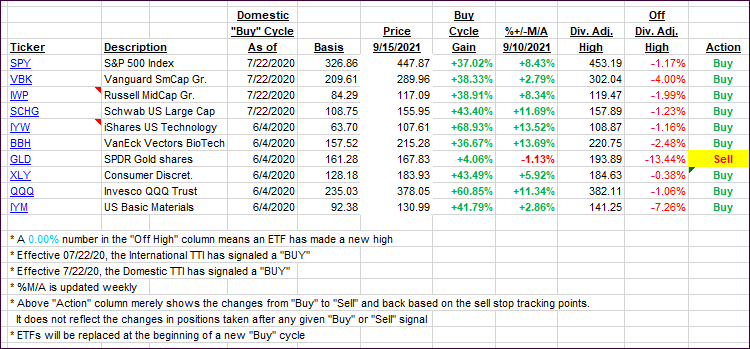
Click image to enlarge.
Again, the %+/-M/A column above shows the position of the various ETFs in relation to their respective long-term trend lines, while the trailing sell stops are being tracked in the “Off High” column. The “Action” column will signal a “Sell” once the -8% point has been taken out in the “Off High” column. For more volatile sector ETFs, the trigger point is -10%.
3. Trend Tracking Indexes (TTIs)
Our TTIs rebounded with the major indexes.
This is how we closed 09/15/2021:
Domestic TTI: +7.65% above its M/A (prior close +6.70%)—Buy signal effective 07/22/2020.
International TTI: +4.89% above its M/A (prior close +4.46%)—Buy signals effective 07/22/2020.
Disclosure: I am obliged to inform you that I, as well as my advisory clients, own some of the ETFs listed in the above table. Furthermore, they do not represent a specific investment recommendation for you, they merely show which ETFs from the universe I track are falling within the specified guidelines.
All linked charts above are courtesy of Bloomberg via ZeroHedge.
Contact Ulli