Chopping, Flopping, And Dropping

Ulli Market Commentary Contact

[Chart courtesy of MarketWatch.com]

  1. Moving the markets

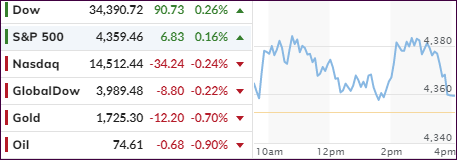
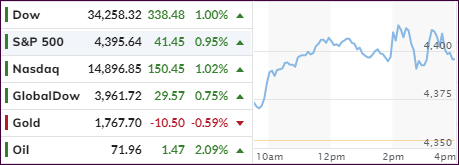
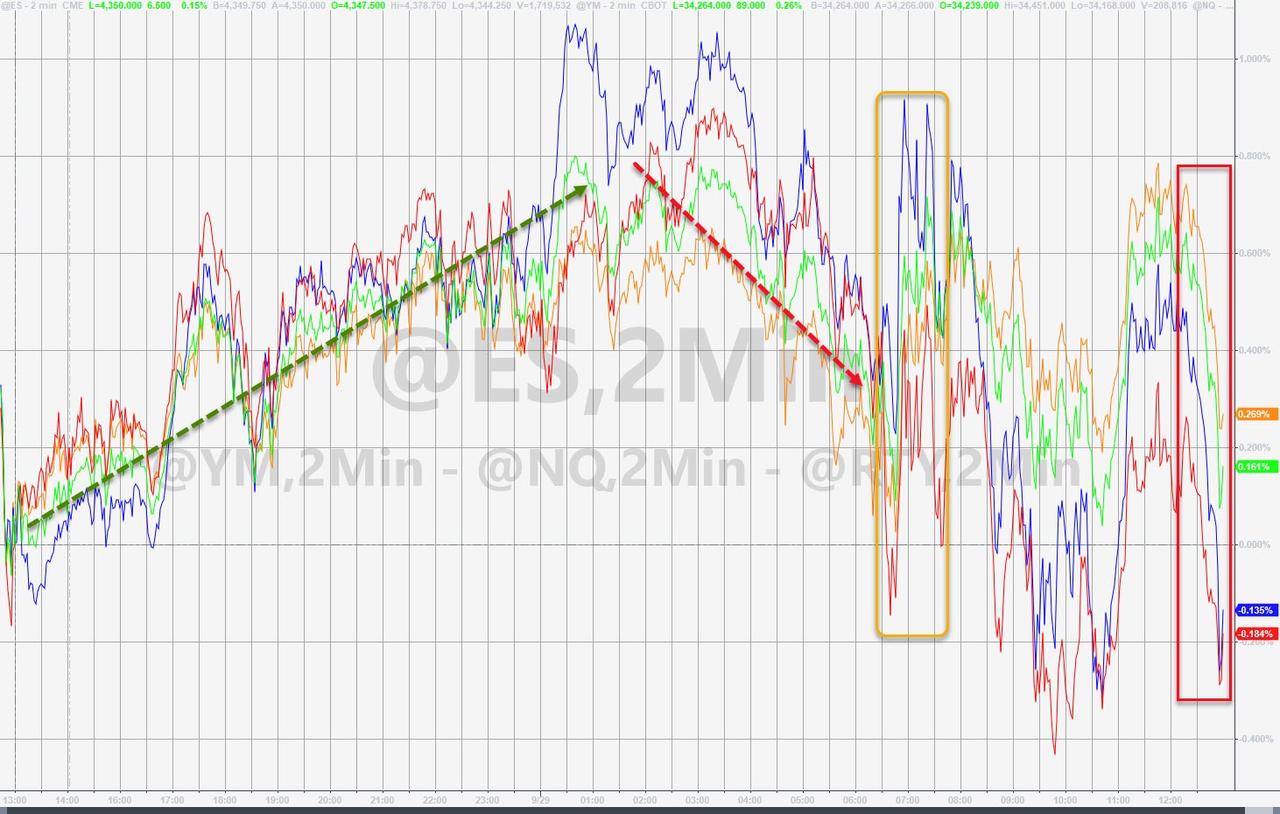
The bulls and bears were engaged in a tug-of-war session with the former seemingly storming ahead only to be pulled back down to reality by the latter. Gains came and went and, when the closing bell rang, only the Dow & S&P 500 were able to barely stay above their respective unchanged lines.

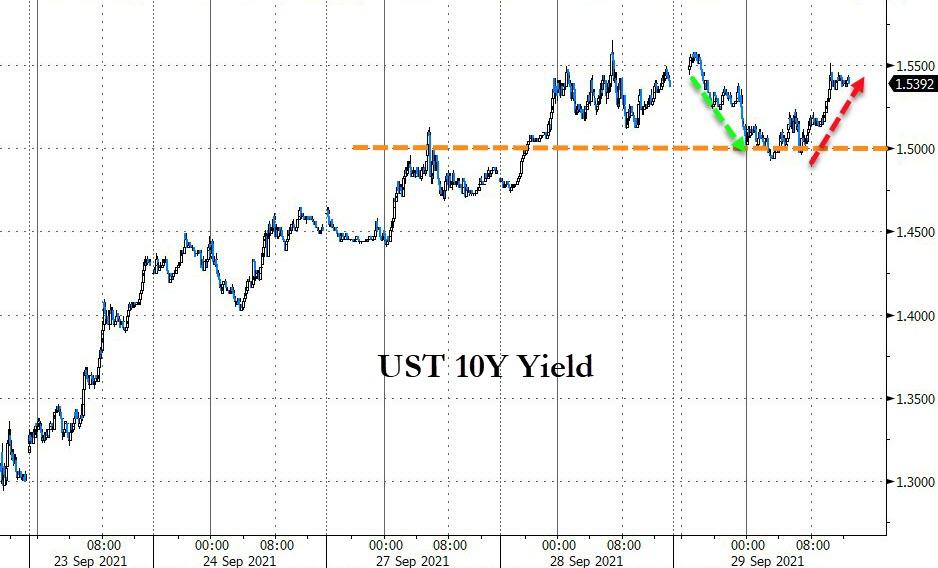
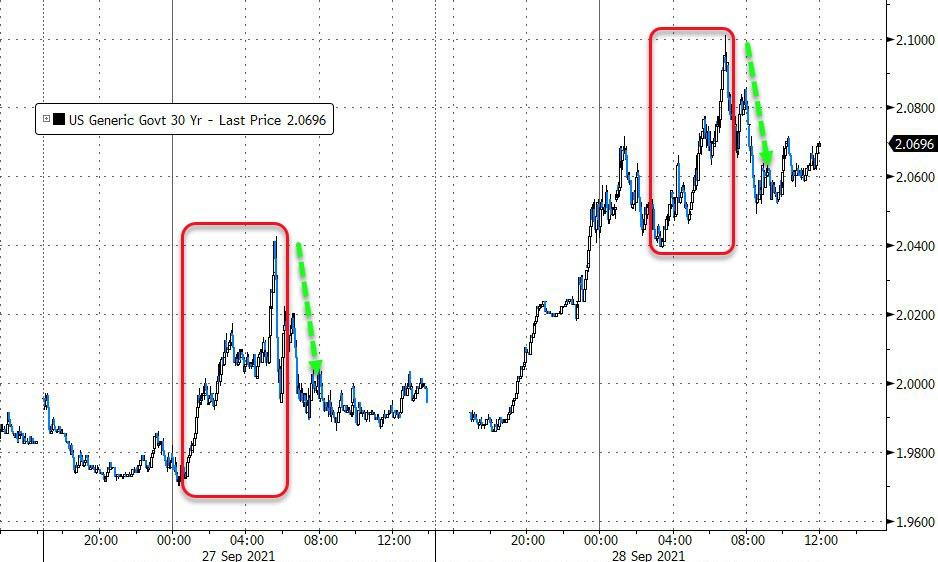
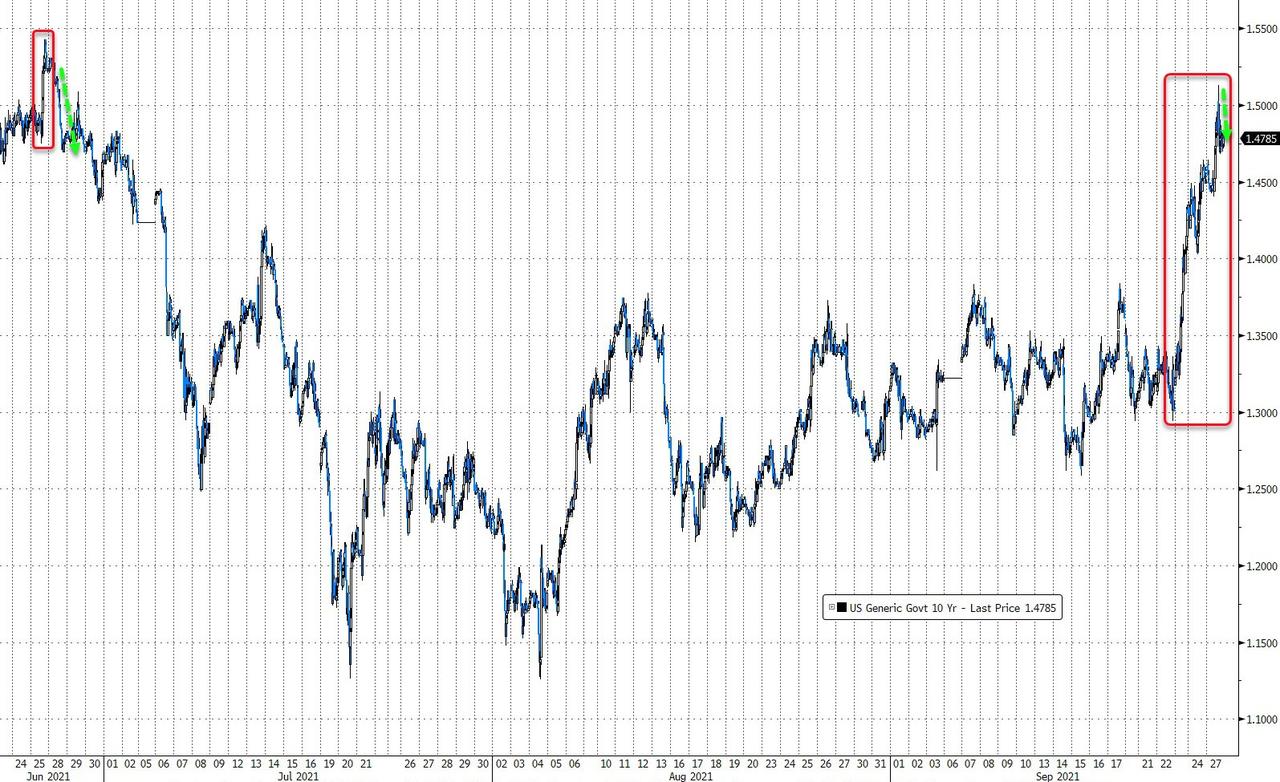
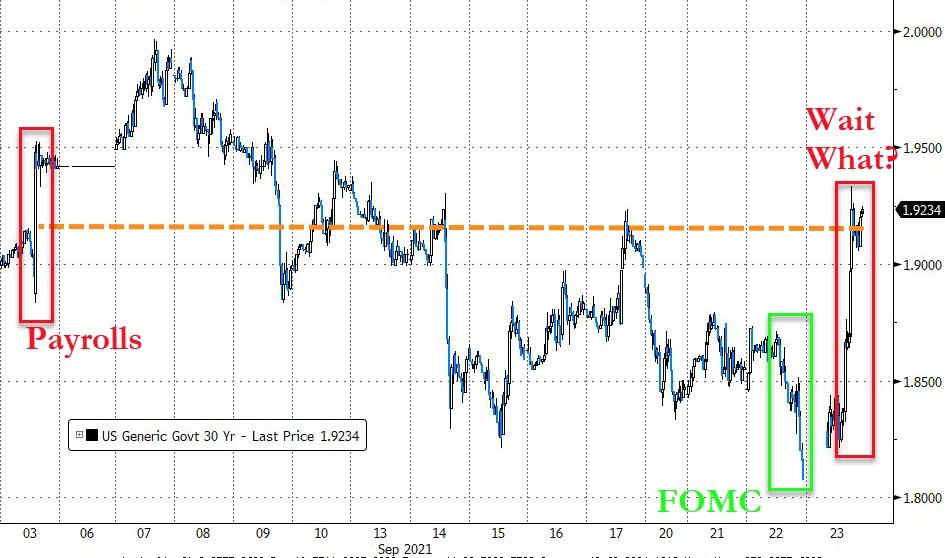
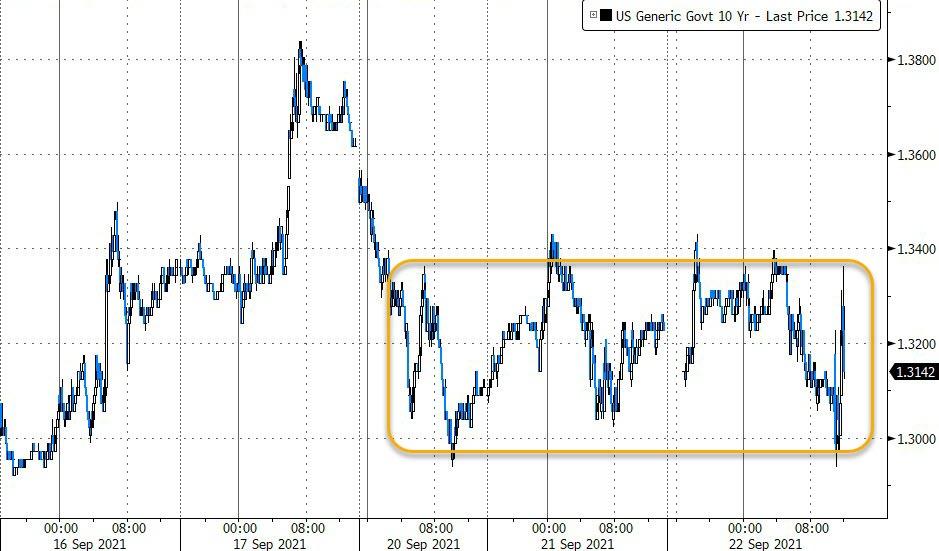
The culprit was the same as yesterday, namely bond yields, which rode the roller coaster again with the 10-year first dropping to 1.5% and then swinging higher in afternoon trading into the 1.54% area.  

The Nasdaq followed this trend by being higher early on, as rates eased, but then lost altitude as yields again marched higher. As a result, the pressure was on “growth” with “value” and Small Caps benefiting.

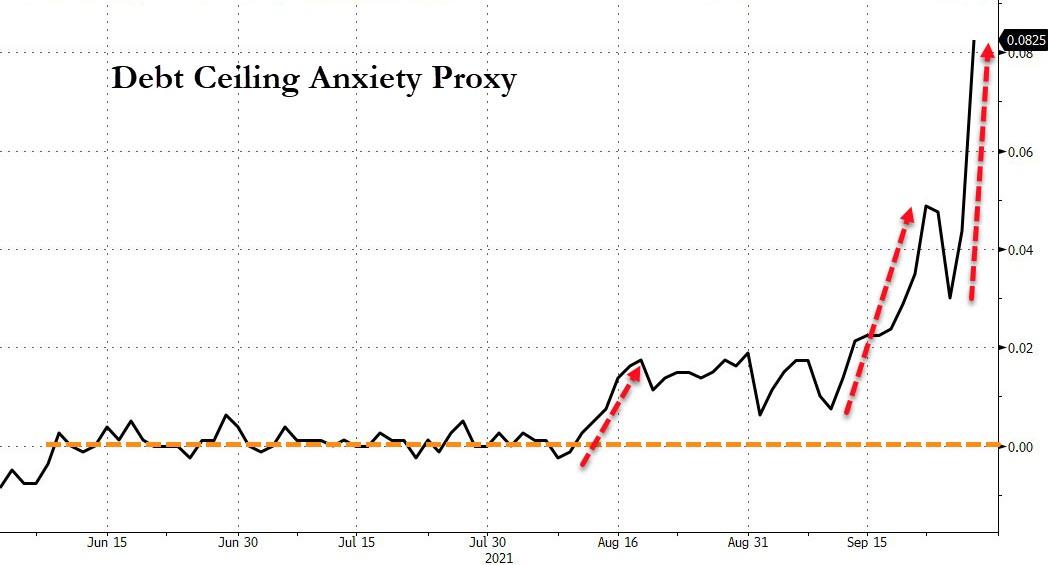
Giving an assist to bearish sentiment was the ongoing Washington debacle with debt ceiling doubts sending questionable messages to the international community about the ability of the USA to fulfill its obligations.

Choppy and sloppy best describes today’s equity moves, as dip buyers where present during the session but absent late in the day, as equities came off their highs. It now looks like the S&P 500 is on track to score its first monthly decline since January.

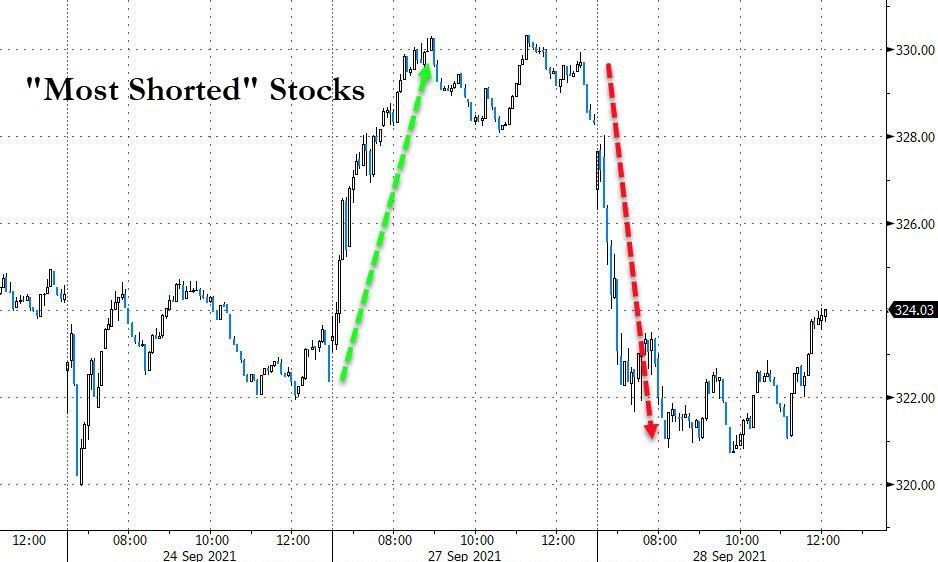
Zero Hedge called it this way:

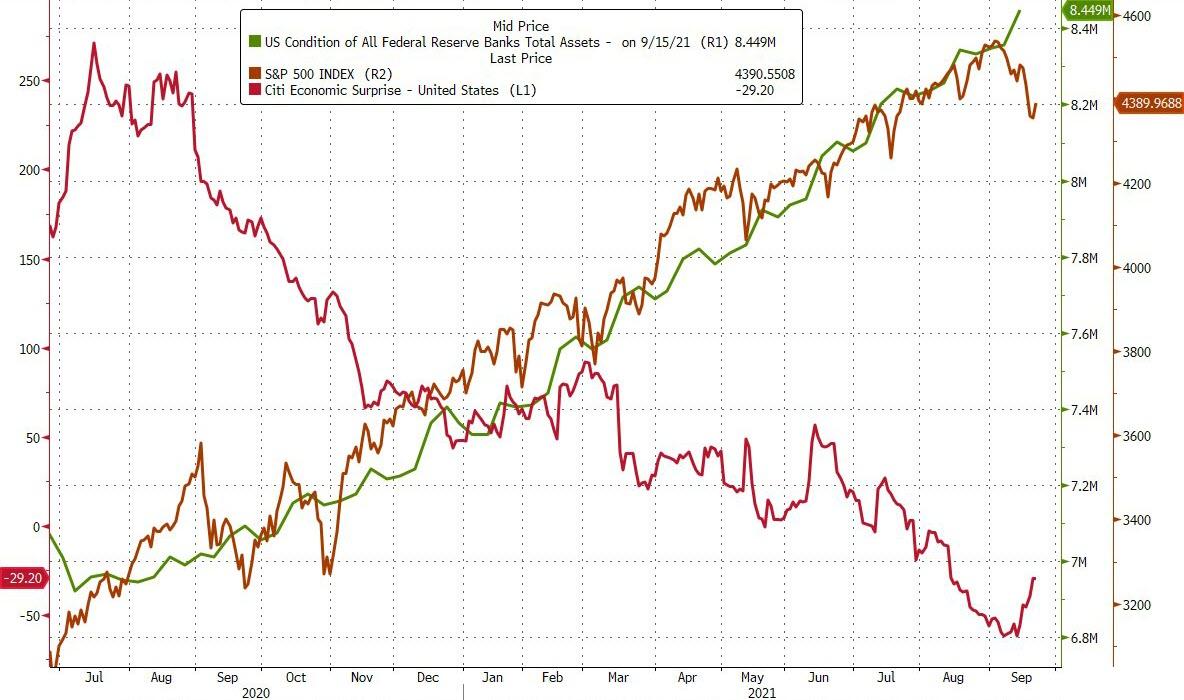
While rising bond yields, Fed tapering, the delta variant and inflation help explain that, all of those will slow profit growth after rising earnings estimates and big beats helped fuel 2021’s stock rally until now with an always-optimistic eye for the ‘recovery’ and ‘return to normal’ that now seems ever further away.

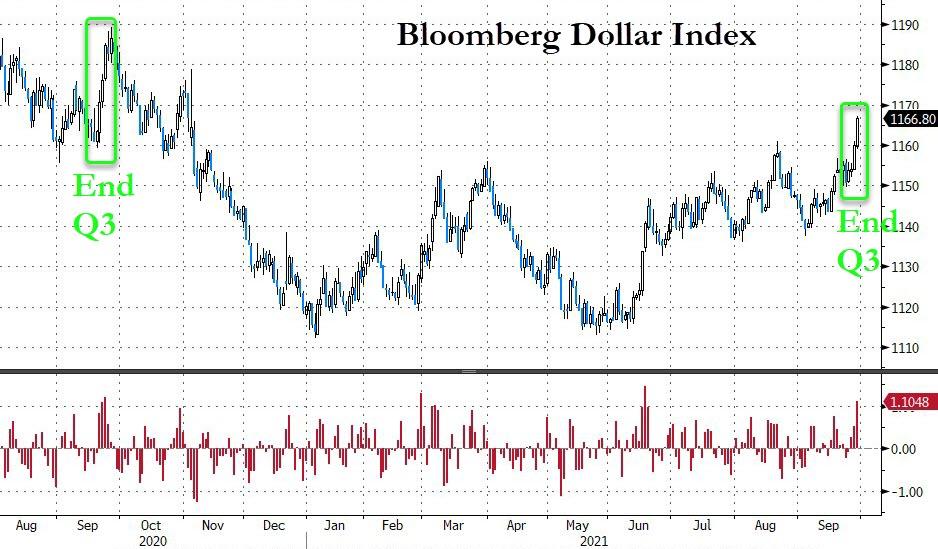
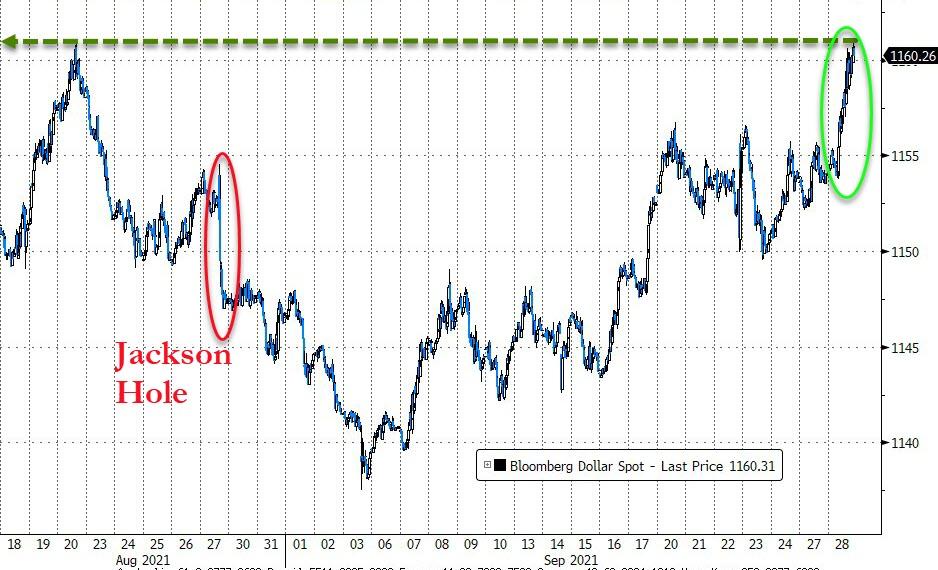
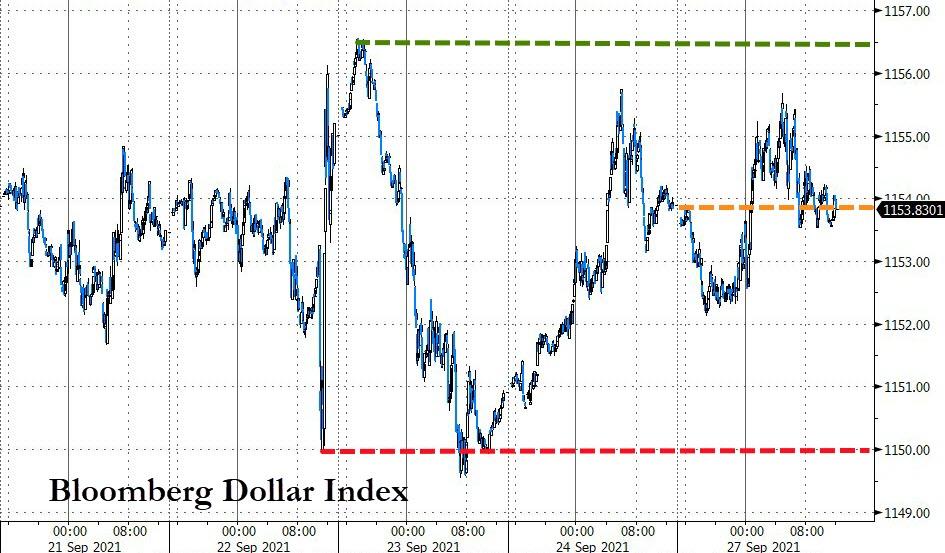
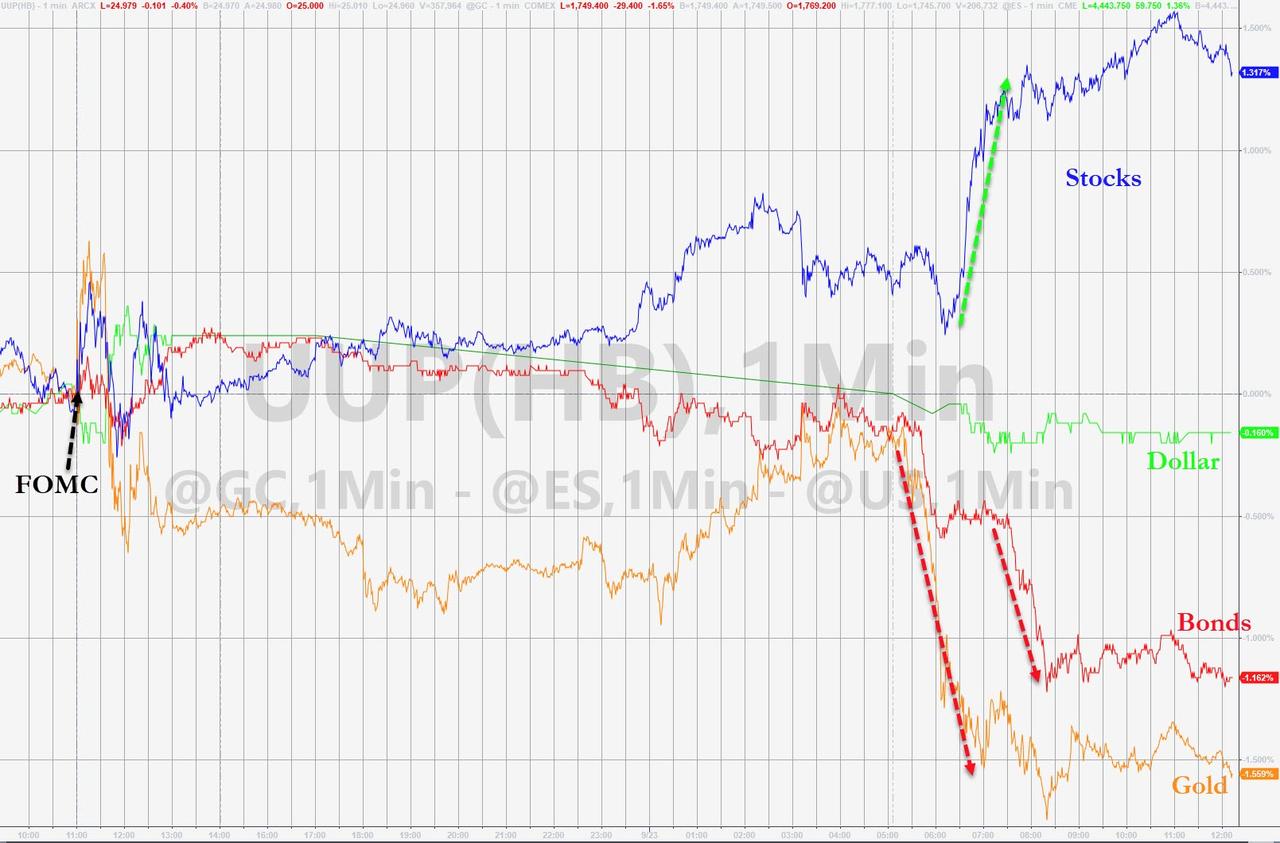
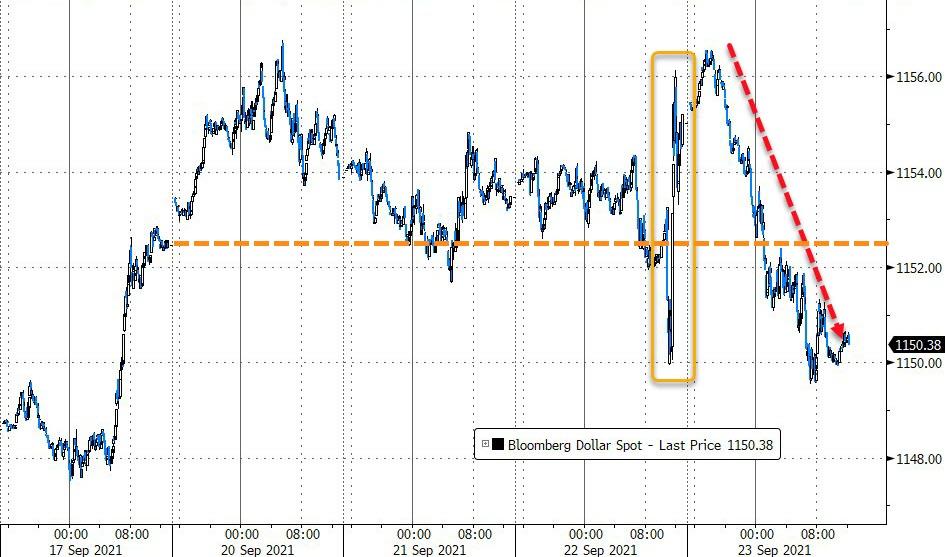
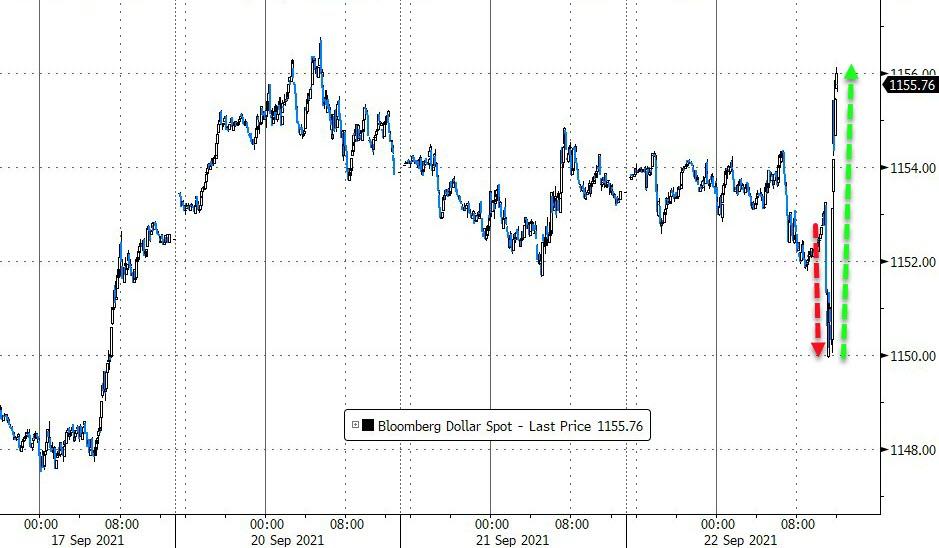
The US Dollar index, in the face of higher bond yields, continued its northerly path by registering its biggest 2-day jump since June, and it seems to be closing this September on a high note, just as it did in 2020.

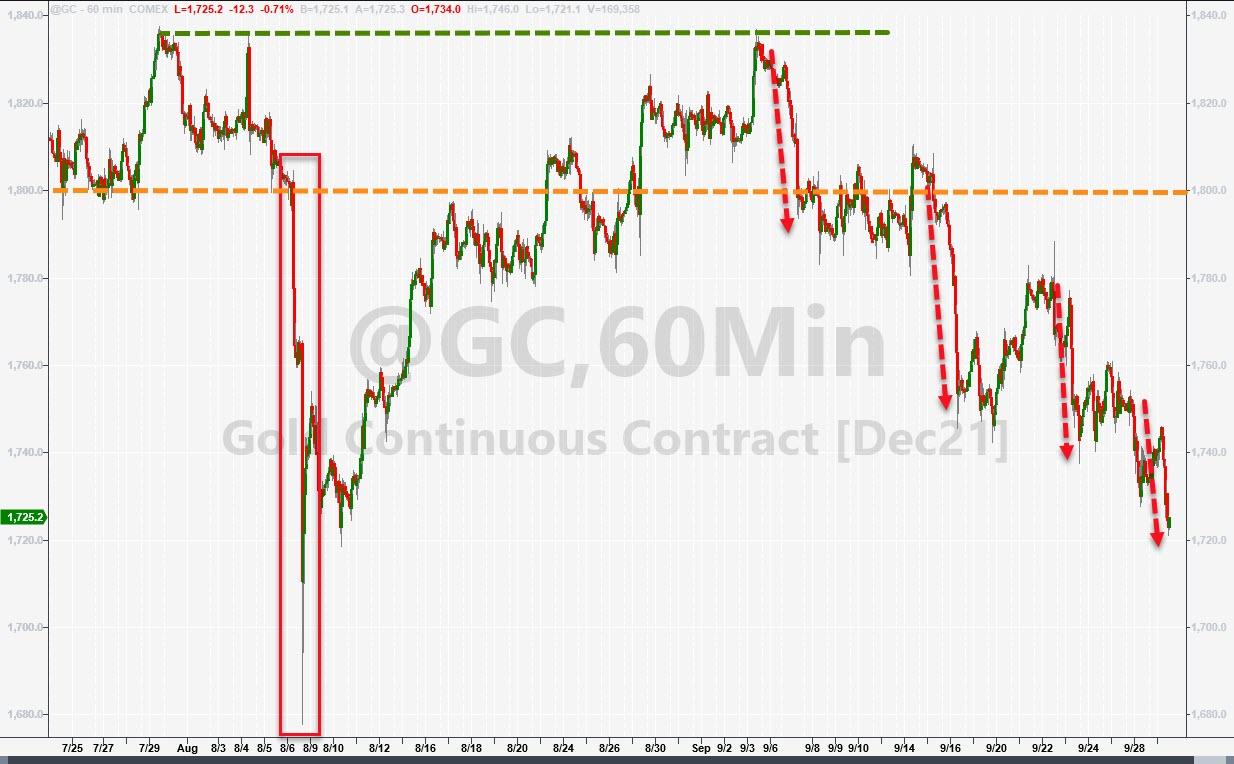
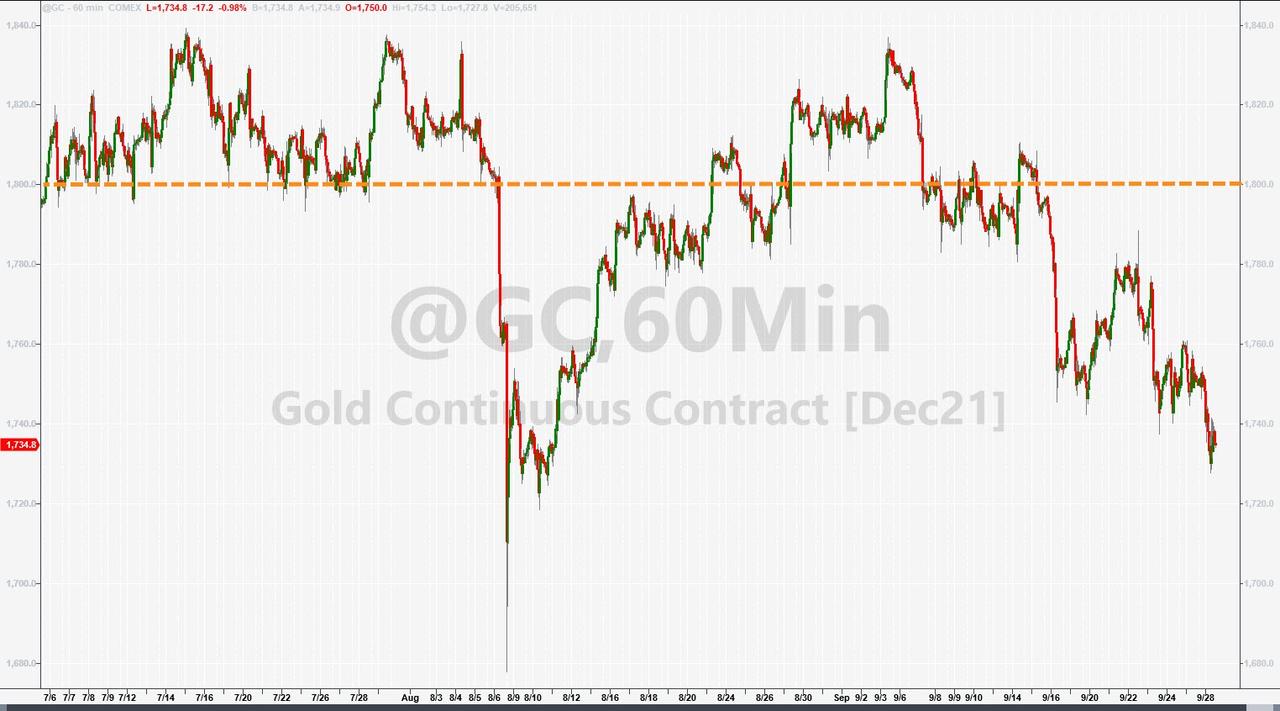
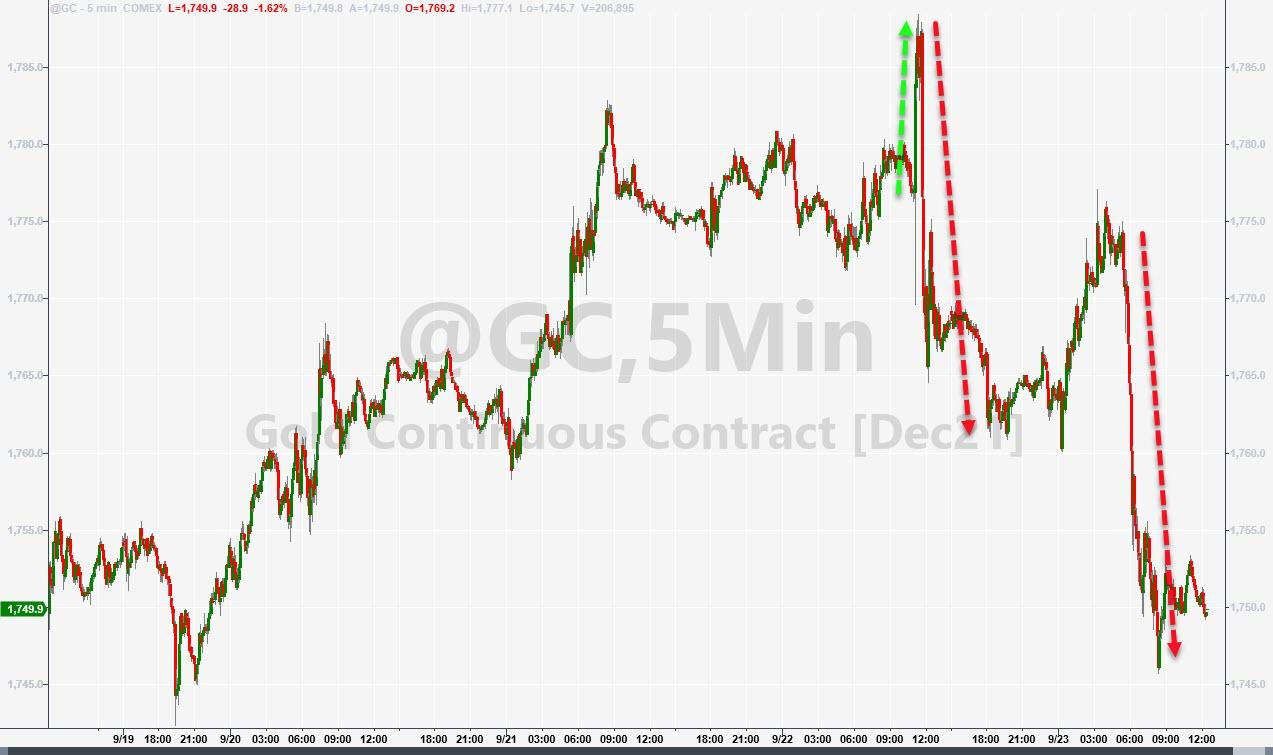
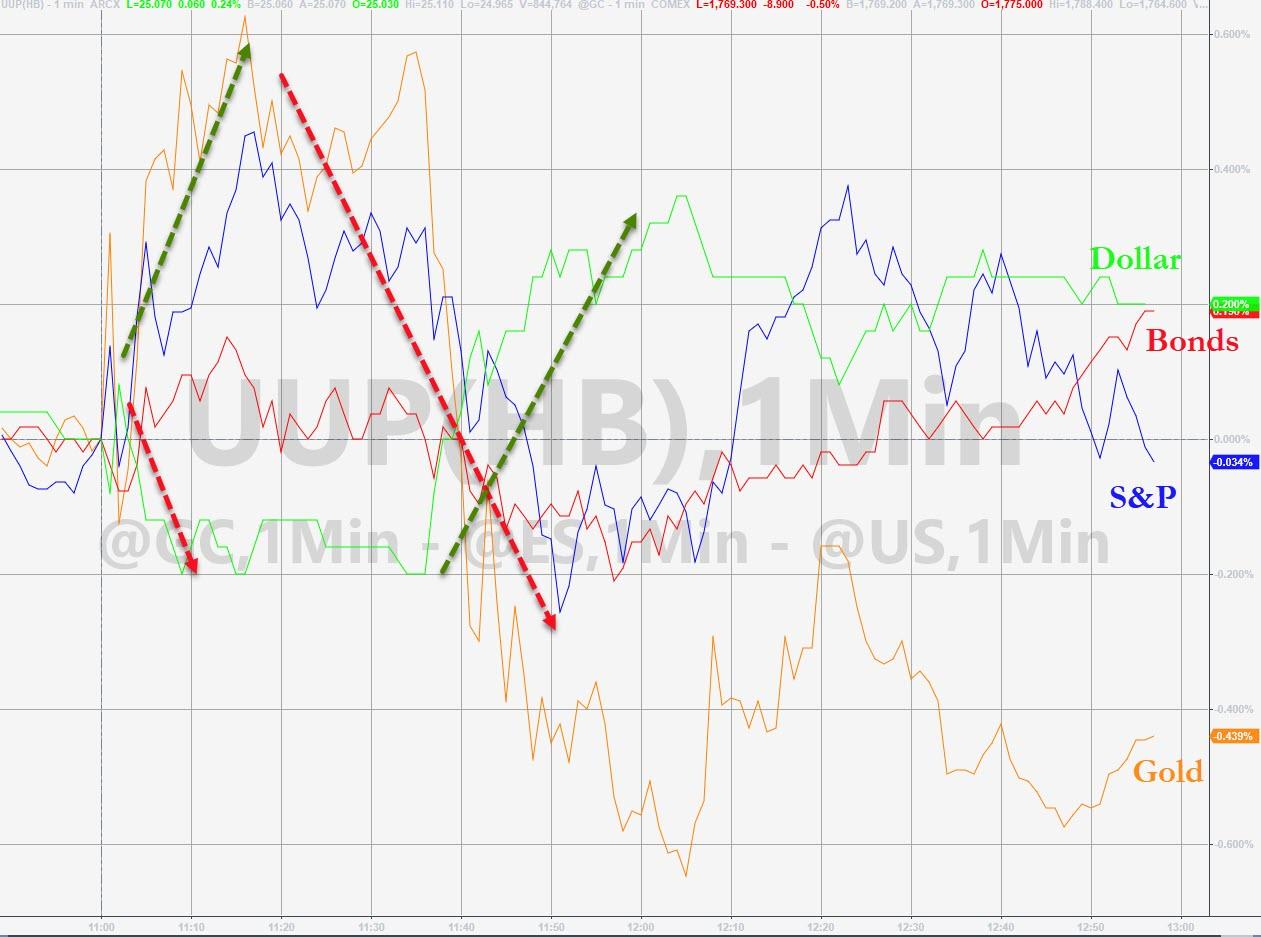
Again, higher bond yields and a rallying dollar combined to take the starch out of Gold which, despite a mid-day rally, was not able to hold on and retreated -0.72%.

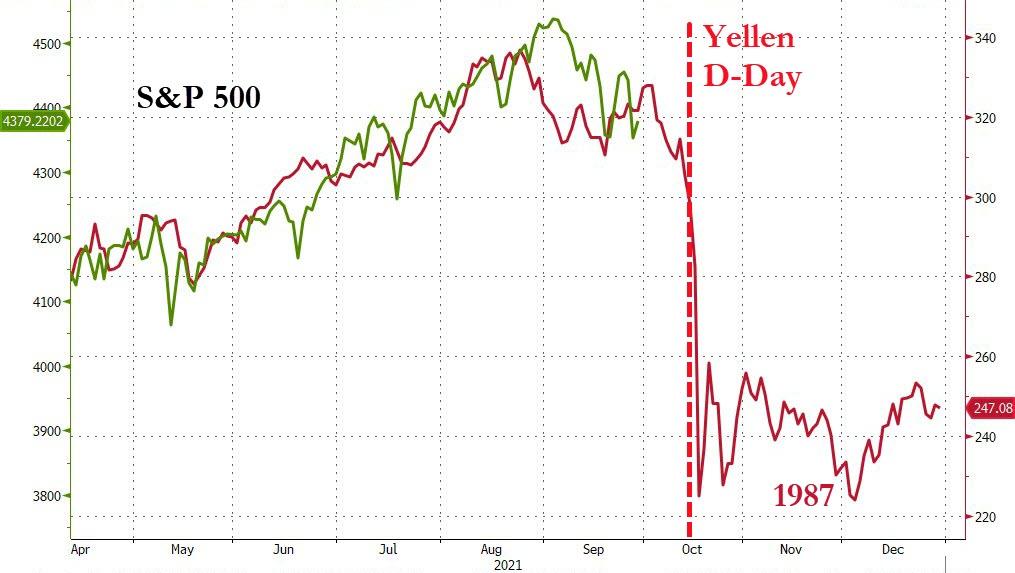
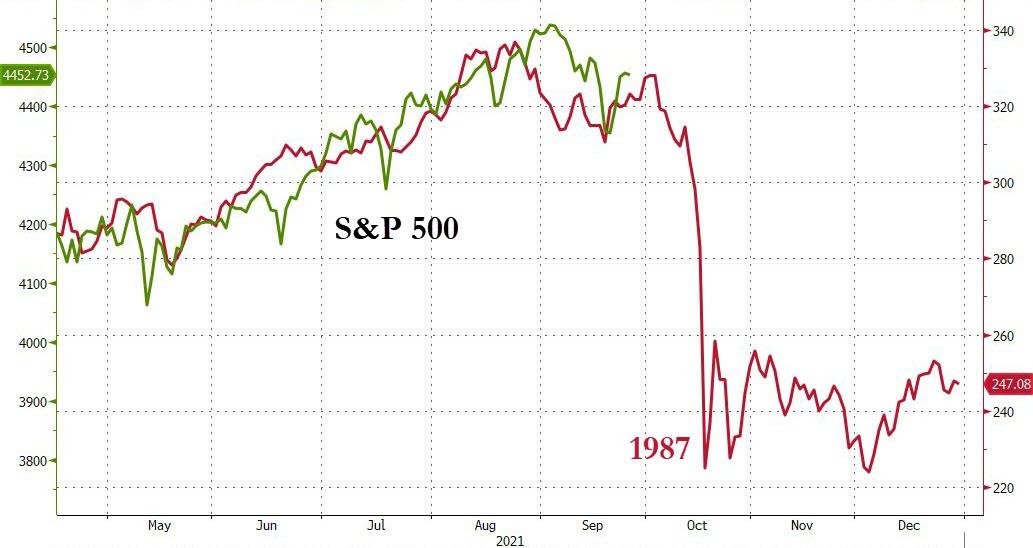
So far, the analog to 1987 is right on track, as Bloomberg’s chart shows.

Read More

Bond Yields Crank And Markets Tank

Ulli Market Commentary Contact

[Chart courtesy of MarketWatch.com]

  1. Moving the markets

There was no question that spiking bond yields were the destroyer of equity prices, with the major indexes tanking in unison right after the opening bell. A couple of rebound attempts were rebuffed, and the downward trend continued with the Nasdaq faring the worst with a loss of 2.83%.

Bond yields shot up with the 10-year touching 1.558%, its highest level since June, before retreating, while the 30-year catapulted above 2%. Amazingly, we saw the 10-year as low as 1.29% last week, and it had sunk as low as 1.13% in August. These are huge moves in that arena, which handed bond investors severe losses.

The reason for surging yields is increased conviction by traders that that the Fed will no longer talk but start tapering its $120 billion in monthly bond purchases “real soon.” What that means is that artificially suppressed rates due to tapering will now have to face the reality of a “true” market.

Added strategist Kathy Jones:

The market’s been steadily coming around to the reality that yields were awfully low relative to the fundamentals. Now the Fed is shifting, and everybody’s shifting their positions, all at once, as we tend to do.

Not helping matters was the ongoing budget showdown and the debt ceiling debacle, neither one of which exerted any positives towards the market. Uncertainty will keep a lid on any attempts to push equities higher.

Technical damage was done to the indexes, as Zero Hedge pointed out:

  • S&P broke back below 50DMA, testing 100DMA
  • Nasdaq broke back below 50DMA, testing 100DMA
  • Dow broke back below 50DMA and 100DMA
  • Russell 2000 broke back below 50DMA

When appropriate, I mention short squeezes and how they are supporting the bullish meme. However, none of that was present today, as “the most shorted stocks” did what they are supposed to, namely head south, and consequently wiped out yesterday’s squeeze gains in the process.

The US Dollar likes rising bond yields and continued its melt up and, during this course of action, slammed gold by over 1%. On the economic side, US Consumer Confidence plunged to 7-month lows, thus enhancing the sour mood on Wall Street.

You can see my latest blogging schedule here.

Read More

Surging Bond Yields Neutralize Equities

Ulli Market Commentary Contact

[Chart courtesy of MarketWatch.com]

  1. Moving the markets

An early bounce faded throughout the session with only the Dow maintaining bullish tendencies, while the S&P 500 and Nasdaq drifted aimlessly below their respective unchanged lines.

The final week of a volatile September caused this divergence in the major indexes with growth/tech stocks struggling as bond yields spiked, with the 10-year briefly breaking through the 1.5% marker and reaching its highest point since June.

The US Dollar rode the roller-coaster all day but stayed range bound and closed just about unchanged. Gold gave up its early gains and dipped back to the unchanged line, as surging bond yields took the starch out from any upward momentum.

The rise in yields benefited some sectors such as the financials (XLF) and the Commodity Index (CRB), each of which added +1.36% for the day. The value ETF RPV finally showed some signs of life by gaining an impressive +2.19%, but in that sector those kinds of advances can be wiped out in a hurry, as we have witnessed this year.

This week will not only mark the end of September, but on the menu are a host of items that can push markets around in a hurry. I am talking about the ongoing US Debt ceiling/government shutdown/infrastructure bill narrative, all of which might be coming to a head by the end of this week.

As ZeroHedge pointed out tongue-in-cheek, “maybe a 20% plus drop in stocks down to the level as shown in this chart may get the warring parties to agree on something.”   

We will find out.

Read More

Weekly StatSheet For The ETF Tracker Newsletter – Updated Through 09/23/2021

Ulli ETF StatSheet Contact

ETF Data updated through Thursday, September 23, 2021

Methodology/Use of this StatSheet:

1. From the universe of over 1,800 ETFs, I have selected only those with a trading volume of over $5 million per day (HV ETFs), so that liquidity and a small bid/ask spread are assured.

2. Trend Tracking Indexes (TTIs)

Buy or Sell decisions for Domestic and International ETFs (section 1 and 2), are made based on the respective TTI and its position either above or below its long-term M/A (Moving Average). A crossing of the trend line from below accompanied by some staying power above constitutes a “Buy” signal. Conversely, a clear break below the line constitutes a “Sell” signal. Additionally, I use an 8% trailing stop loss on all positions in these categories to control downside risk.

3. All other investment arenas do not have a TTI and should be traded based on the position of the individual ETF relative to its own respective trend line (%M/A). That’s why those signals are referred to as a “Selective Buy.” In other words, if an ETF crosses its own trendline to the upside, a “Buy” signal is generated. Since these areas tend to be more volatile, I recommend a wider trailing sell stop of 8%-10% depending on your risk tolerance.

If you are unfamiliar with some of the terminology, please see Glossary of Terms and new subscriber information in section 9.     

1. DOMESTIC EQUITY ETFs: BUY — since 07/22/2020

Click on chart to enlarge

Our main directional indicator, the Domestic Trend Tracking Index (TTI-green line in the above chart) has now rallied above its long-term trend line (red) by +6.32% and remains in “BUY” mode as posted.

Read More

Comeback Rally Shifts Into Overdrive

Ulli Market Commentary Contact

[Chart courtesy of MarketWatch.com]
  1. Moving the markets

The continuing crisis in China with their worsening Evergrande developer spectacle and potential default in the hundreds of billions of dollars, was simply moved to back burner, at least for this session.

However, this fact remains:

But the elephant in the room is not the write down of a modest $18 billion in foreign bonds to the likes of Blackrock, for whom this is peanuts. The real question is how an Evergrande failure would impact confidence in China’s property sector and whether it will lead to a sharp drop in what has traditionally been the world’s most valuable asset, one which represents some 70% of China’s urban household net worth.

For sure, we have not heard the last of this predicament…

Dominating the markets was the Fed and its indication that current monetary stimulus would continue just a while longer, with the powers to be not yet having announced a formal starting date.

The central bank issued a statement following the meeting that said if progress continues “as expected,” then a “moderation in the pace of asset purchases may soon be warranted.”

That was sufficient encouragement, and equities shifted into overdrive with the three major indexes adding over 1% each. To no surprise, this ramp-a-thon was enough to wipe out the losses sustained on Monday and Tuesday and push the indexes back into the green for the week.

I took the opportunity to replace our recently sold value ETF with a more appropriate holding for the current environment.

It was a tale two markets with stocks up and everything else down. Another big assist came from a short squeeze, which helped to pull the indexes out of their doldrums. The US Dollar gagged and surrendered yesterday’s gains.  

Bond yields surged and gold got purged, as even a diving dollar could not prevent the precious metal price from being shaken up.

As a reminder, I will be out again tomorrow, so there will be no market commentary, but I will post the weekly StatSheet by 6:30 pm PST tonight.

Read More

Fed Stokes Markets

Ulli Market Commentary Contact

[Chart courtesy of MarketWatch.com]

  1. Moving the markets

Despite the Fed’s (FOMC) most hawkish statement in 3 years, the markets took it as a positive and propelled the major indexes out of their recent doldrums, with all 3 of them advancing around 1% for the session.

Support for stocks came from the fact that the Fed will not initiate an immediate rollback of monetary stimulus, which has been a supporting actor to keep the markets elevated over the recent years.

The FOMC signaled a rate hike in 2022, with Fed head Powell noting that “tapering ending around mid-2022 may be appropriate.” That matched expectations that the start of taper might begin in December at a reduction of $15 billion per month, which means the actual announcement will be still forthcoming.

Added analyst Graham Summers:

By way of comparison, during the Fed’s last QE taper (that pertaining to QE 3 in 2017), the Fed reduced the pace of its then-QE program by $10 billion every THREE months, with the pace stopping at $30 billion per month.

Again, the current proposed tightening is much faster and aggressive than the last.

The big question is how the markets digest this. The last time the Fed attempted to taper a major QE program, it ultimately blew up the corporate debt markets resulting in stocks collapsing 20% in a matter of weeks.

The market’s rise was interrupted by reversals, with equities coming off their highs, the US Dollar crawling out of an early hole and ramping higher, while gold lost its early shine and was dumped into the close.

10-year bond yields bounced around aimlessly and remained stuck in their 3-day trading range.

It was an interesting ride, but in the end reality comes down to the direction of the Fed’s balance sheet, no matter what the underlying economic conditions indicate, as Bloomberg demonstrates in this chart.

Read More