
- Moving the markets
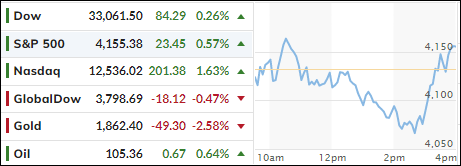
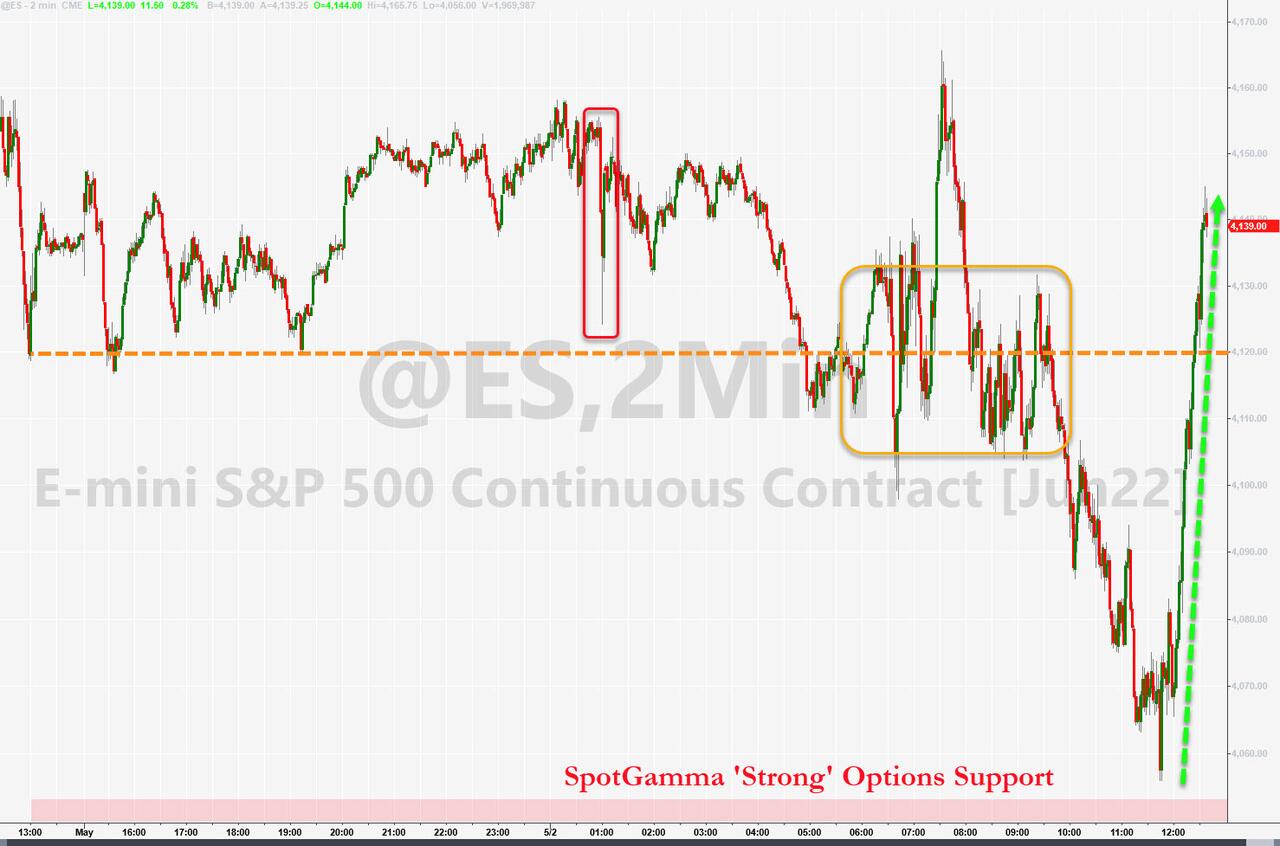
Last week’s downtrend continued during the first trading session of May, as the Dow stumbled some 400 points early on, but a last hour rebound pulled the major indexes out of the doldrums and back into the green.
The S&P 500 fell to new lows for the year, which is viewed as a sign of more weakness to come, before being saved by the afternoon bounce. This index and its compatriot, the Dow, recorded April as being their worst month since March of 2020, which marked the beginning of the pandemic.
The tug-of-war continues between those that see the current setback as an opportunity to buy the dip vs. their opponents, who believe that stocks have further to fall.
Europe’s markets got hammered after a flash-crash in Stockholm gave an assist to the bears, who carried the torch through the regular session with all European indexes ending in the red.
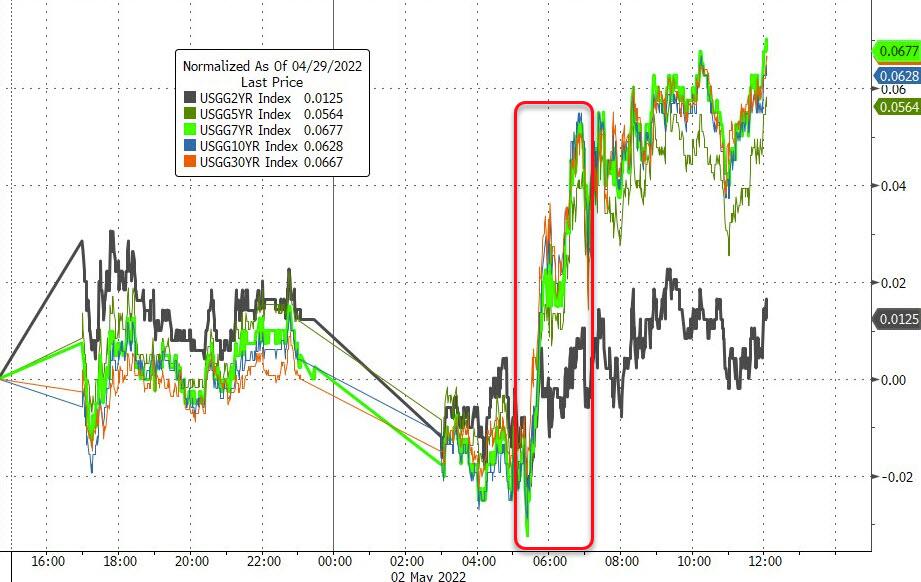
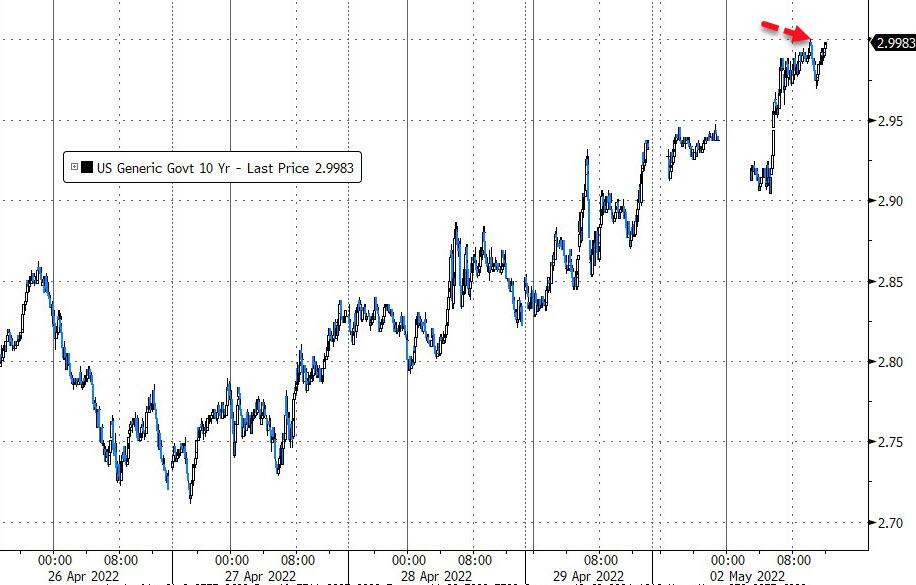
Bonds were the story of the day with yields surging, as the 10-year topped 3% for the first time since December of 2018, after which equities tanked, and the Fed folded like a cheap suit by lowering rates again to prop up the stock market.
All eyes are on this Wednesday’s Fed meeting on rate increases. Expectations are for a 50-bps hike this week and priced in odds are 25% of a 75-bps hike in June.
2. ETFs in the Spotlight
In case you missed the announcement and description of this section, you can read it here again.
It features some of the 10 broadly diversified domestic and sector ETFs from my HighVolume list as posted every Saturday. Furthermore, they are screened for the lowest MaxDD% number meaning they have been showing better resistance to temporary sell offs than all others over the past year.
The below table simply demonstrates the magnitude with which these ETFs are fluctuating above or below their respective individual trend lines (%+/-M/A). A break below, represented by a negative number, shows weakness, while a break above, represented by a positive percentage, shows strength.
For hundreds of ETF choices, be sure to reference Thursday’s StatSheet.
For this just closed-out domestic “Buy” cycle, here’s how some of our candidates have fared:
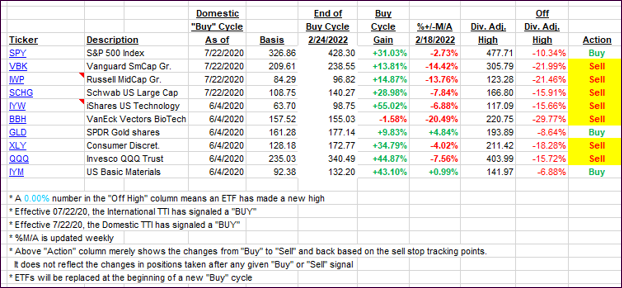
Click image to enlarge.
Again, the %+/-M/A column above shows the position of the various ETFs in relation to their respective long-term trend lines, while the trailing sell stops are being tracked in the “Off High” column. The “Action” column will signal a “Sell” once the -12% point has been taken out in the “Off High” column, which has replaced the prior -8% to -10% limits.
3. Trend Tracking Indexes (TTIs)
Our TTIs changed only immaterially and remain stuck in bear market territory.
This is how we closed 05/02/2022:
Domestic TTI: -4.71% below its M/A (prior close -4.97%)—Sell signal effective 02/24/2022.
International TTI: -6.51% below its M/A (prior close -6.12%)—Sell signal effective 03/08/2022.
Disclosure: I am obliged to inform you that I, as well as my advisory clients, own some of the ETFs listed in the above table. Furthermore, they do not represent a specific investment recommendation for you, they merely show which ETFs from the universe I track are falling within the specified guidelines.
All linked charts above are courtesy of Bloomberg via ZeroHedge.
Contact Ulli