
- Moving the markets
Today’s bloodbath in equities makes yesterday’s “rebound of hope” look like a dead cat bounce, as dip buyers were not to be found anywhere. “Stunning” best describes this sudden reversal, which erased yesterday’s profits and then some.
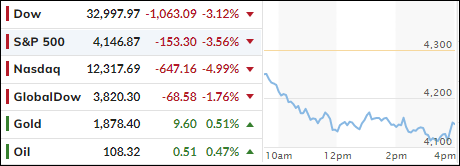
With the Dow tumbling over 1,000 points, domestic equities notched their worst day of the year on top of the already stunning losses YTD. This chart, courtesy of FinViz.com, shows the wild ride we have seen in 2022:
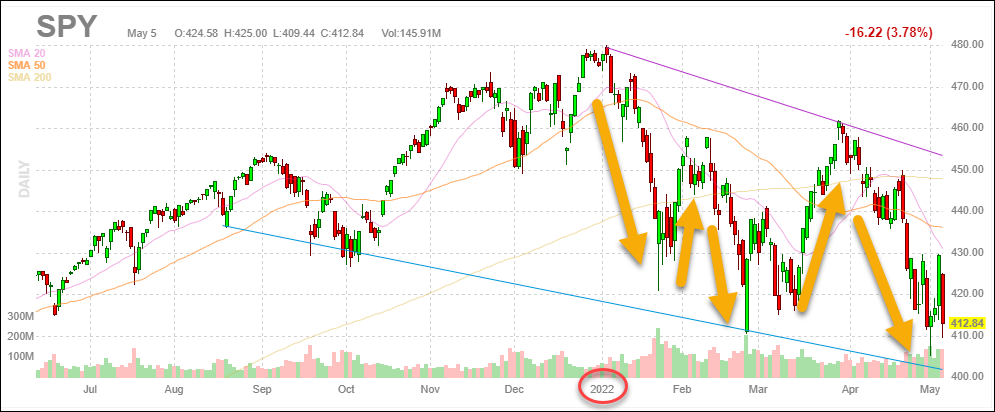
With lower highs and lower lows dominating, and my Domestic TTI now hovering below its long-term trend line by -4.22%, we are clearly stuck in bear market territory and are watching endless rebound attempts.
While there was no place to hide, our selected sector ETFs, took only a small hit, with our latest addition, TBF, being the only one to score a solid gain of +2.81%.
As ZeroHedge noted:
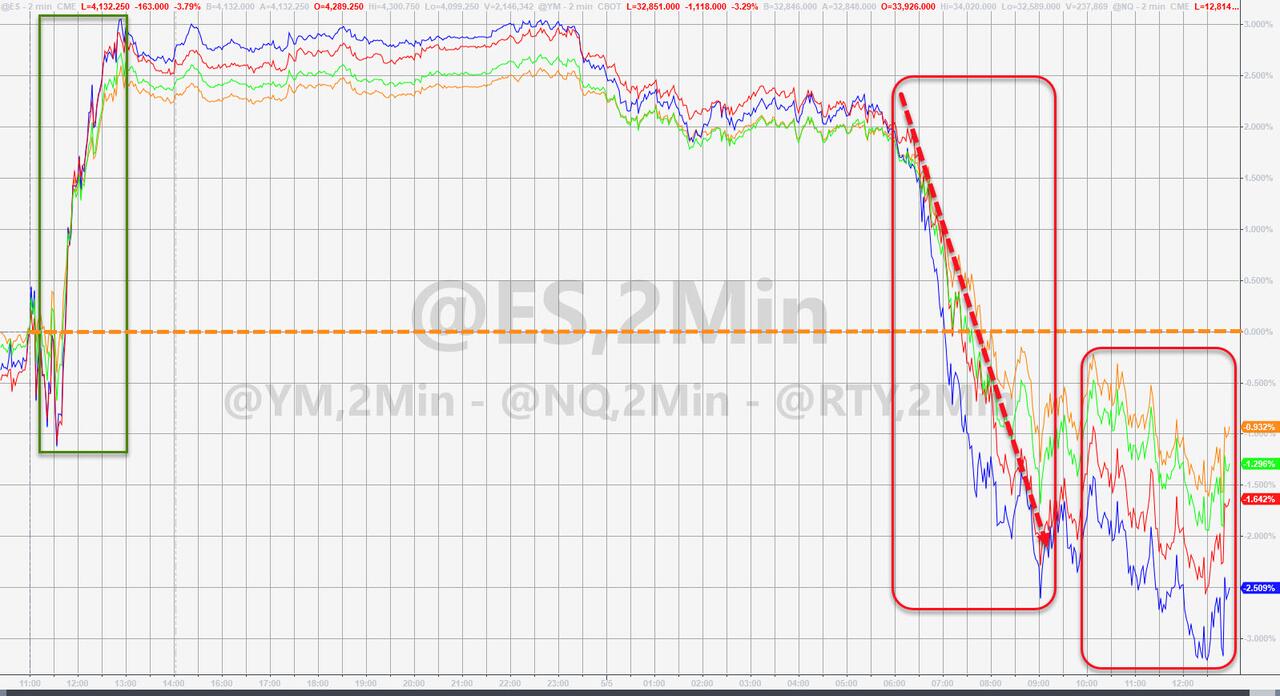
- Remember yesterday was the best performance for a Fed rate-hike day since 1978!
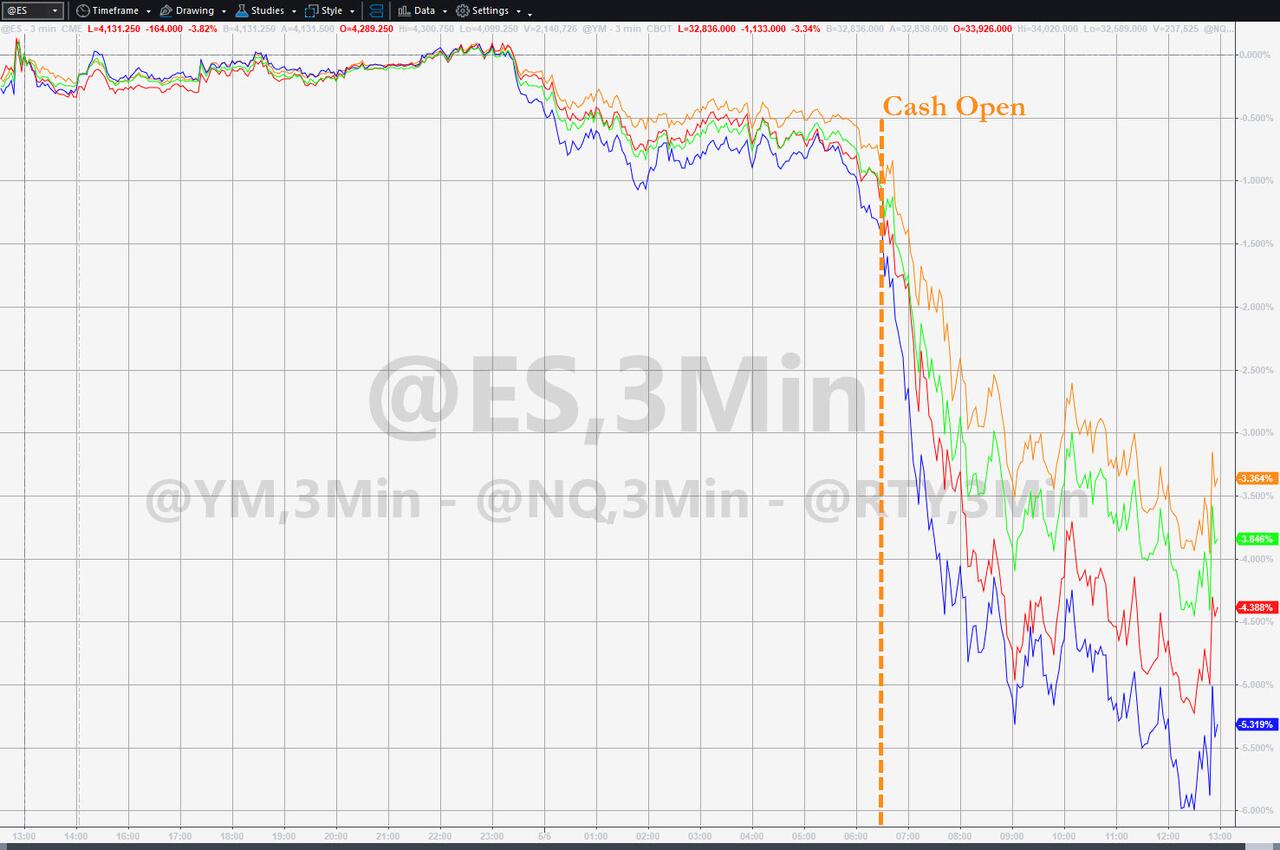
- And today, the Nasdaq 100 Index fell 6% at its lows, the most since March 2020…
- …fully reversing yesterday’s post-FOMC gains
In the past week we have had:
- Friday: biggest drop since June 2020
- Wednesday: biggest surge since May 2020
- Thursday: biggest drop since June 2020
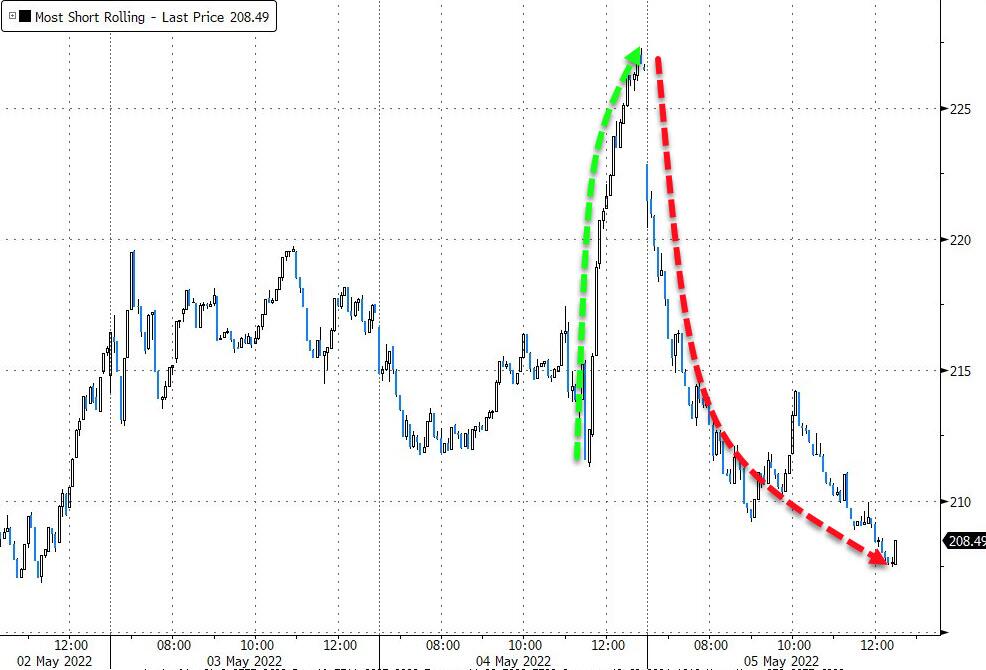
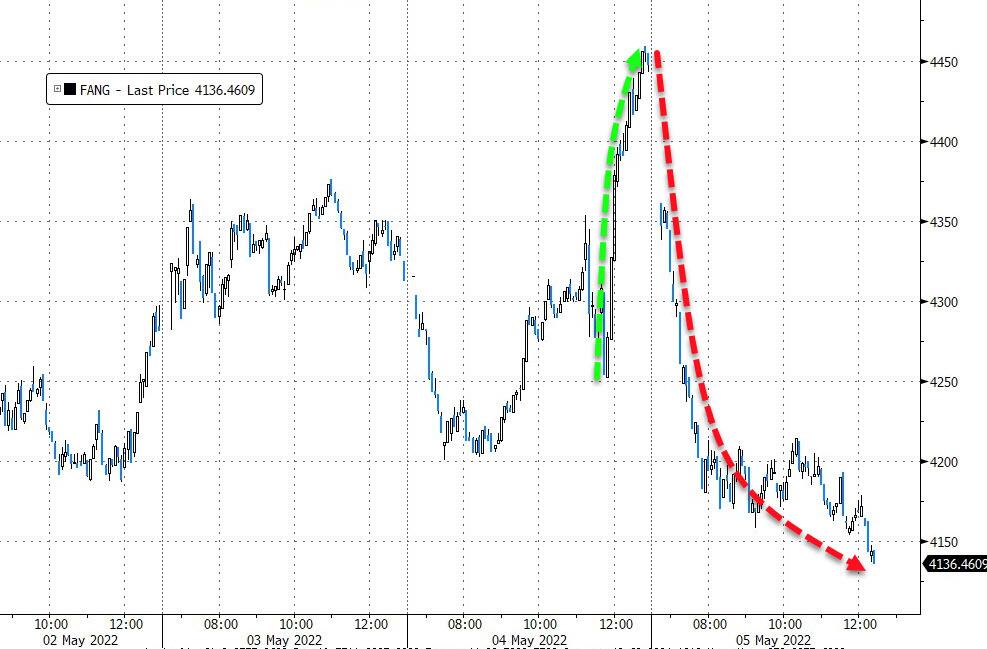
And, not helping matters today was the huge unwind of yesterday’s massive short-squeeze causing FANG stocks to chuck-up the hardest.
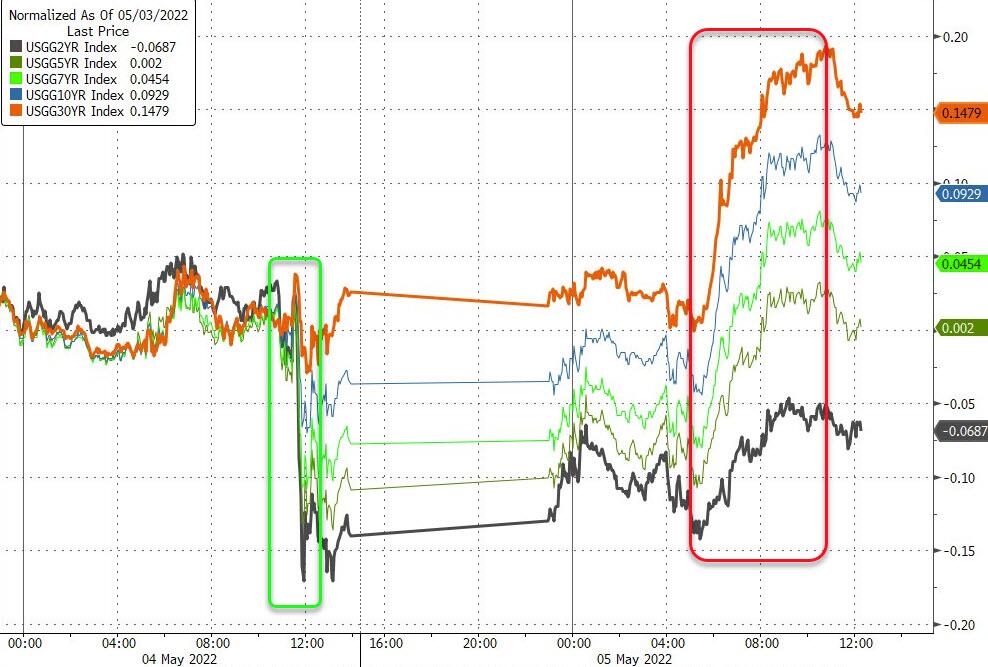
Spiking bond yields were at the center of today’s debacle with the 10-year breaking through the 3% barrier and closing up 8.2 bps at 3.045%.
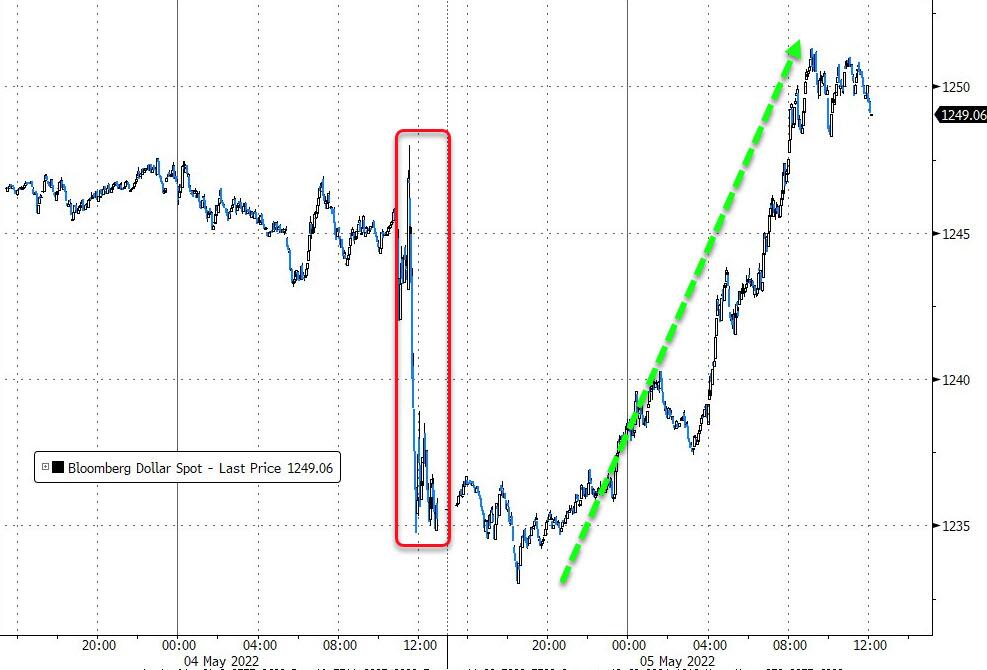
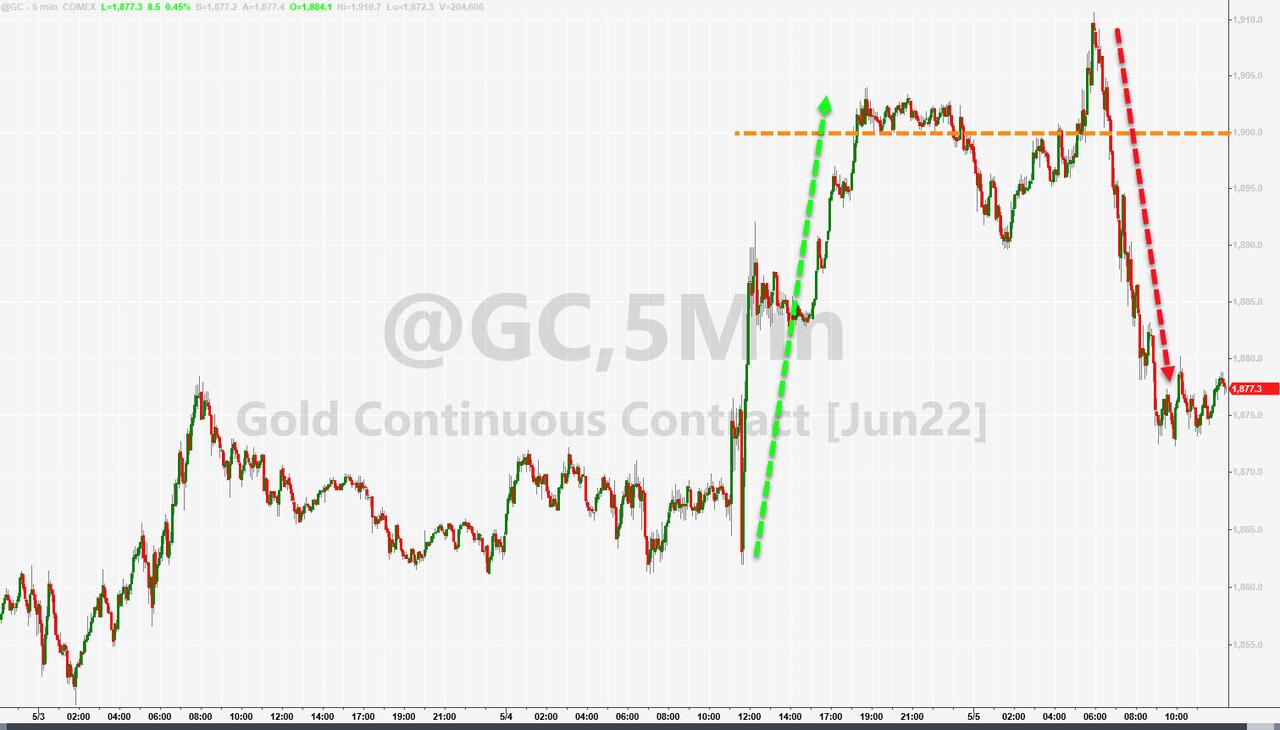
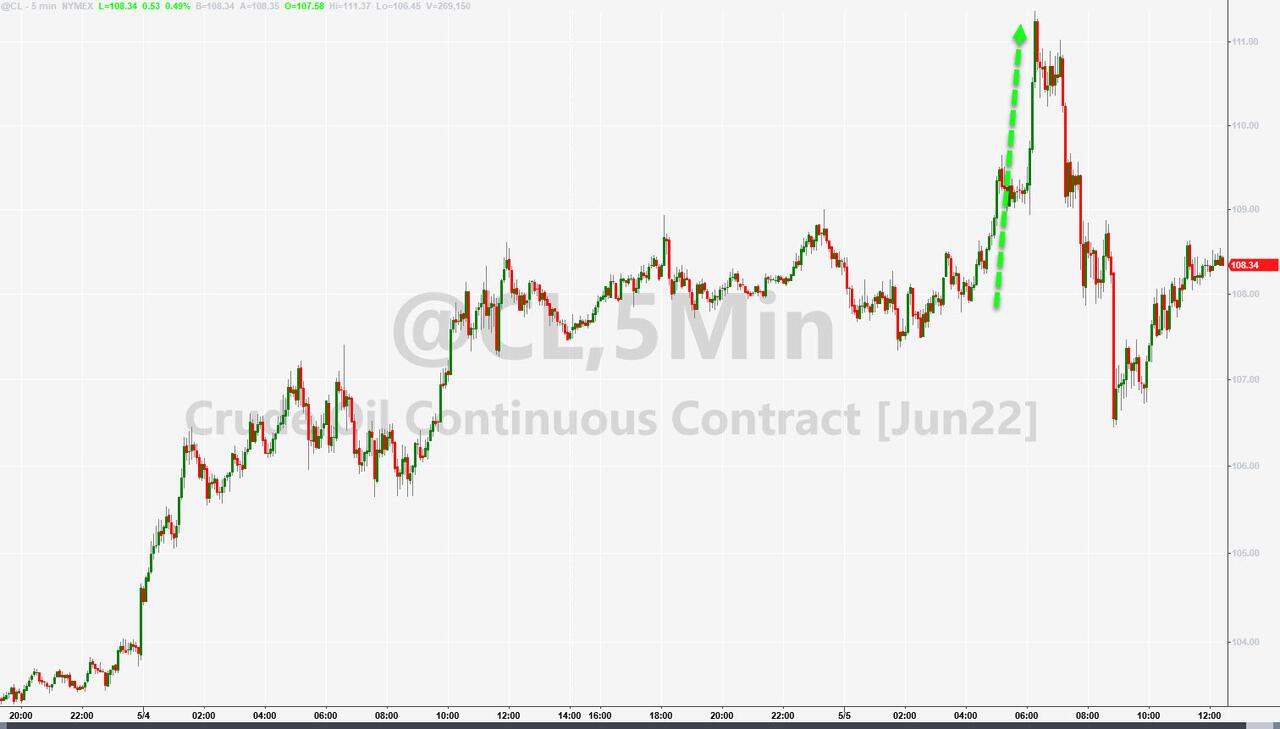
The US Dollar rebounded after yesterday’s losses, Gold jumped but could not hold on to early gains, but Crude Oil ended the day higher.
It was a wild and crazy session in the markets, and I believe this type of uncertainty is far from being over.
2. ETFs in the Spotlight
In case you missed the announcement and description of this section, you can read it here again.
It features some of the 10 broadly diversified domestic and sector ETFs from my HighVolume list as posted every Saturday. Furthermore, they are screened for the lowest MaxDD% number meaning they have been showing better resistance to temporary sell offs than all others over the past year.
The below table simply demonstrates the magnitude with which these ETFs are fluctuating above or below their respective individual trend lines (%+/-M/A). A break below, represented by a negative number, shows weakness, while a break above, represented by a positive percentage, shows strength.
For hundreds of ETF choices, be sure to reference Thursday’s StatSheet.
For this just closed-out domestic “Buy” cycle, here’s how some of our candidates have fared:
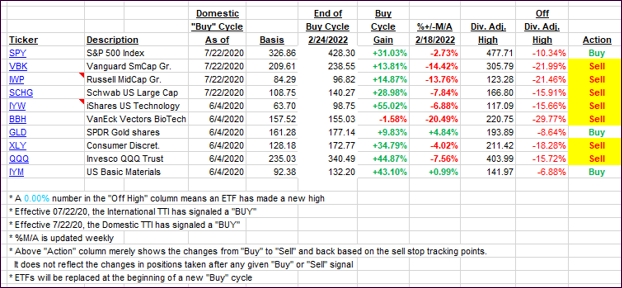
Click image to enlarge.
Again, the %+/-M/A column above shows the position of the various ETFs in relation to their respective long-term trend lines, while the trailing sell stops are being tracked in the “Off High” column. The “Action” column will signal a “Sell” once the -12% point has been taken out in the “Off High” column, which has replaced the prior -8% to -10% limits.
3. Trend Tracking Indexes (TTIs)
Our TTIs reversed and catapulted lower, as equities puked big time.
This is how we closed 05/05/2022:
Domestic TTI: -4.22% below its M/A (prior close -1.25%)—Sell signal effective 02/24/2022.
International TTI: -5.99% below its M/A (prior close -3.90%)—Sell signal effective 03/08/2022.
Disclosure: I am obliged to inform you that I, as well as my advisory clients, own some of the ETFs listed in the above table. Furthermore, they do not represent a specific investment recommendation for you, they merely show which ETFs from the universe I track are falling within the specified guidelines.
All linked charts above are courtesy of Bloomberg via ZeroHedge.
Contact Ulli