
- Moving the markets
Aimless meandering best describes today’s session during which rally attempts were rebuffed with the major indexes dropping, bouncing off their respective unchanged lines and ending up moderately in the green.
Ahead of the Fed’s decision on interest rates tomorrow, the market environment was one of nervousness with the tug-of-war continuing between those traders who believe “the bottom” is in vs. the bears who are anxious about the potential of a sharp rebound rally.
With opposite forces at play, namely a slowing economy and a tightening Fed, hedge fund manager Paul Tudor Jones took time out from his busy schedule to utter these words of wisdom that “capital preservation should be the main goal for investors.”
No kidding. This is the purpose of engaging in Trend Tracking and the use of trailing sell stops to begin with, because there will always be periods where risk and uncertainty have risen to an all-time high, such as we are experiencing now.
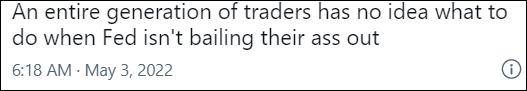
Of course, not everyone understands the prudence of riding out bearish periods on the sidelines, which prompted ZeroHedge to tweet this keen and spot-on observation:
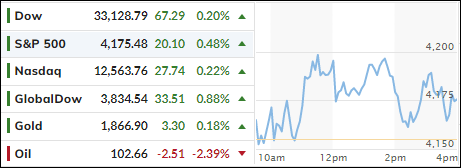
Bond yields dropped and popped, but the 10-year stopped short of reaching its 3% level again. Energy took top billing with VDE adding a solid +3.05%. Gold found some stability as well but only gained a tad and remains short of reaching its $1,900 level.
On the economic side, ZH reported that a record number of Americans just quit their job, as Job Openings surpassed unemployed workers by a record 5.6 million causing hedge fund manager Jeff Gundlach to quip:
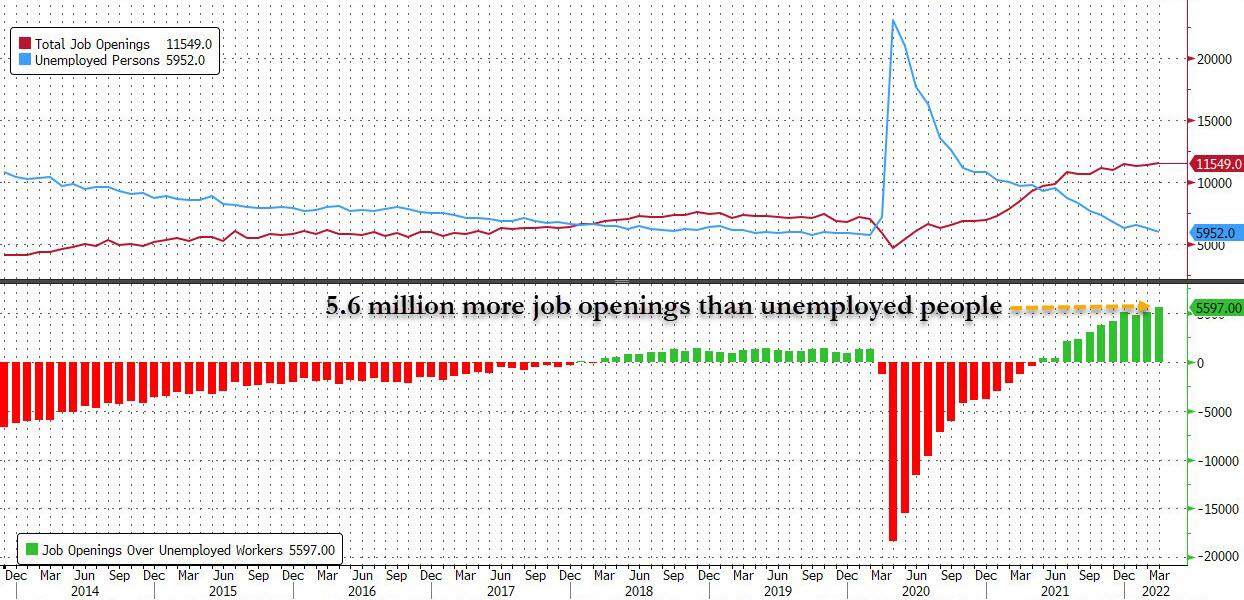

Now it’s up to the Fed to determine future market direction, which will be based on the aggressiveness with which it will battle the inflation monster.
2. ETFs in the Spotlight
In case you missed the announcement and description of this section, you can read it here again.
It features some of the 10 broadly diversified domestic and sector ETFs from my HighVolume list as posted every Saturday. Furthermore, they are screened for the lowest MaxDD% number meaning they have been showing better resistance to temporary sell offs than all others over the past year.
The below table simply demonstrates the magnitude with which these ETFs are fluctuating above or below their respective individual trend lines (%+/-M/A). A break below, represented by a negative number, shows weakness, while a break above, represented by a positive percentage, shows strength.
For hundreds of ETF choices, be sure to reference Thursday’s StatSheet.
For this just closed-out domestic “Buy” cycle, here’s how some of our candidates have fared:
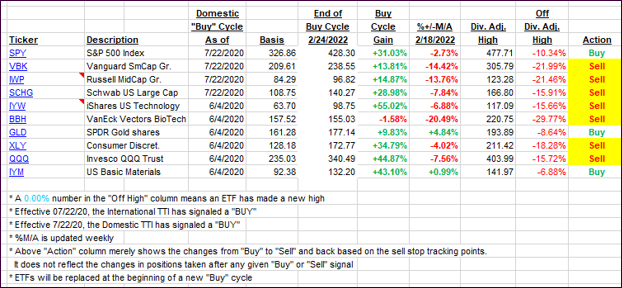
Click image to enlarge.
Again, the %+/-M/A column above shows the position of the various ETFs in relation to their respective long-term trend lines, while the trailing sell stops are being tracked in the “Off High” column. The “Action” column will signal a “Sell” once the -12% point has been taken out in the “Off High” column, which has replaced the prior -8% to -10% limits.
3. Trend Tracking Indexes (TTIs)
Our TTIs improved, as the markets bounced moderately ahead of the Fed decision.
This is how we closed 05/03/2022:
Domestic TTI: -3.92% below its M/A (prior close -4.71%)—Sell signal effective 02/24/2022.
International TTI: -5.63% below its M/A (prior close -6.51%)—Sell signal effective 03/08/2022.
Disclosure: I am obliged to inform you that I, as well as my advisory clients, own some of the ETFs listed in the above table. Furthermore, they do not represent a specific investment recommendation for you, they merely show which ETFs from the universe I track are falling within the specified guidelines.
All linked charts above are courtesy of Bloomberg via ZeroHedge.
Contact Ulli