
- Moving the markets
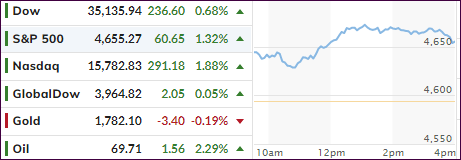
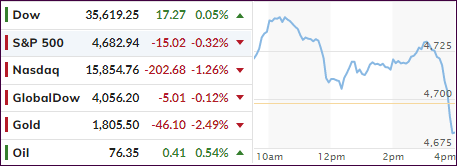
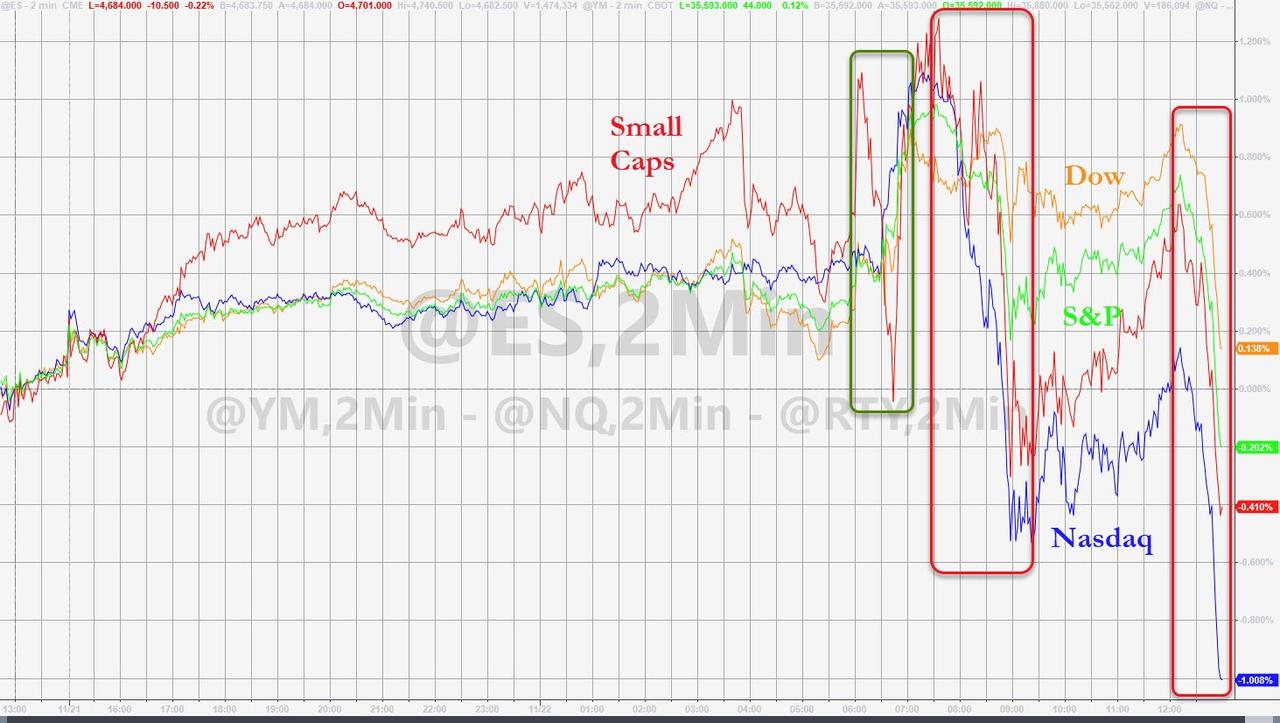
The Dow was the most volatile of the major indexes by giving up an early 380-point gain and retreating almost all the way back to the unchanged line. The sudden turnaround happened with lightning speed after Biden’s announcement that Covid lockdowns were not needed for now, despite MSM fearmongering about the latest omicron variant.
Added Fundstrat’s Tom Lee:
“As with the case for Beta and Delta variants, the ‘bark’ has proven worse than the bite in each of those precedent instances. The market carnage, in our view, will be short-lived and transitory.”
That’s all it took, and the bears had their way with a ramp-a-thon designed to make up for some of Friday’s losses. The mission succeeded, as the Nasdaq took the lead with a solid 1.88% comeback with marquee names like Microsoft, Amazon, and Apple evolving as the winners.
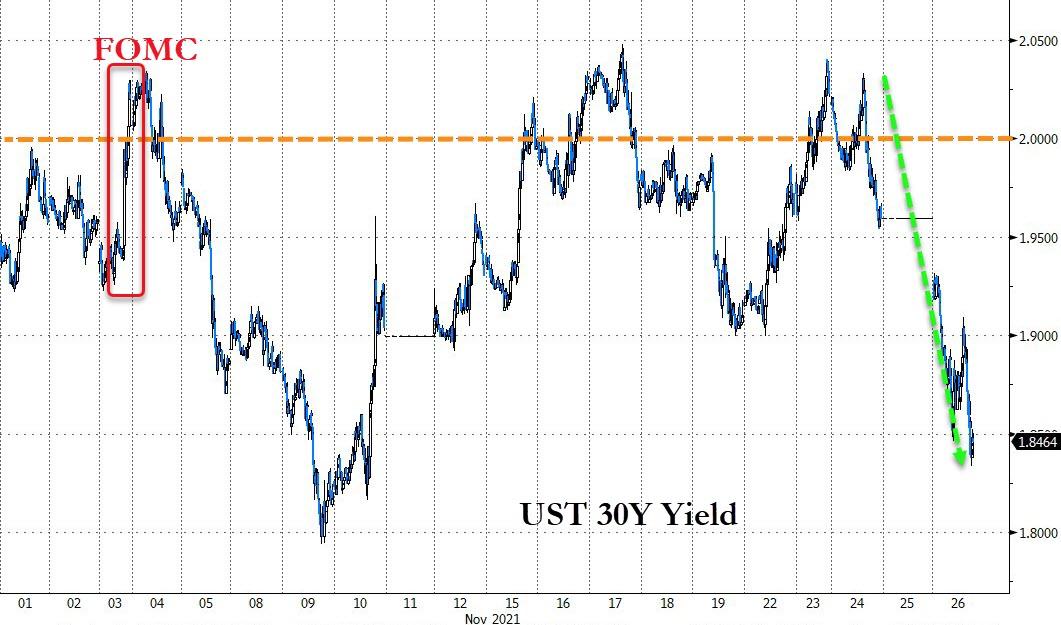
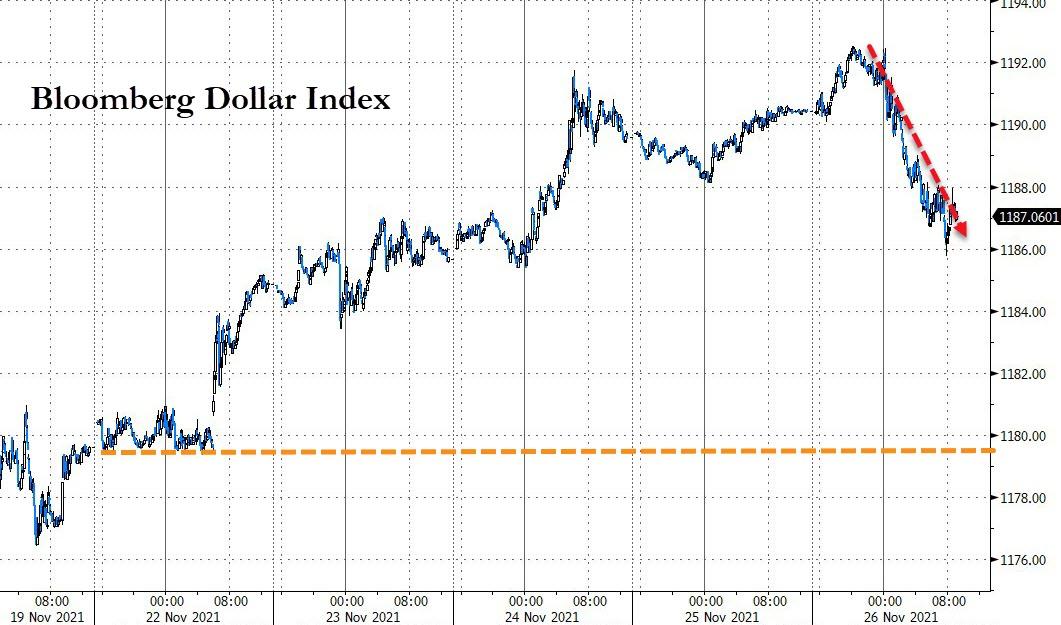
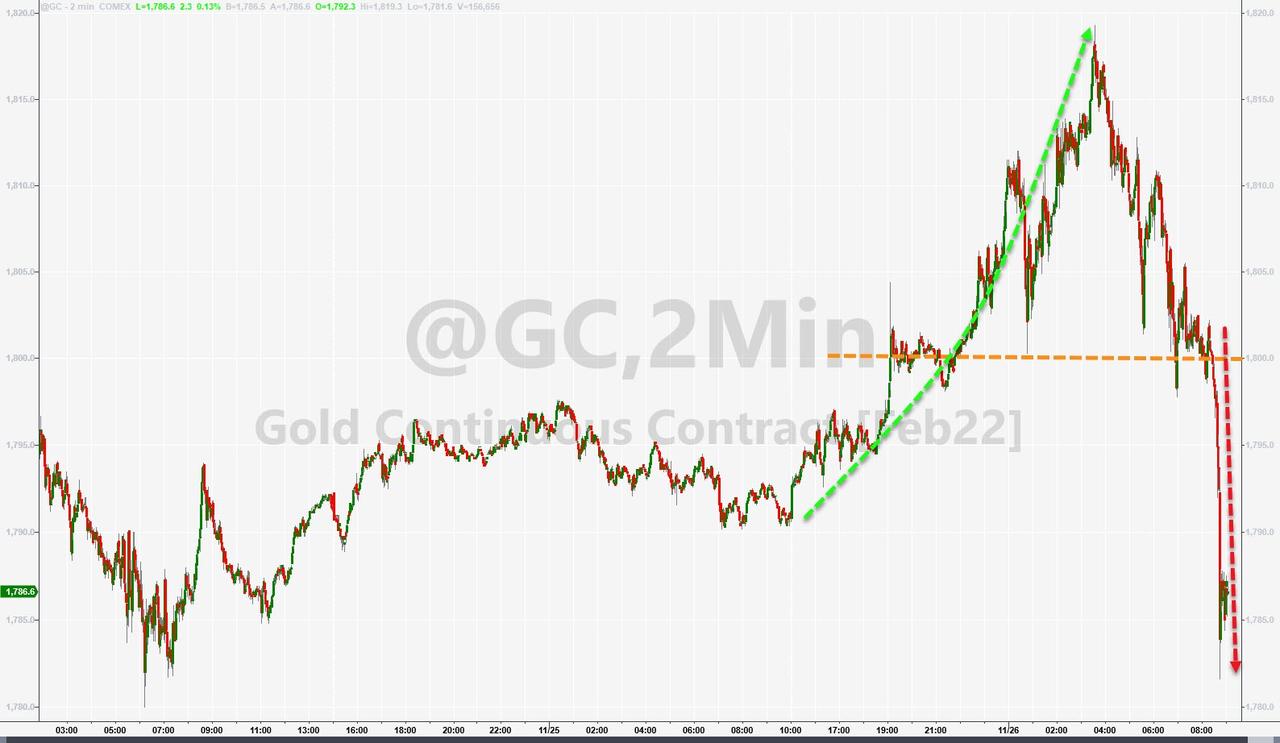
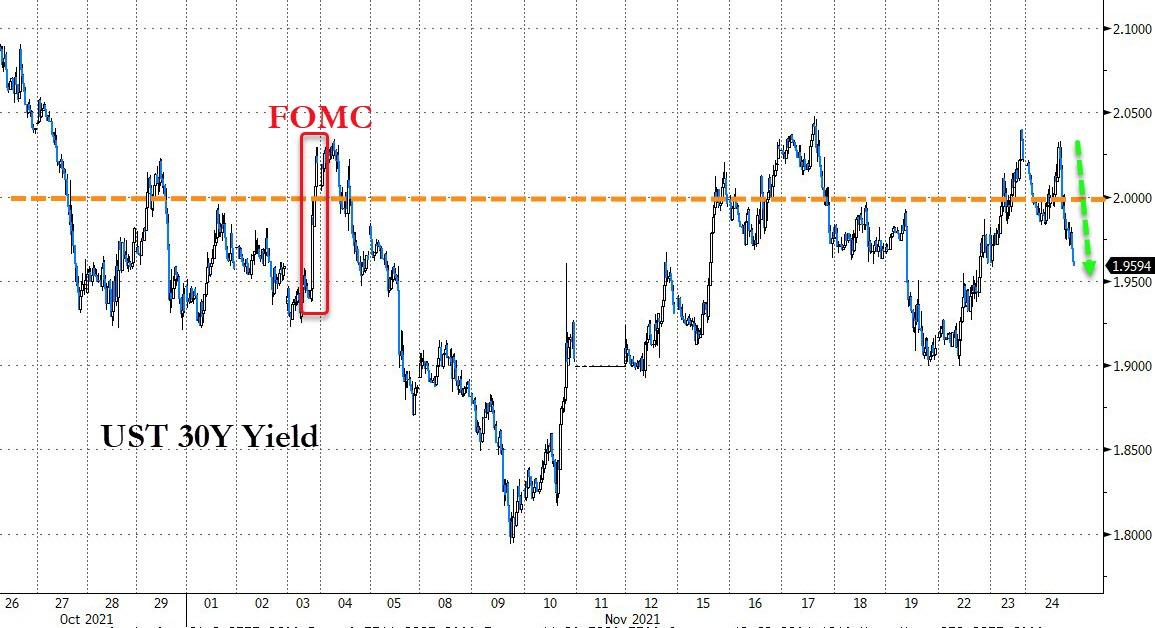
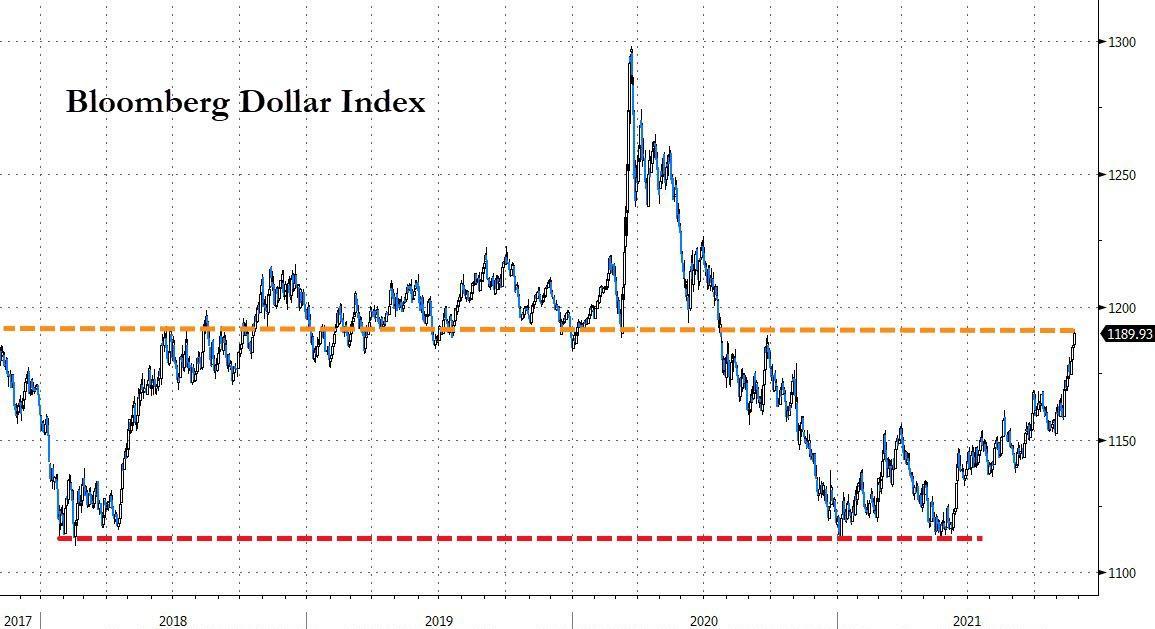
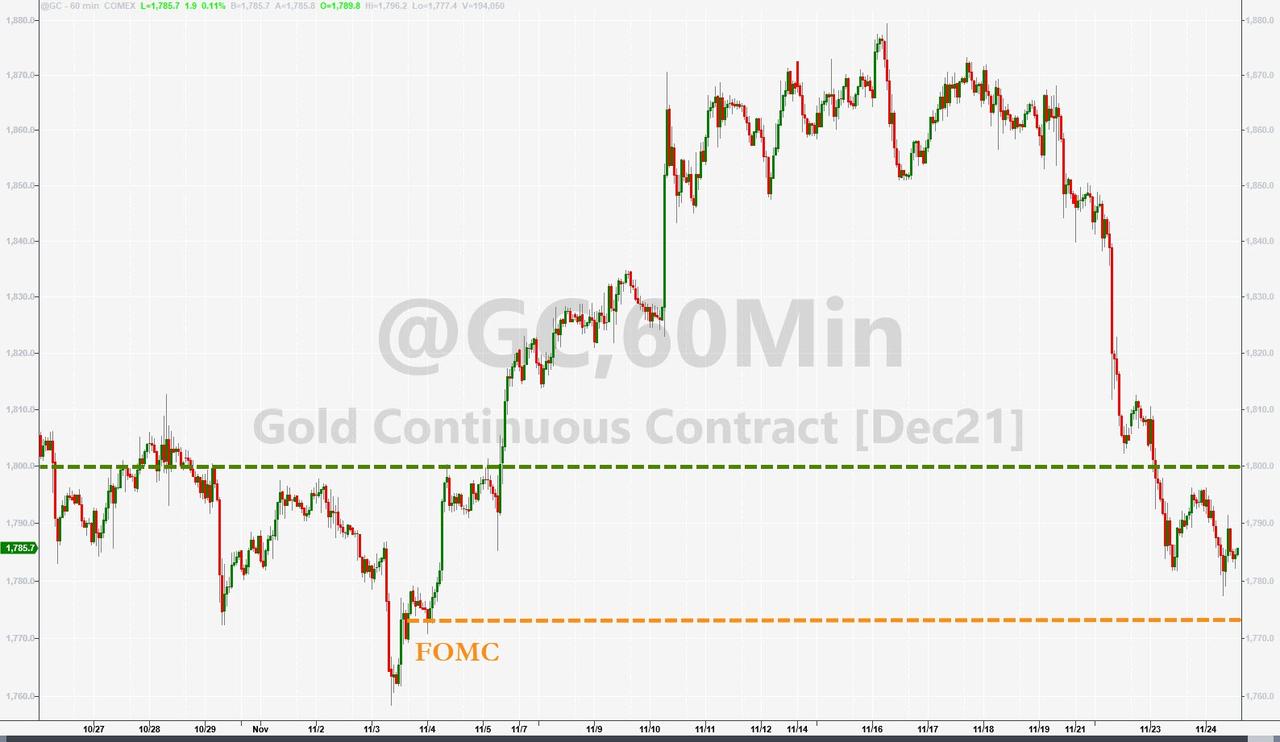
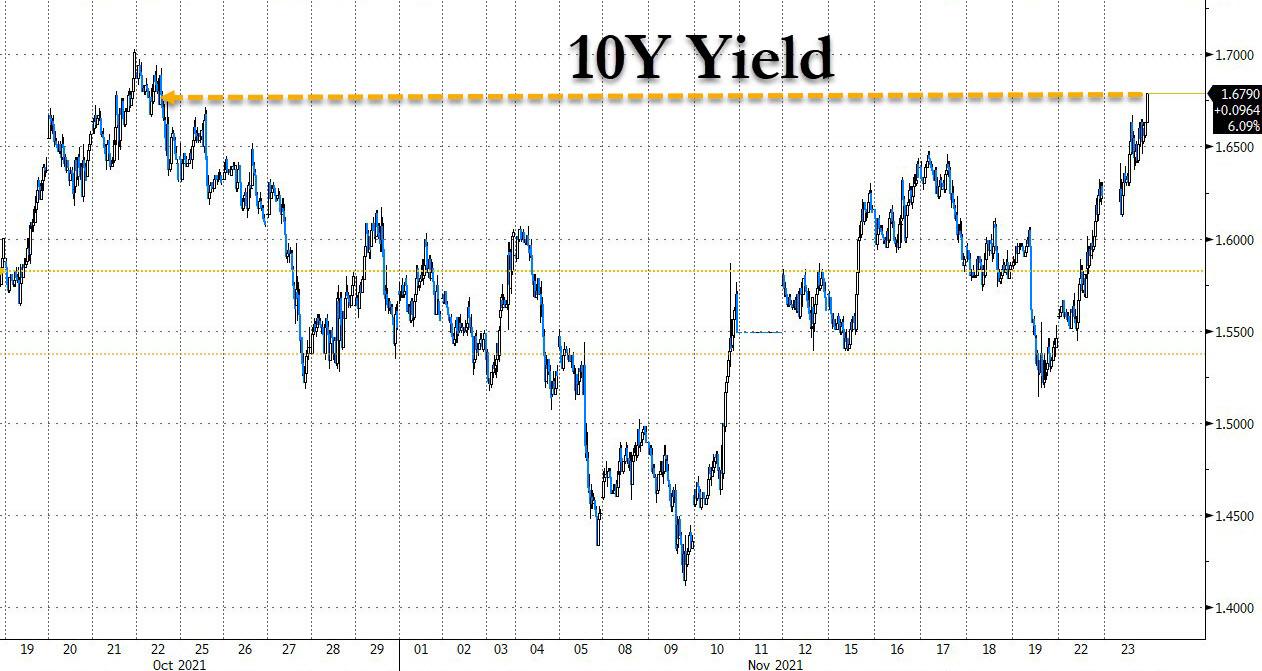
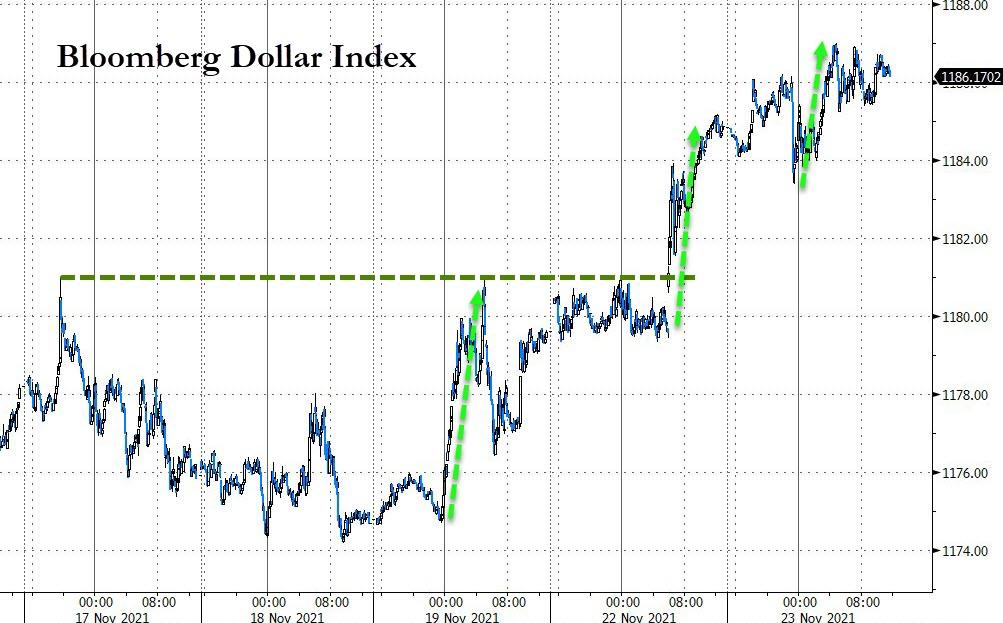
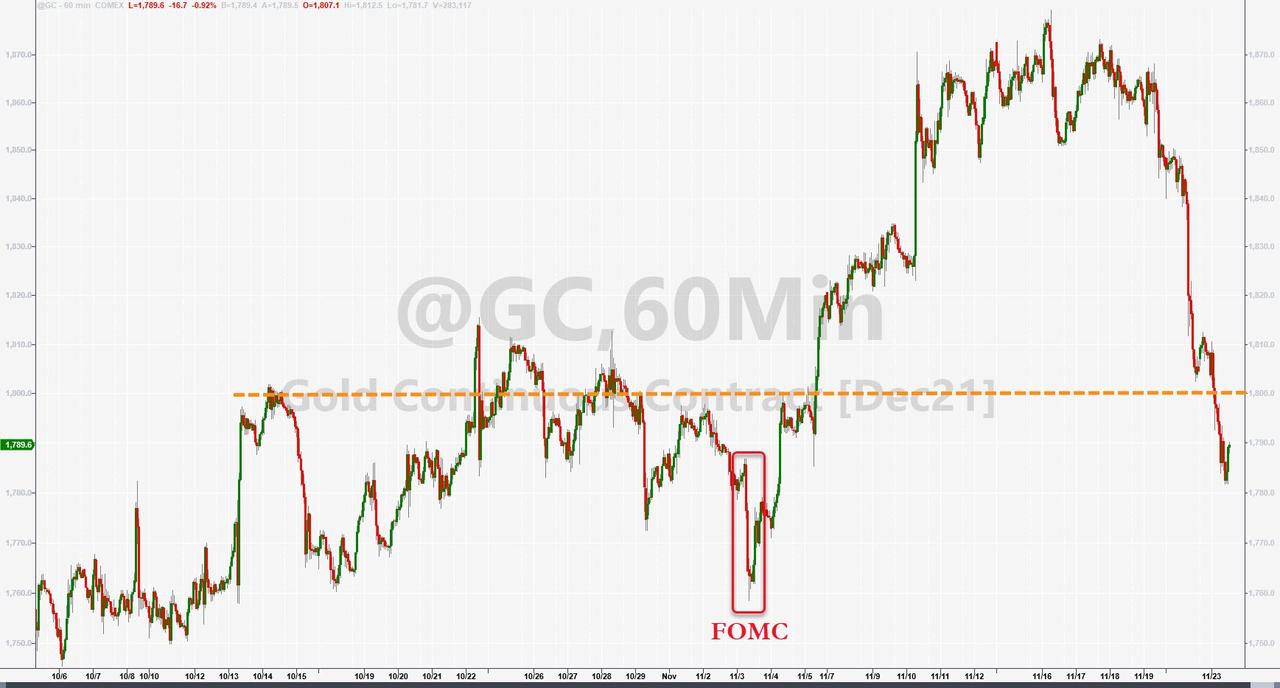
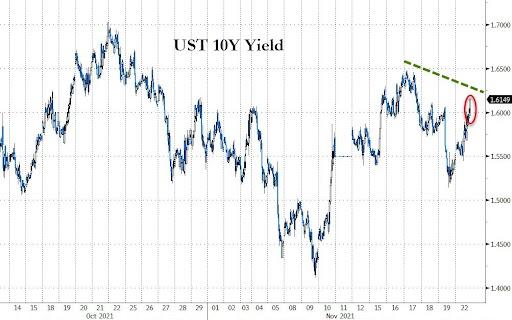
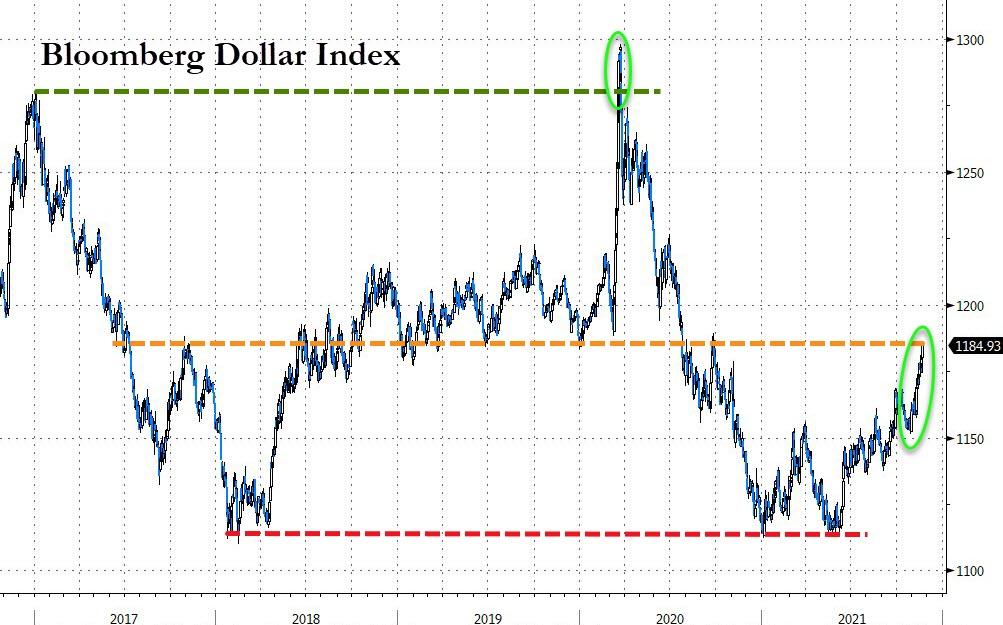
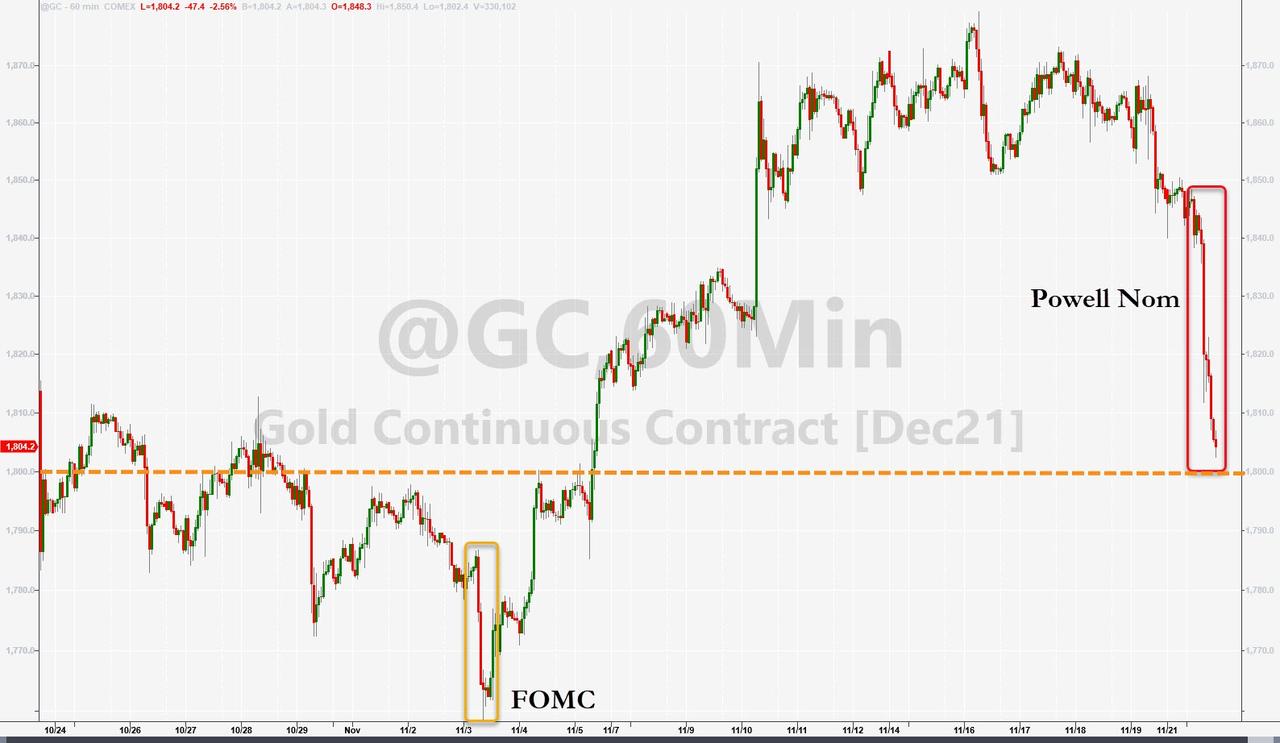
Bond yields moved higher but slumped into the close with the 10-year ending at 1.52%. The US Dollar rode a roller coaster and rallied but only by a moderate 0.18% causing gold to tread water.
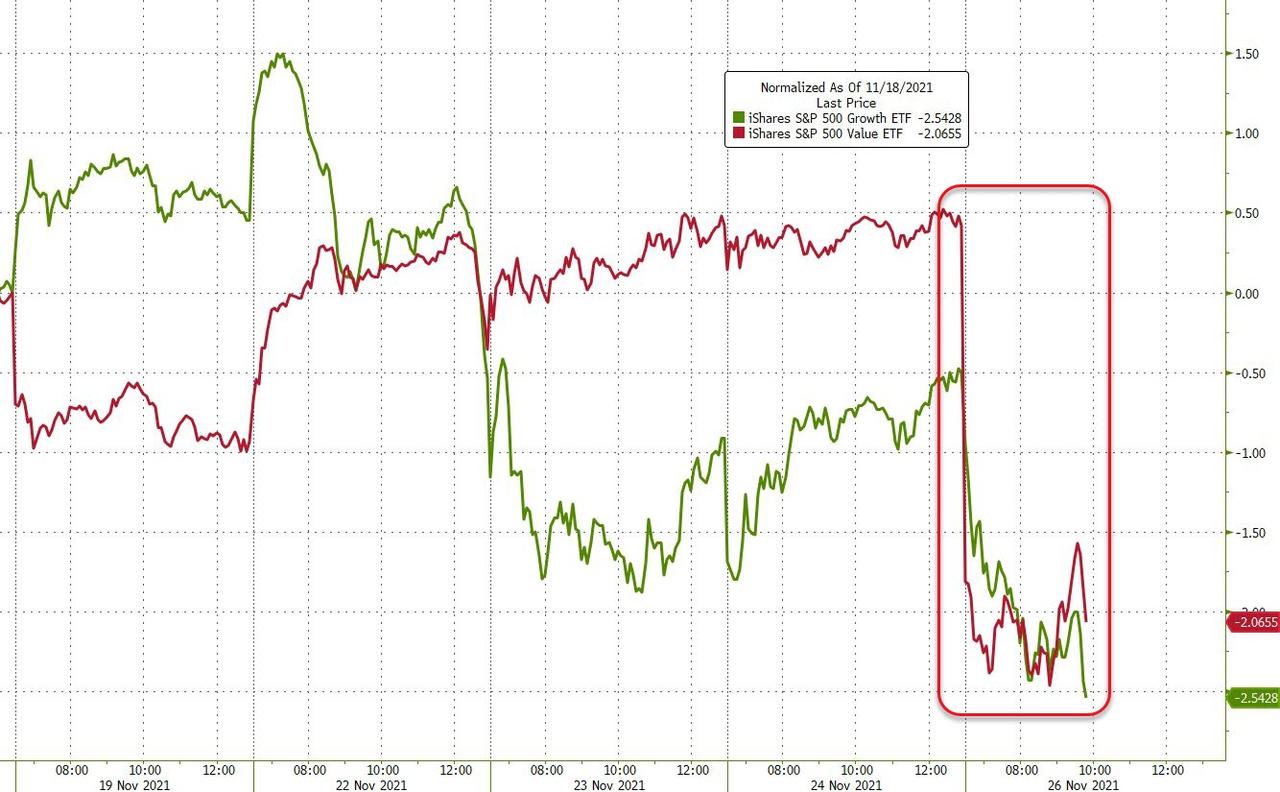
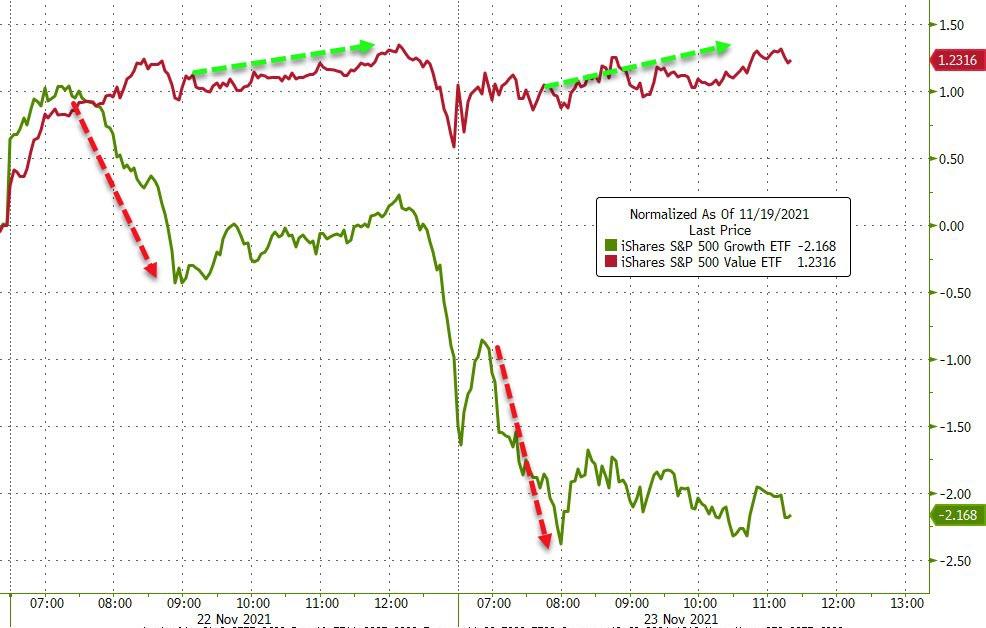
The ongoing battle between “growth” and “value” was clearly won by the former with RPG sporting a 1.95% gain, while the latter, as measured by RPV, gave back 0.17%.
On deck this Friday will be the all-important jobs report with economists expecting optimistic gains of 581k new jobs added in November.
Hmm…
Read More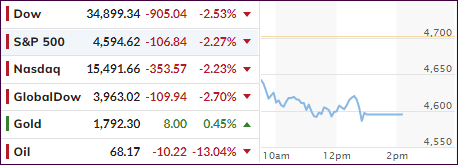