
ETF Tracker StatSheet
You can view the latest version here. (Not updated due to Holiday)
A RED AND BLACK FRIDAY
- Moving the markets
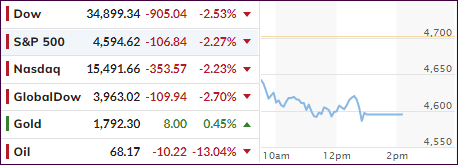
Last night, when checking the futures markets, it became clear to me that I had to change my plans and write today’s market commentary. Things looked very bleak, and this morning’s opening confirmed that the bears had taken control with the Dow down over 1,000 points at one moment in time.
The culprit for this sudden change in sentiment was an announcement by the WHO that a new Covid variant had been detected in South Africa, which allegedly contains mutations more contagious than the delta variant. Of course, that was an event the MSM could simply not let go, so the usual fearmongering was effective in pulling the markets off their lofty levels.
Considering the YTD performance of the major indexes, they ended up giving back less than 2.5%, which I consider a normal correction. The exception was the international arena, where our index broke below its long-term trend line, as you can see in section 3 below.
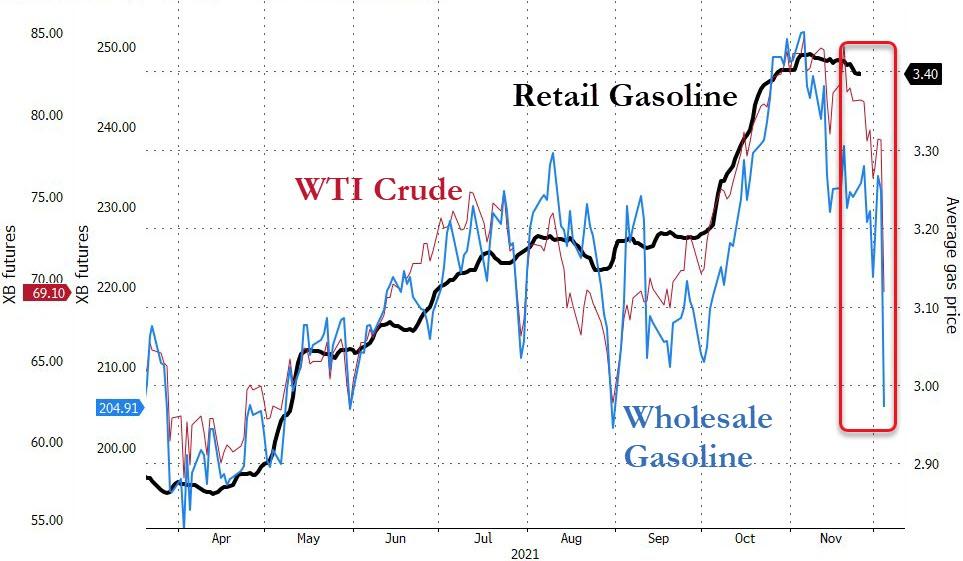
The effect on the various sectors was “impressive.” Crude oil did its best imitation of a swan dive, ending the session down 13% at $68, thereby giving hope that this crash will offer some relief at the gas pump.
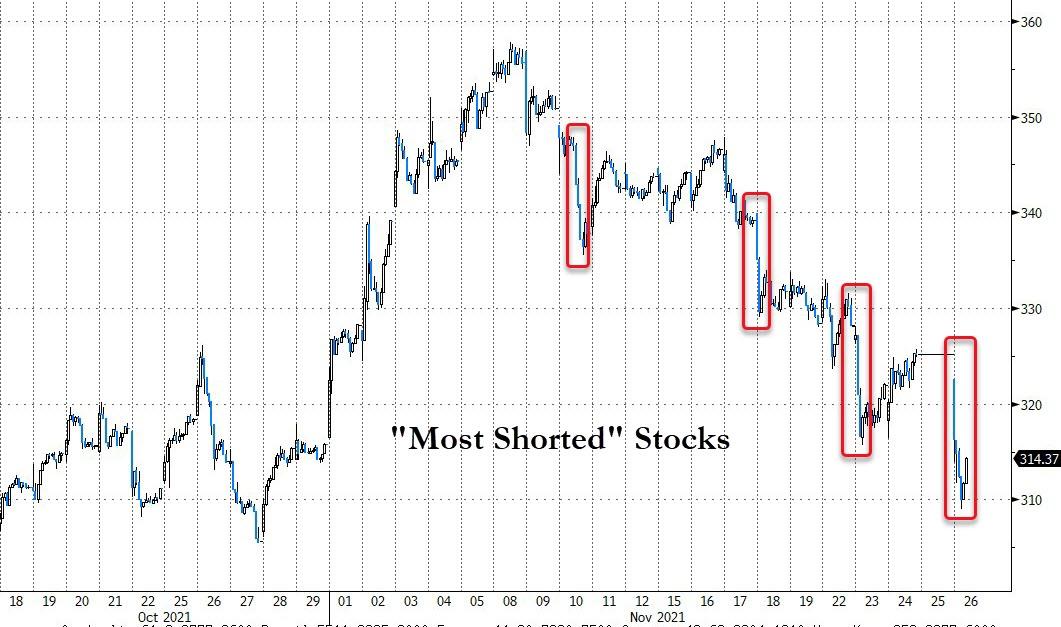
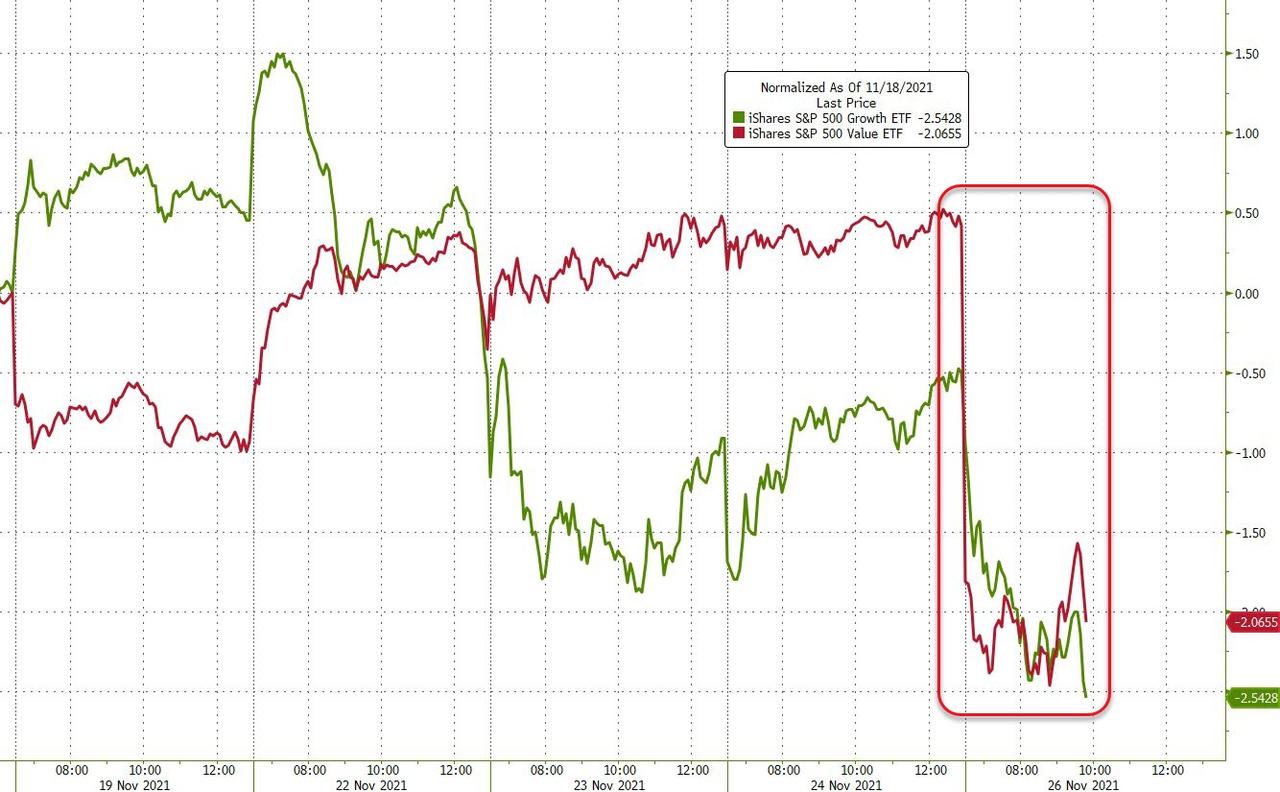
Most shorted stocks did again what they are supposed to, namely go lower, especially during the absence of a short squeeze. “Growth” and “Value” both got hammered this week, but SmallCaps fared even worse by having their most horrible day since June 2020.
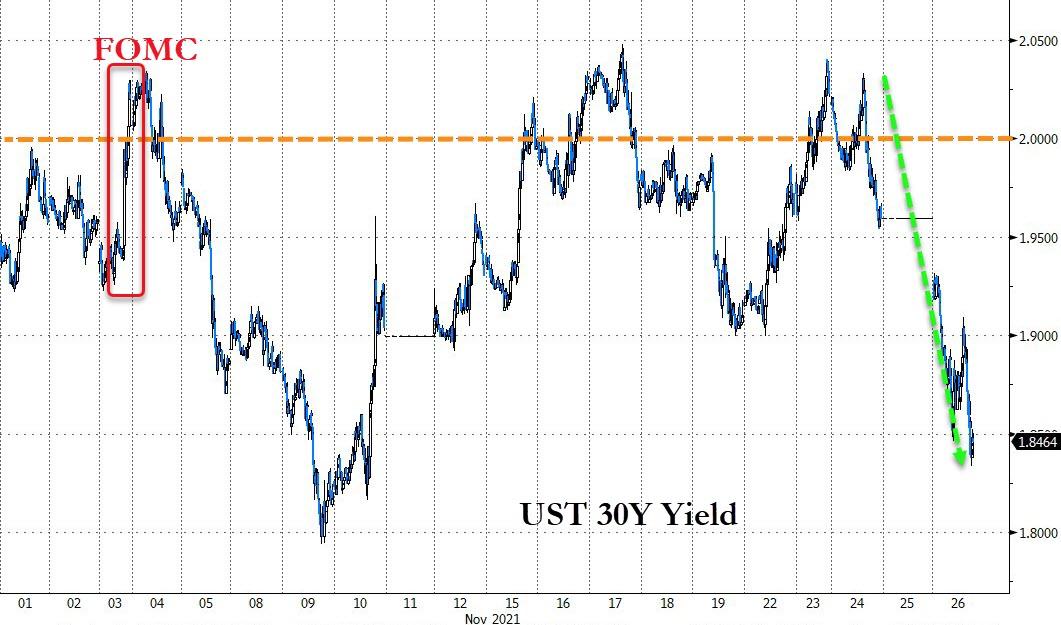
As common during market uncertainty, bonds rallied for a change as yields collapsed with the 30-year plummeting back below 2%, while the 10-year plunged over 16 basis points to end the day at 1.48%.
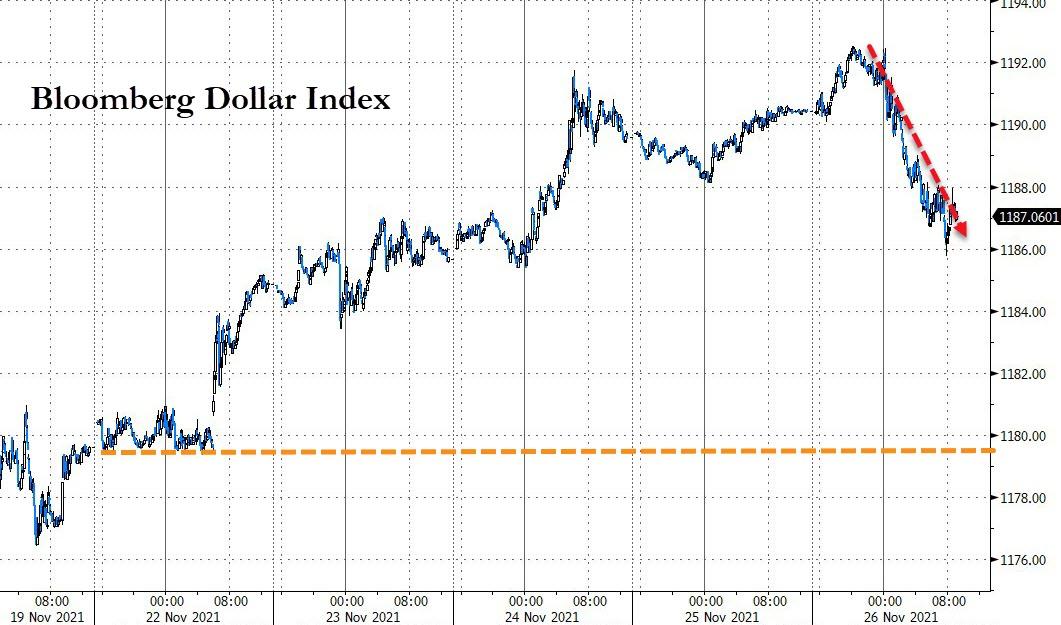
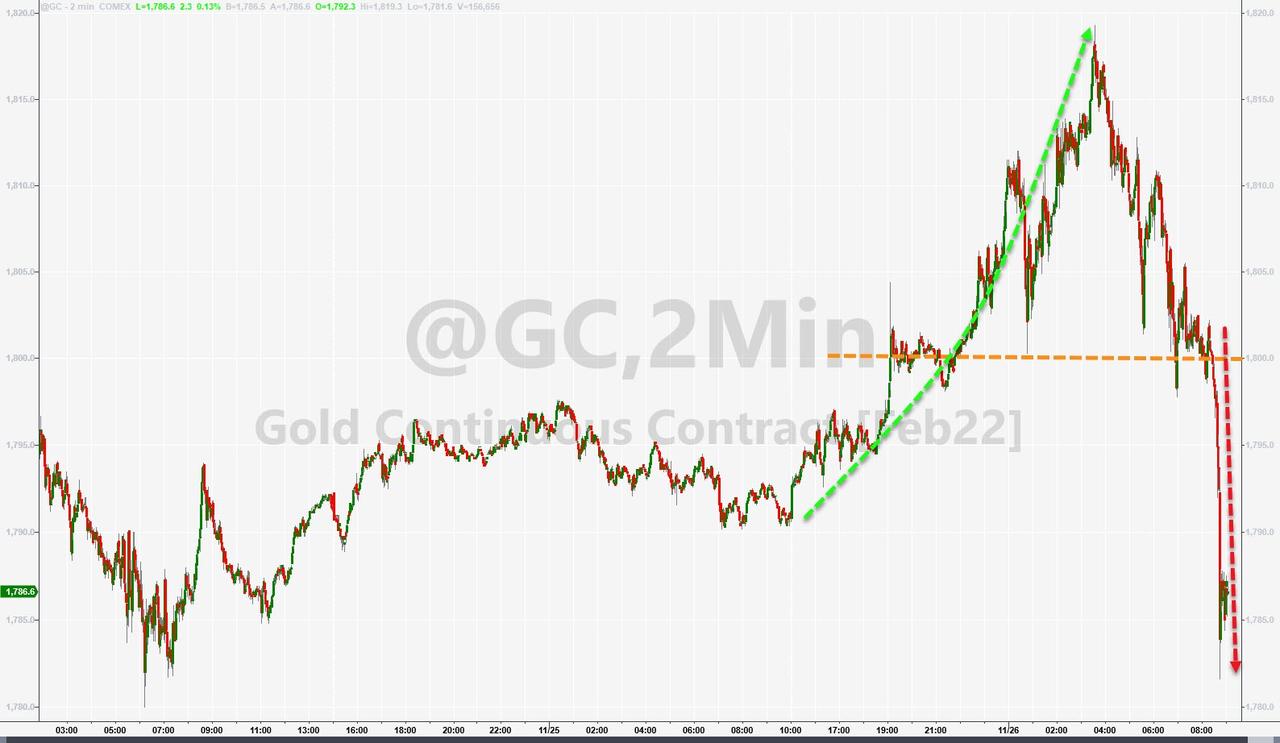
The US Dollar Index followed suit but, while having its biggest drop in a month, managed to close higher on the week. Gold initially surged as the tumultuous session started, got hit with a wave of selling late in the session, but eked out a 0.45% gain.
It was a wild day during this Holiday shortened session. This move could simply be a one-off event with the markets regaining upside momentum next week. On other hand, analyst Peter Schiff uttered these words of caution:
“The Fed no longer has the ability to stimulate the economy by creating #inflation. Instead of QE and ZIRP making people wealthier by pushing up asset prices, it now makes them poorer by pushing up consumer prices instead. Monetary stimulus has become a sedative. It’s game over!”
2. ETFs in the Spotlight
In case you missed the announcement and description of this section, you can read it here again.
It features some of the 10 broadly diversified domestic and sector ETFs from my HighVolume list as posted every Saturday. Furthermore, they are screened for the lowest MaxDD% number meaning they have been showing better resistance to temporary sell offs than all others over the past year.
The below table simply demonstrates the magnitude with which these ETFs are fluctuating above or below their respective individual trend lines (%+/-M/A). A break below, represented by a negative number, shows weakness, while a break above, represented by a positive percentage, shows strength.
For hundreds of ETF choices, be sure to reference Thursday’s StatSheet.
For this current domestic “Buy” cycle, here’s how some our candidates have fared:

Click image to enlarge.
Again, the %+/-M/A column above shows the position of the various ETFs in relation to their respective long-term trend lines, while the trailing sell stops are being tracked in the “Off High” column. The “Action” column will signal a “Sell” once the -8% point has been taken out in the “Off High” column. For more volatile sector ETFs, the trigger point is -10%.
3. Trend Tracking Indexes (TTIs)
Our TTIs took a dive with the International one breaking its trend line to the downside. It barely crossed into bear market territory, so I want to see some staying power “below the line” before issuing a “Sell” signal.
In my advisor practice, we don’t hold any international ETFs, so any signal would have no effect on our holdings.
However, over the past 30 years, this index has often been functioning as the canary in the coalmine by alerting us that trouble for the domestic markets might lurk on deck. That’s why I follow this indicator and its sudden directional changes with an eagle eye.
This is how we closed 11/26/2021:
Domestic TTI: +3.70% above its M/A (prior close +6.85%)—Buy signal effective 07/22/2020.
International TTI: -0.88% below its M/A (prior close +1.89%)—Buy signal effective 07/22/2020.
Disclosure: I am obliged to inform you that I, as well as my advisory clients, own some of the ETFs listed in the above table. Furthermore, they do not represent a specific investment recommendation for you, they merely show which ETFs from the universe I track are falling within the specified guidelines.
All linked charts above are courtesy of Bloomberg via ZeroHedge.
———————————————————-
WOULD YOU LIKE TO HAVE YOUR INVESTMENTS PROFESSIONALLY MANAGED?
Do you have the time to follow our investment plans yourself? If you are a busy professional who would like to have his portfolio managed using our methodology, please contact me directly or get more details here.
Contact Ulli