ETF Tracker Newsletter For June 10, 2022

Ulli ETF Tracker Contact

ETF Tracker StatSheet          

You can view the latest version here.

LATEST CPI READING PUMMELS STOCKS
[Chart courtesy of MarketWatch.com]

  1. Moving the markets

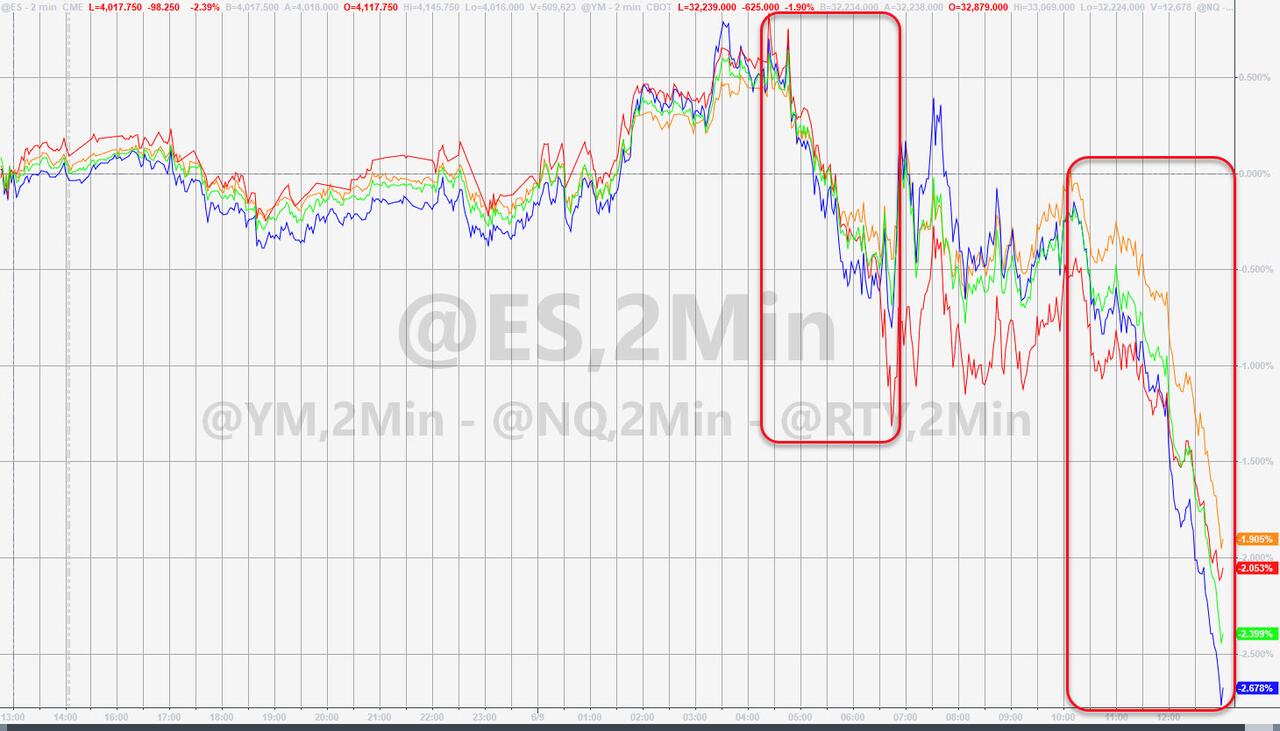
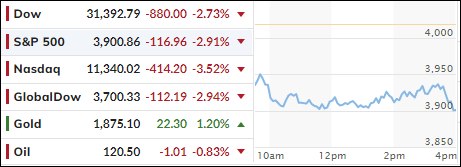
After yesterday’s spanking, which left the major indexes in the red by some +2%, with the Dow dumping over 600 points, today’s session presented another rude awakening thanks to a worse than expected CPI reading.

The Dow dove 880 points when traders realized that inflation had not peaked yet, as had been falsely assumed, and showed its worst reading in 40 years. The sell-off was broad with declining stocks outnumbering the advancing ones by a ratio of 9 to 1.

The Consumer Price Index reached its highest level since 1981, as prices were rising 8.6% YoY and 6% when excluding the food and energy components. Expectations were for 8.3% and 5.9% respectively.  

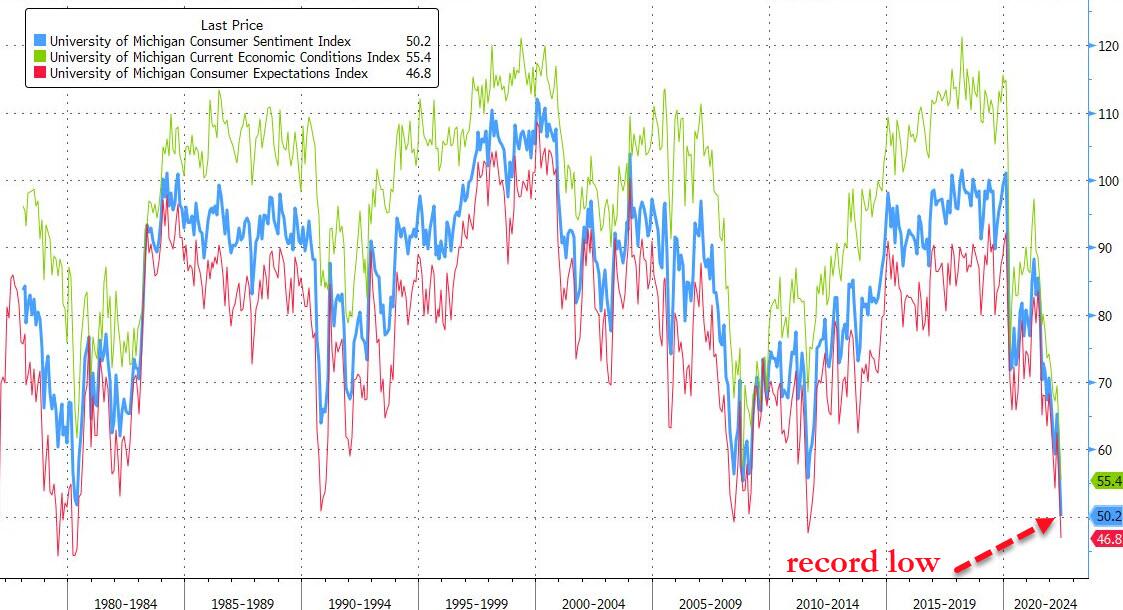
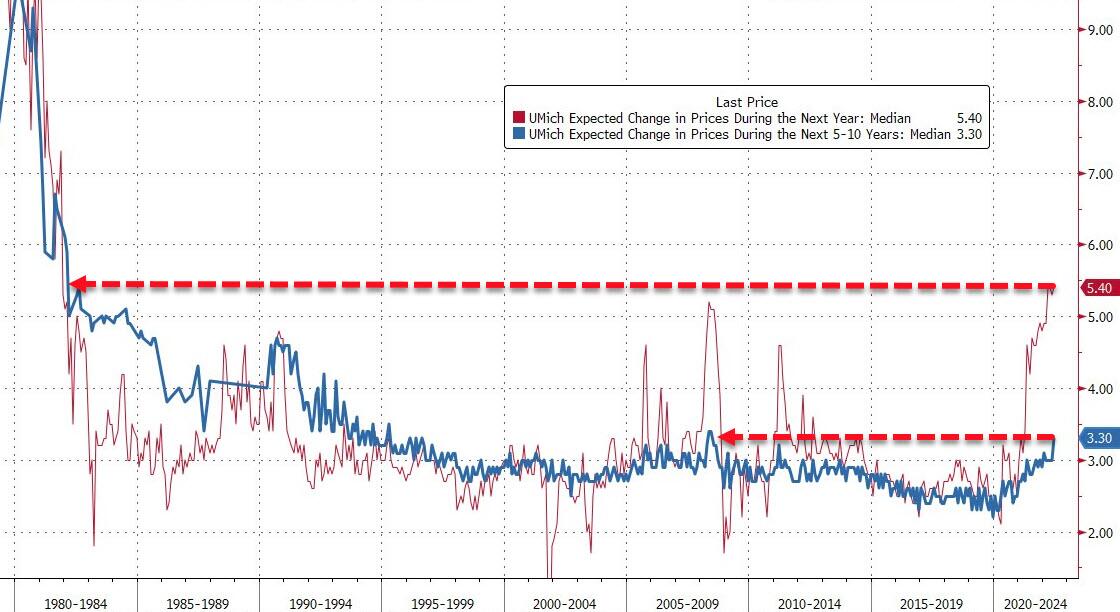
As ZeroHedge added, Consumer Sentiment collapsed to a record low by crashing from 58.4 to 50.2, which was massively below expectations of 58.1. Inflation expectations soared, while buying conditions collapsed to new lows.

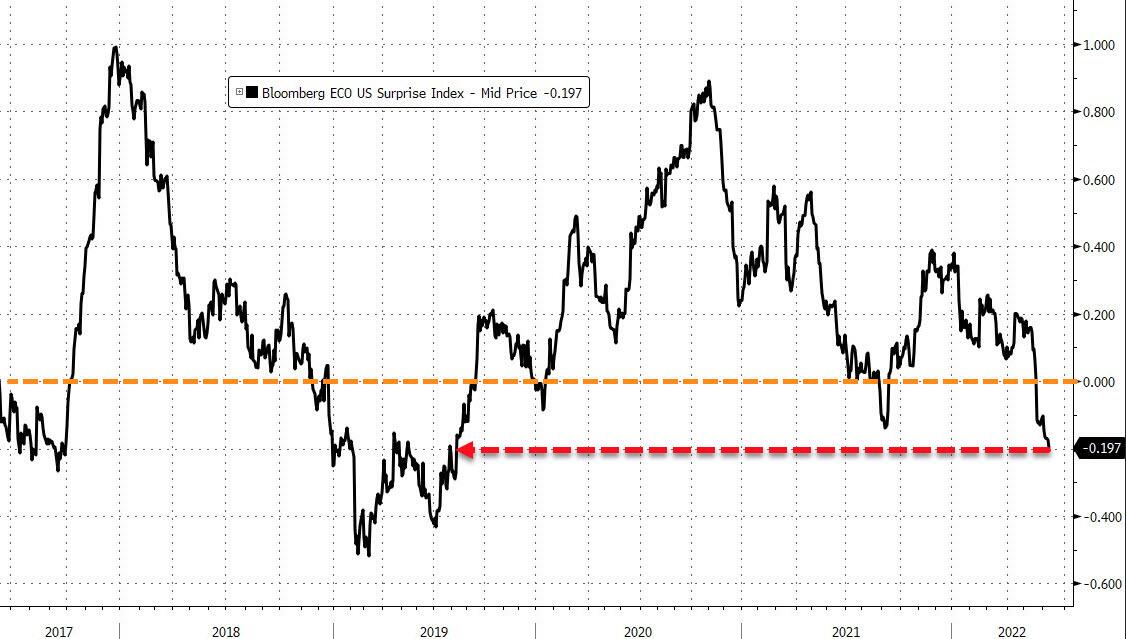
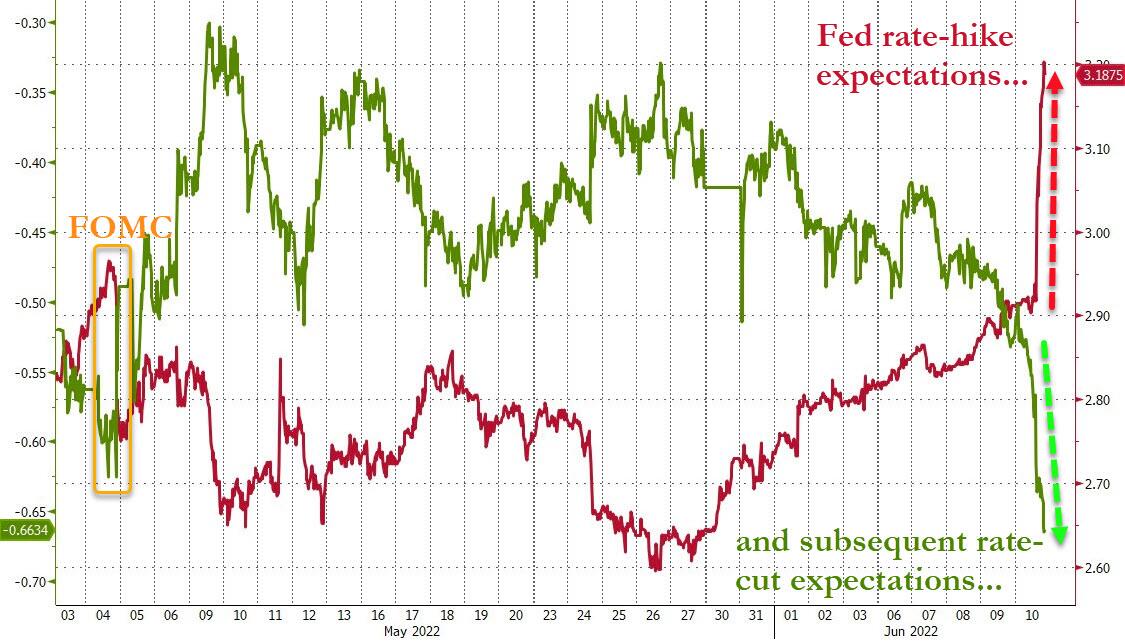
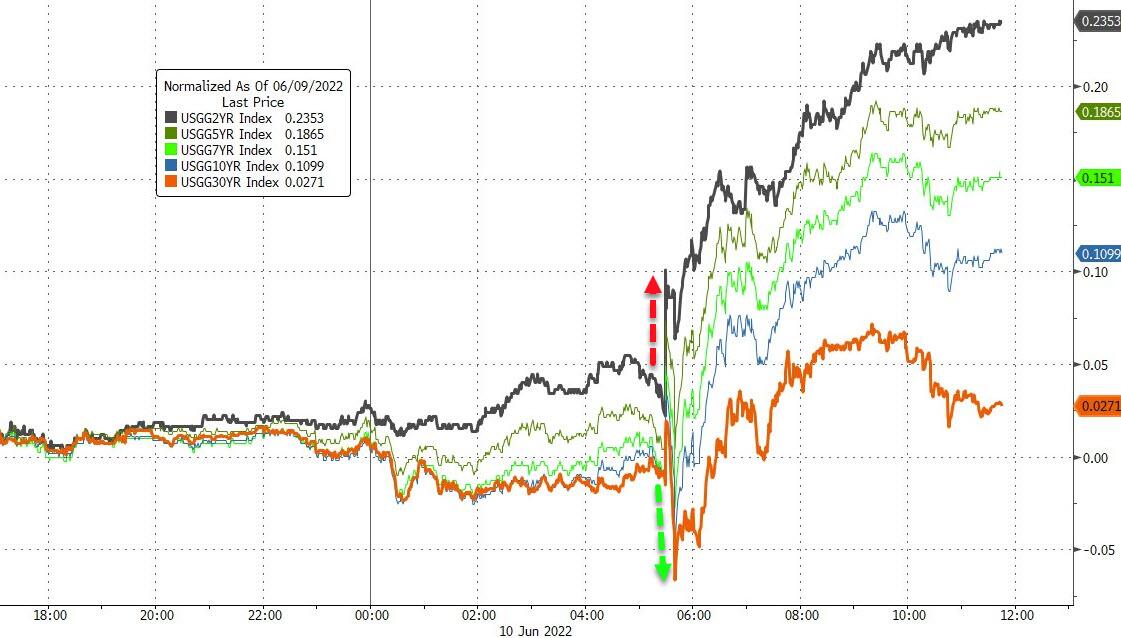
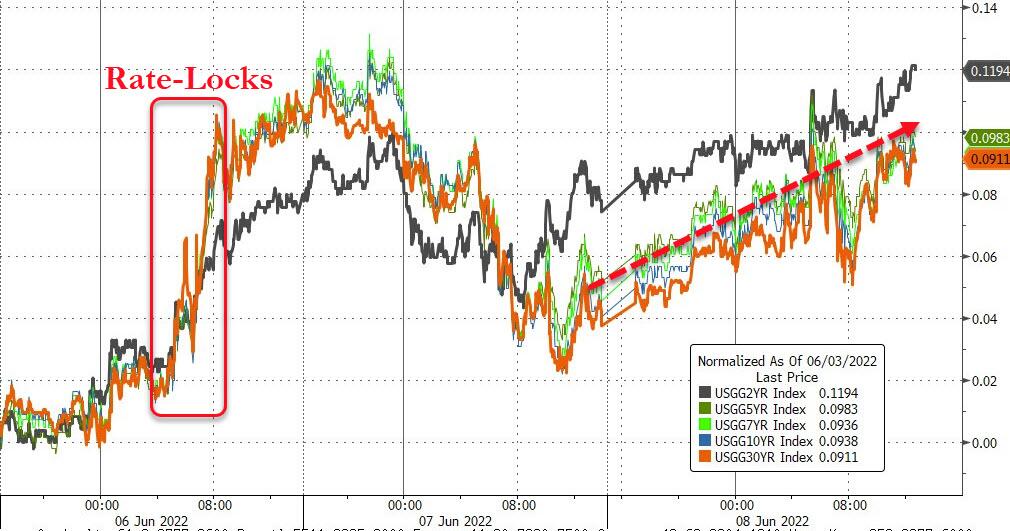
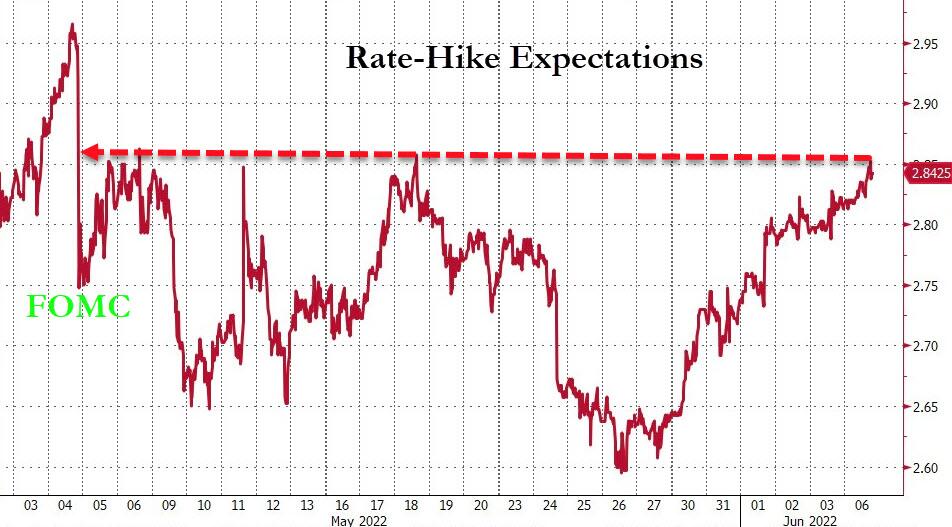
The US Macro Surprise Index followed suit and dipped to its weakest since 2019. The reactions in the markets were violent no matter where you looked, with rate-hike expectations and rate-cut expectations going opposite ways, as Bloomberg demonstrates in this chart.

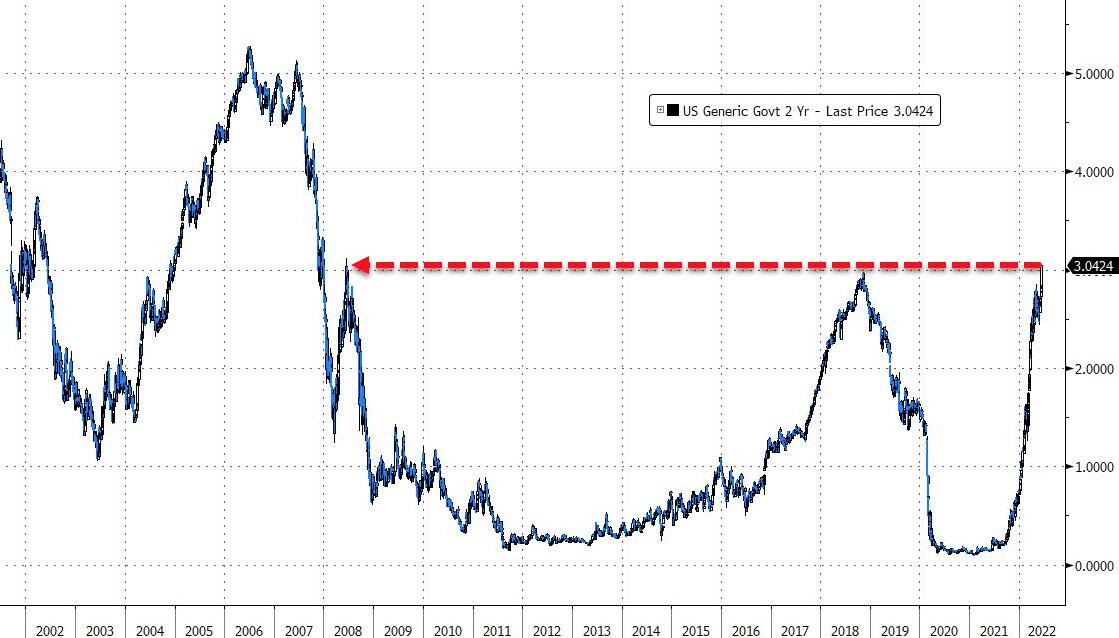
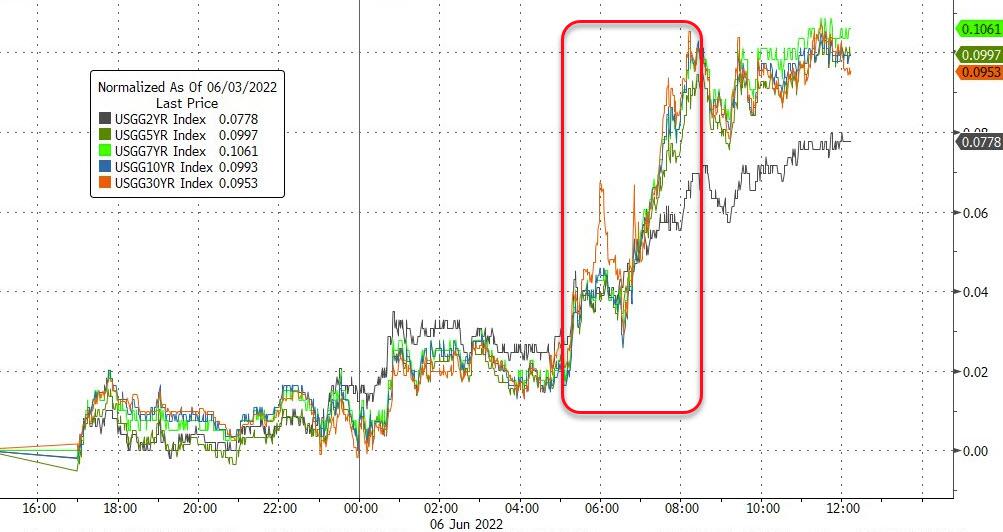
Bond markets were in turmoil due to yields spiking violently, with the 10-year adding over 11 basis points to close at 3.157%. For the week, it was simply a bloodbath, as the 2-year bond yield exploded by a stunning 40 basis points, and topping 3% for the first time since 2008, while the 30-year only gained 10 basis points.

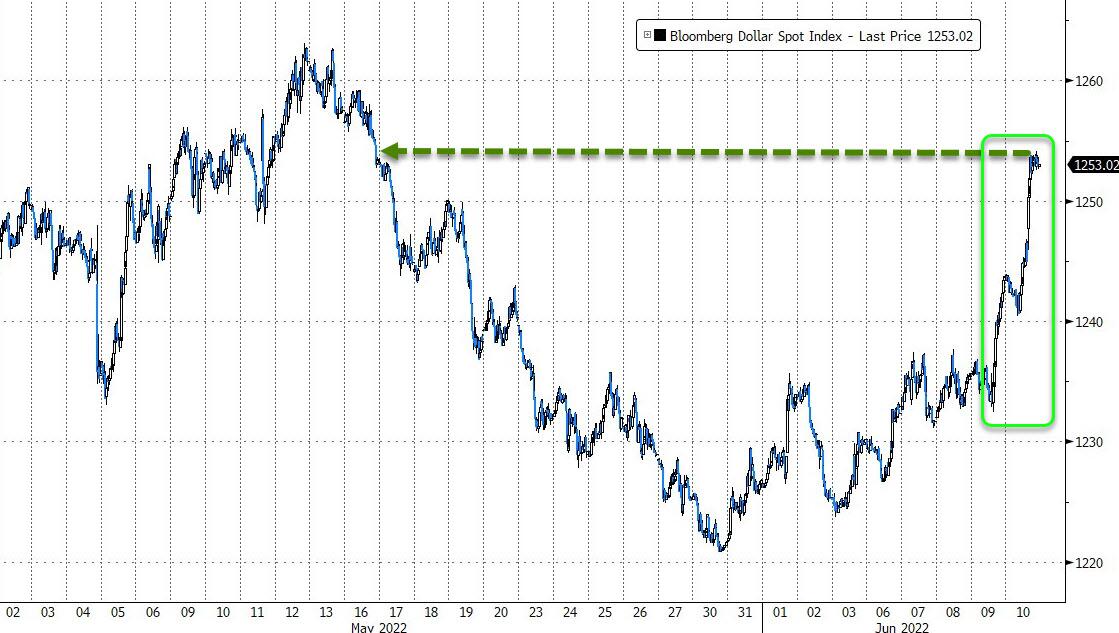
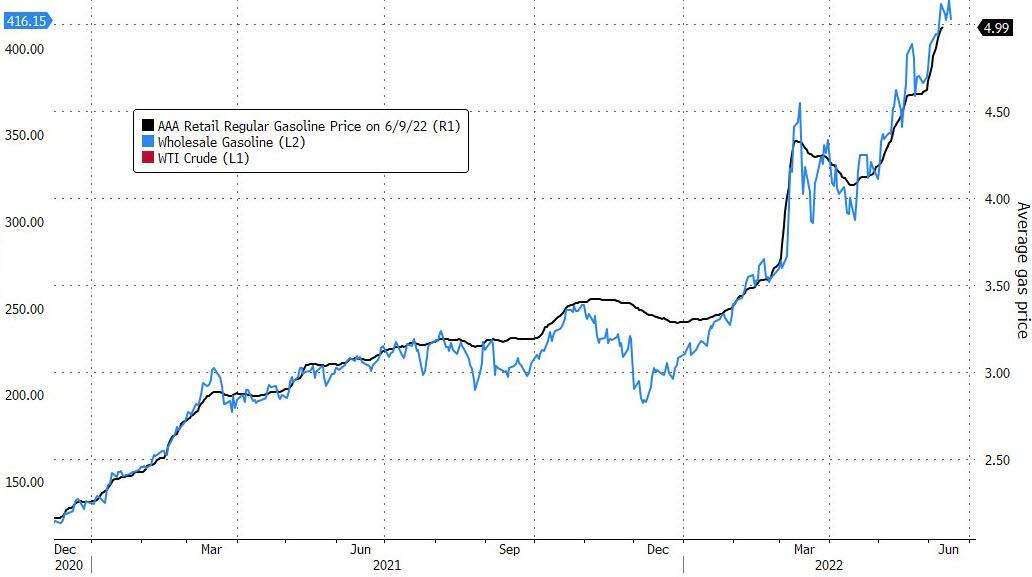
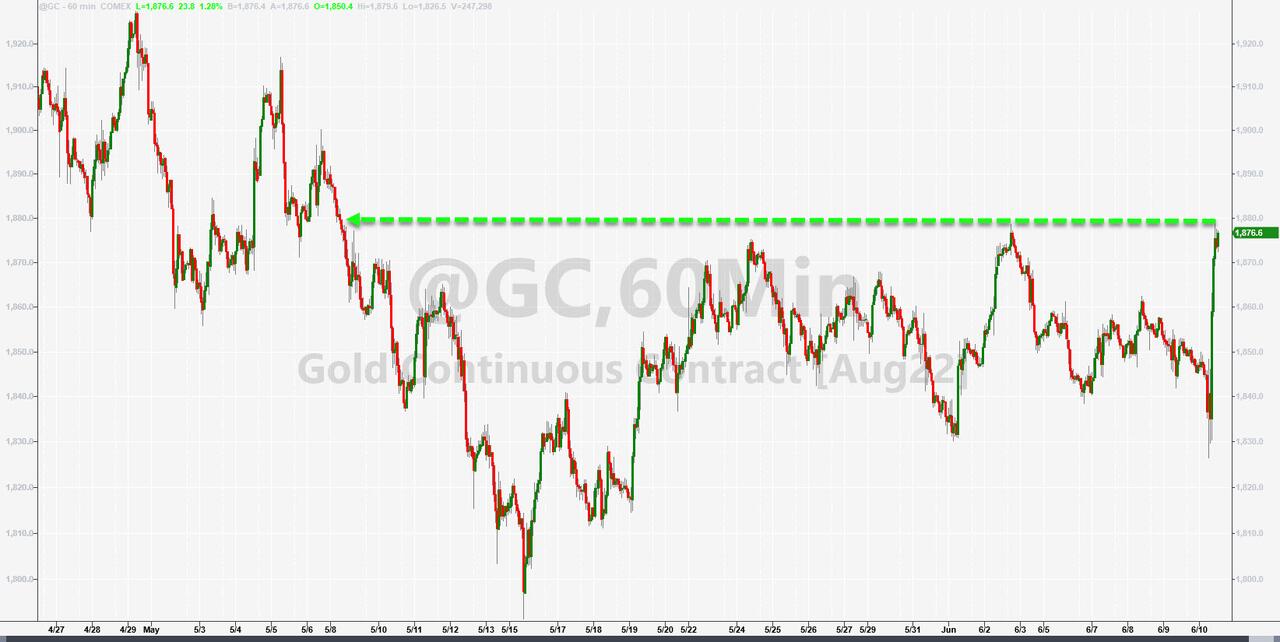
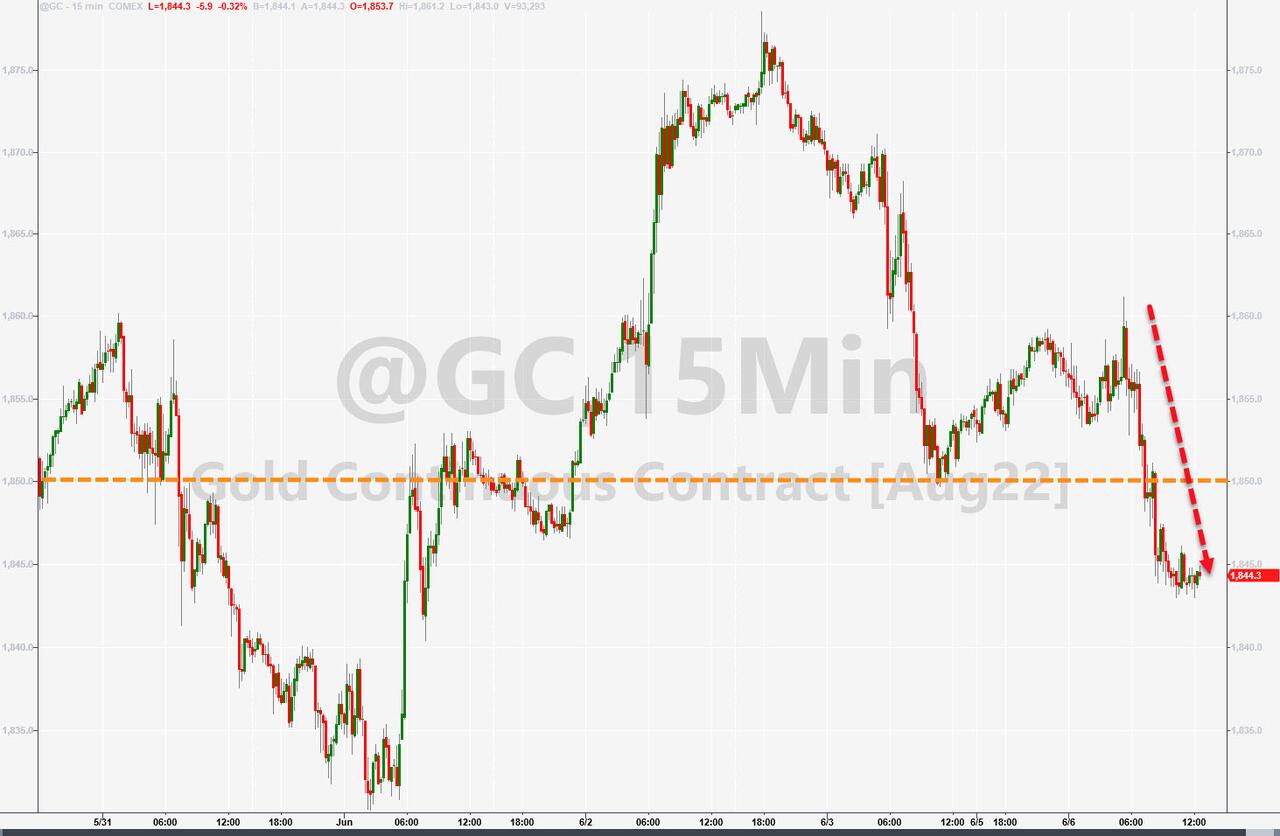
The US Dollar rallied, as did gasoline prices, while Gold was the safe place to be in the face of chaos, as the precious metal surged 1.23% on the day and easily reclaimed its $1,850 level.    

We ended the week, as ZH posted, with the S&P 500 and Nasdaq not only having their worst week since January 2021, but also witnessing the S&P 500 down 10 of the last 11 weeks—the worst stretch since the Great Depression.

Being in cash on the sidelines never felt so good.

Read More
Weekly StatSheet For The ETF Tracker Newsletter – Updated Through 06/09/2022

Ulli ETF StatSheet Contact

ETF Data updated through Thursday, June 9, 2022

Methodology/Use of this StatSheet:

1. From the universe of over 1,800 ETFs, I have selected only those with a trading volume of over $5 million per day (HV ETFs), so that liquidity and a small bid/ask spread are assured.

2. Trend Tracking Indexes (TTIs)

Buy or Sell decisions for Domestic and International ETFs (section 1 and 2), are made based on the respective TTI and its position either above or below its long-term M/A (Moving Average). A crossing of the trend line from below accompanied by some staying power above constitutes a “Buy” signal. Conversely, a clear break below the line constitutes a “Sell” signal. Additionally, I use an 12% trailing stop loss on all positions in these categories to control downside risk.

3. All other investment arenas do not have a TTI and should be traded based on the position of the individual ETF relative to its own respective trend line (%M/A). That’s why those signals are referred to as a “Selective Buy.” In other words, if an ETF crosses its own trendline to the upside, a “Buy” signal is generated. Here too, I recommend trailing sell stop of 12%, or less, depending on your risk tolerance.

If you are unfamiliar with some of the terminology, please see Glossary of Terms and new subscriber information in section 9.     

1. DOMESTIC EQUITY ETFs: SELL — since 02/24/2022

Click on chart to enlarge

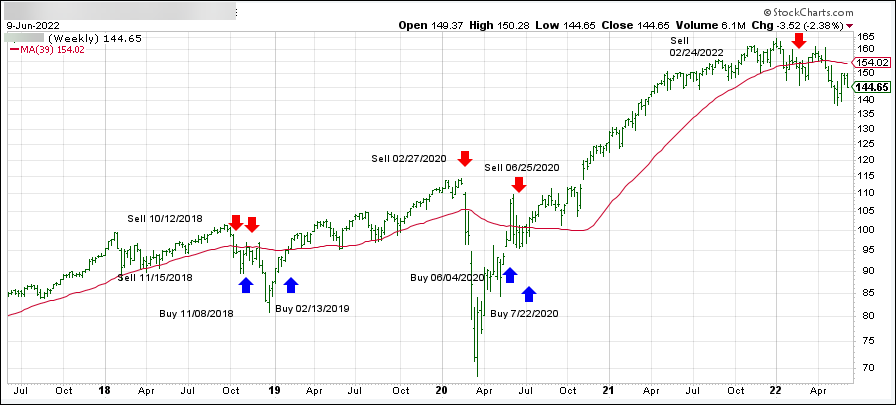
Our main directional indicator, the Domestic Trend Tracking Index (TTI-green line in the above chart) has broken below its long-term trend line (red) by -6.21% and remains in “SELL” mode.  

Read More

Bond Yields Pump And Stocks Slump

Ulli Market Commentary Contact

[Chart courtesy of MarketWatch.com]

  1. Moving the markets

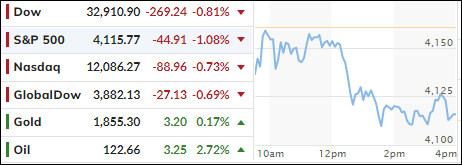
The roller coaster ride continued, as yesterday’s rebound vanished in a hurry, with the major indexes giving back more than they gained in the prior session. Bonds reversed Tuesday’s yield slippage with yields rising and the 10-year reclaiming its 3% level by closing at 3.03%.

Updates and warnings from major companies (Credit Suisse, Intel) contributed to equity weakness amid signs that economic growth is not what it was cracked up to be. In other words, we are slowing down with the Stagflation scenario becoming more real every day.

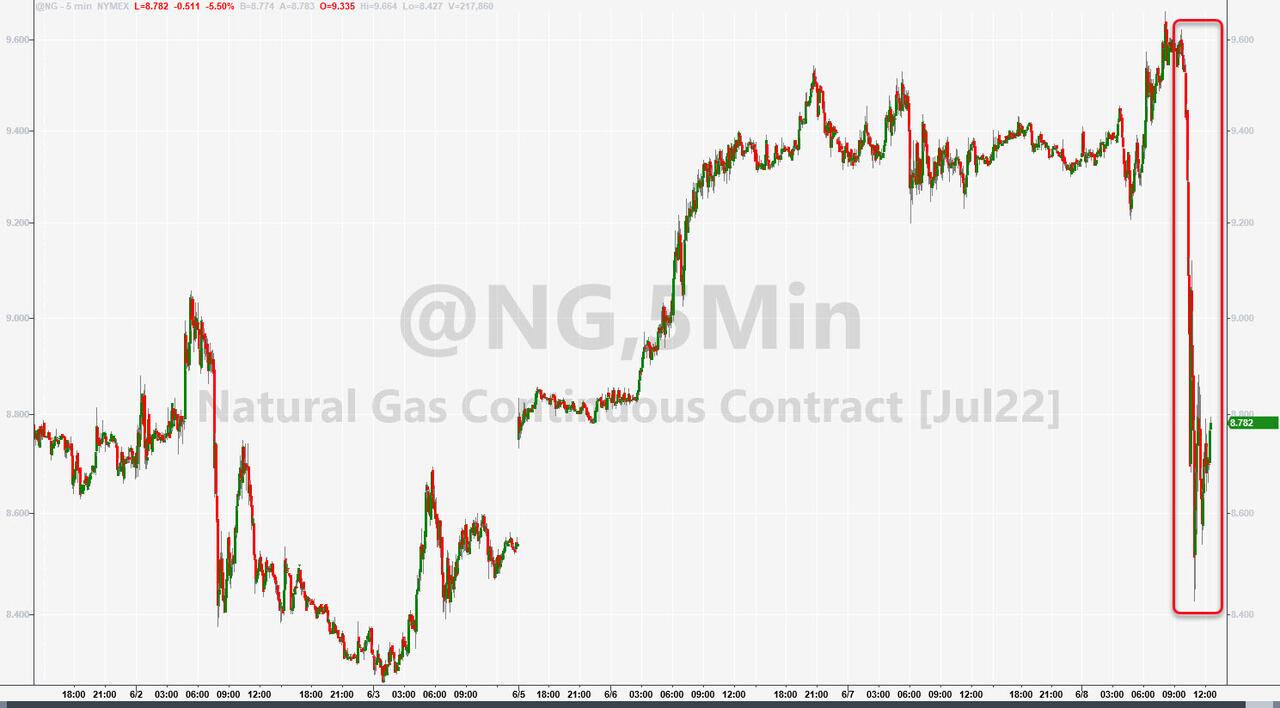
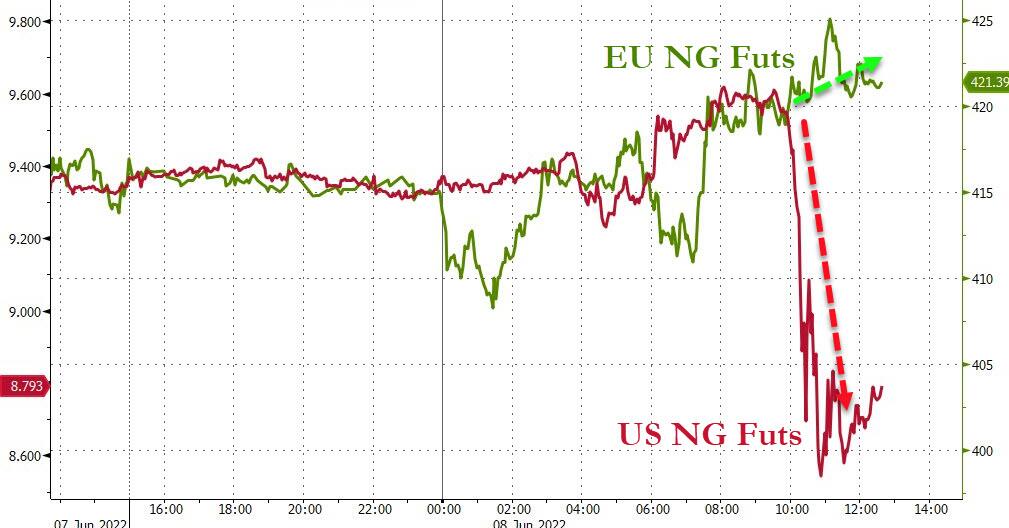
Things are starting to affect the housing market, because mortgage demand hit its lowest level in 22 years, as per the Mortgage Bankers Association. A rally in Crude Oil to over $122 only created more anxiety, but Natural Gas plunged due to a small terminal explosion. ZH explained that less exports means more domestic supply, hence the sell off. The reverse happened in Europe, as their supplies were cut and prices subsequently rose.

On deck for Friday is the highly anticipated CPI number for May. It’s reading could influence the path of Fed policy in terms of frequency (a potential pause) and magnitude (0.5% increments) and therefore affect market direction as well.

Read More

Shaking Off A Warning

Ulli Market Commentary Contact

[Chart courtesy of MarketWatch.com]

  1. Moving the markets

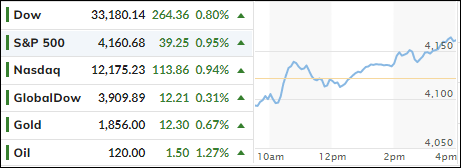
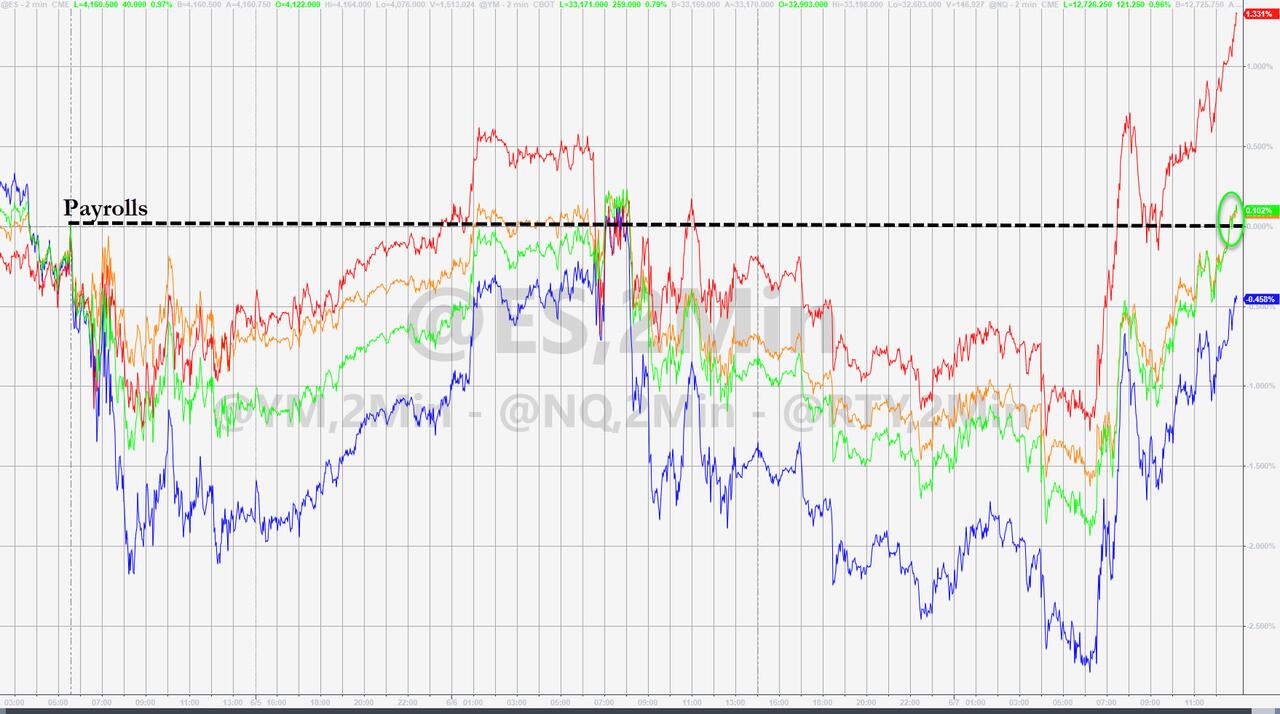
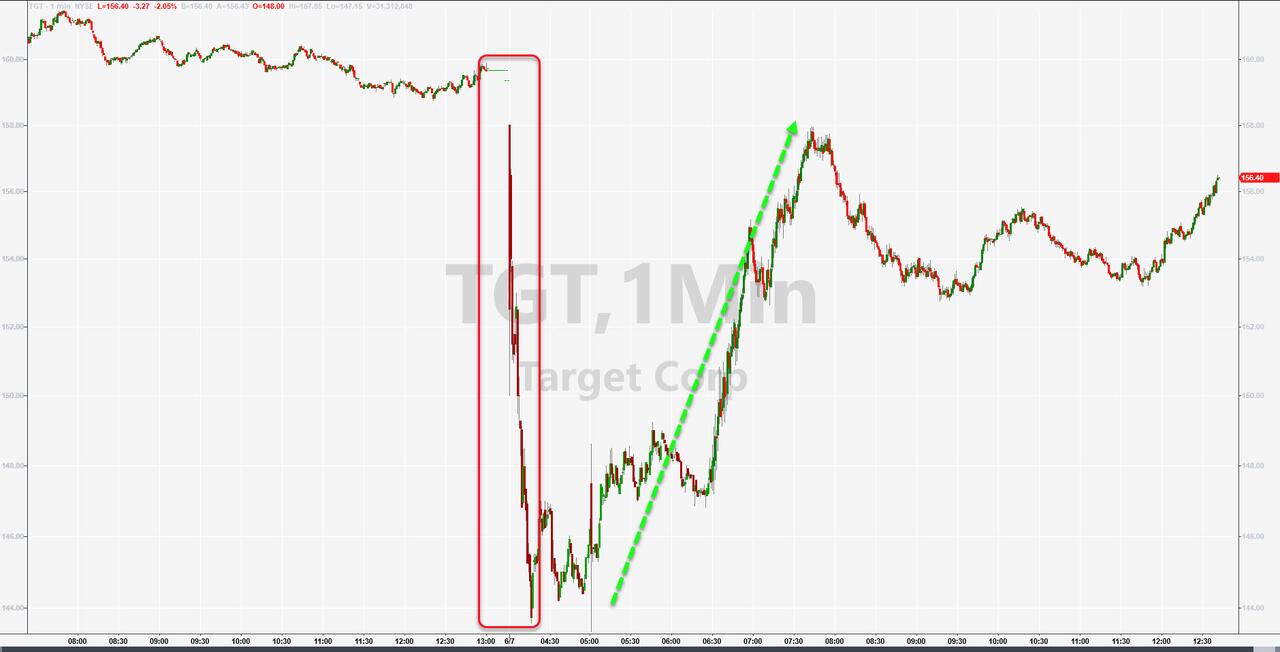
The major indexes were subdued early in the session, because Target’s profit warning sent equities into the red. After some bobbing and weaving, momentum turned positive, as dip buyers and a short squeeze combined forces to produce a green close to.

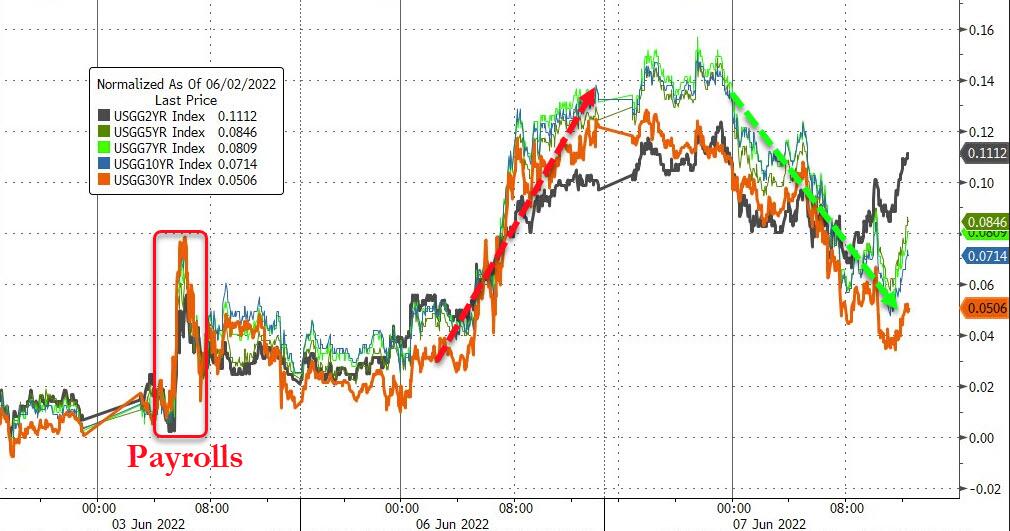
A big assist came from the bond market, after yields retreated with the 10-year losing 5.6 basis points and closing a tad below the much-feared 3% level. Any close above it appears to wreak havoc with equities, while any close below it supports bullish sentiment.

Traders are still anxiously debating whether the recent bounce is a bear market rally, or if we have seen the bottom of this year’s sell-off with a new bullish run now on deck. Personally, I think we may see a little more push to the upside, yet in limited fashion, after which new lows for the year will be made.

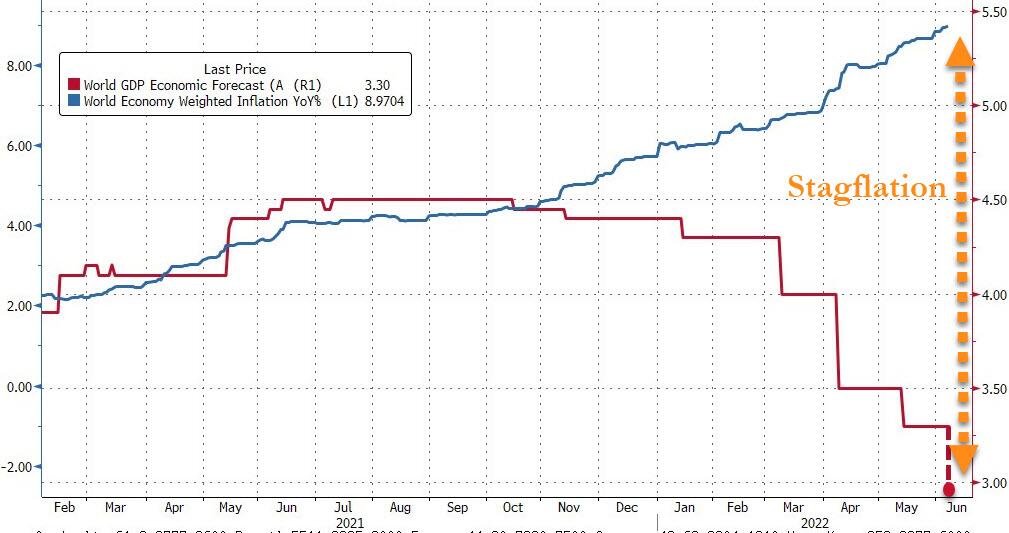
Econ data painted a different reality picture then that of equities. First, as ZH reported, the World Bank downgraded global economic growth and warned of stagflationary pressures building.

This was followed by the Atlanta Fed downgrading US economic growth to 0.9% from a 1.3% level just seven days ago. Way to go! Quipped ZeroHedge: Finally, today was a great day for buying stocks…   

Read More

Ripping And Dipping

Ulli Market Commentary Contact

[Chart courtesy of MarketWatch.com]

  1. Moving the markets

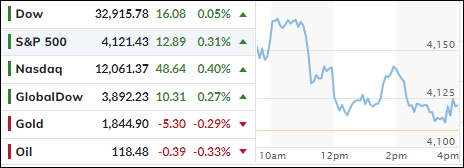
Another head fake session saw the Dow gaining over 300-points early on, but the rally quickly lost steam with the major indexes briefly dipping into the red, before a late push saved the day. The Dow settled at about unchanged, but the S&P 500 eked out a modest 0.31% advance.

The early boost was a result of China rolling back some of its Covid restriction, which traders interpreted as their economy returning to near capacity within a month. That should be a boon to the global economy and would hopefully ease the supply chain issues.

Still, uncertainty abounds that the Fed might raise interest rates too fast and too much creating a recession in the process. Well, you can’t have it both ways, as the Fed has only limited options. Either fight inflation fast and furious and risk a recession, or be too easy and watch hyper inflation create havoc. Take your poison.  

Rate hike expectations climbed to its highest level since the May Fed meeting with bond yields ripping higher, as the 10-year added over 10 basis points to recapture the 3% level to close at 3.045%.

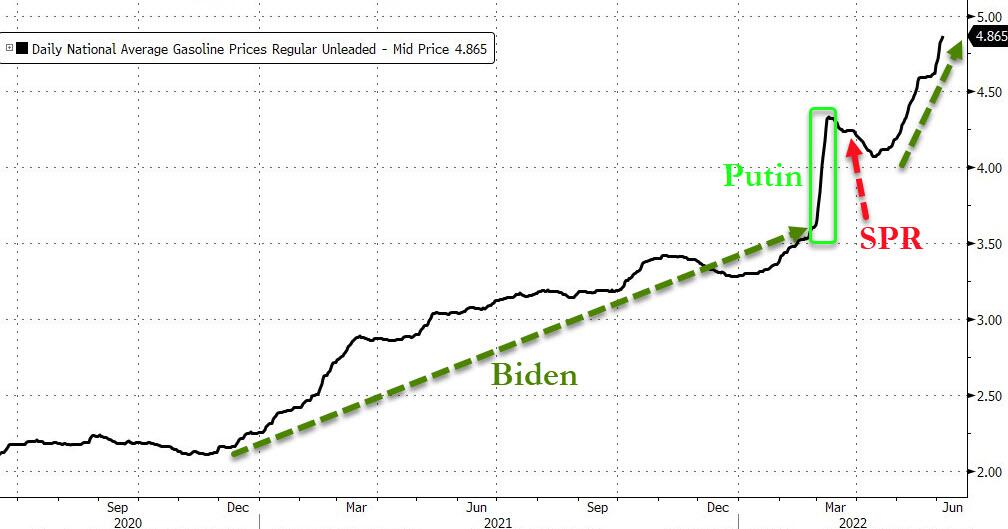
That helped the US Dollar to reverse its downtrend and wipe out early losses. Gold dropped on dollar strength and gave back its $1,850 level in the process. Unfortunately, gasoline prices hit another record high, as ZH reported, which appears to be now an almost daily occurrence.   

Read More

ETFs On The Cutline – Updated Through 06/03/2022

Ulli ETFs on the Cutline Contact

Below, please find the latest High-Volume ETF Cutline report, which shows how far above or below their respective long-term trend lines (39-week SMA) my currently tracked ETFs are positioned.

This report covers the HV ETF Master List from Thursday’s StatSheet and includes 312 High Volume ETFs, defined as those with an average daily volume of more than $5 million, of which currently 61 (last week 69) are hovering in bullish territory. The yellow line separates those ETFs that are positioned above their trend line (%M/A) from those that have dropped below it.

Take a look:                                                                   

The HV ETF Master Cutline Report

In case you are not familiar with some of the terminology used in the reports, please read the Glossary of Terms. If you missed the original post about the Cutline approach, you can read it here.