
- Moving the markets
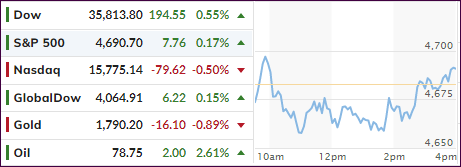
Market stress made itself felt again with the Nasdaq getting hammered early on, but the index managed to cut its losses and only surrendered 0.50%, though the Dow and S&P 500 eked out some moderate gains.
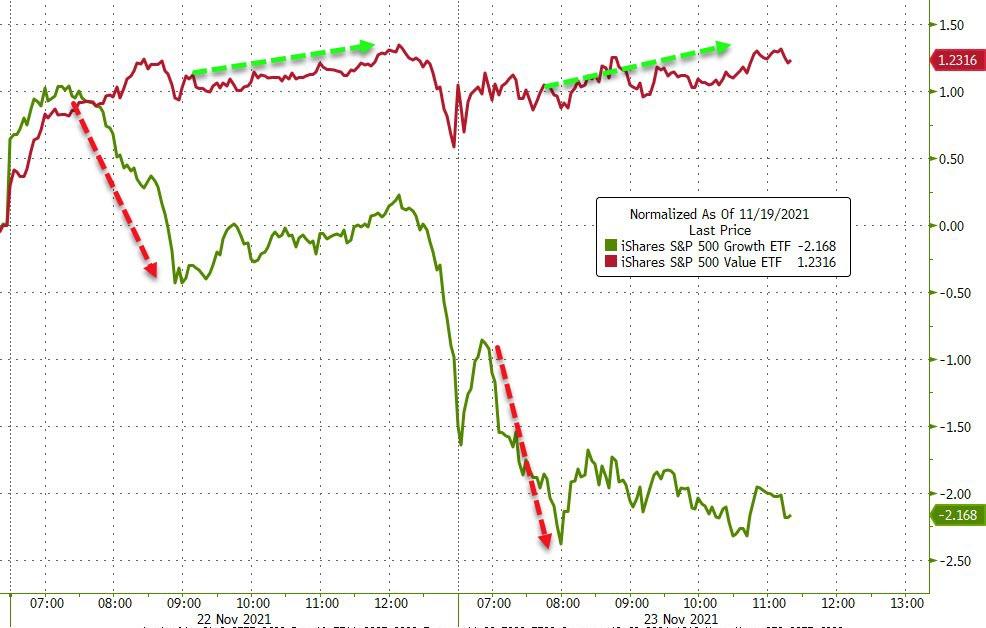
Rising rates continued to put strain on the tech segment, although financials again benefitted with XLF adding 1.47% confirming a divided market today. The tech and growth sector have come under selling pressure due to the renomination of Powell as Fed chair, as he tends to represent more hawkishness than his competing counterpart Brainard, who is known to be more dovish.
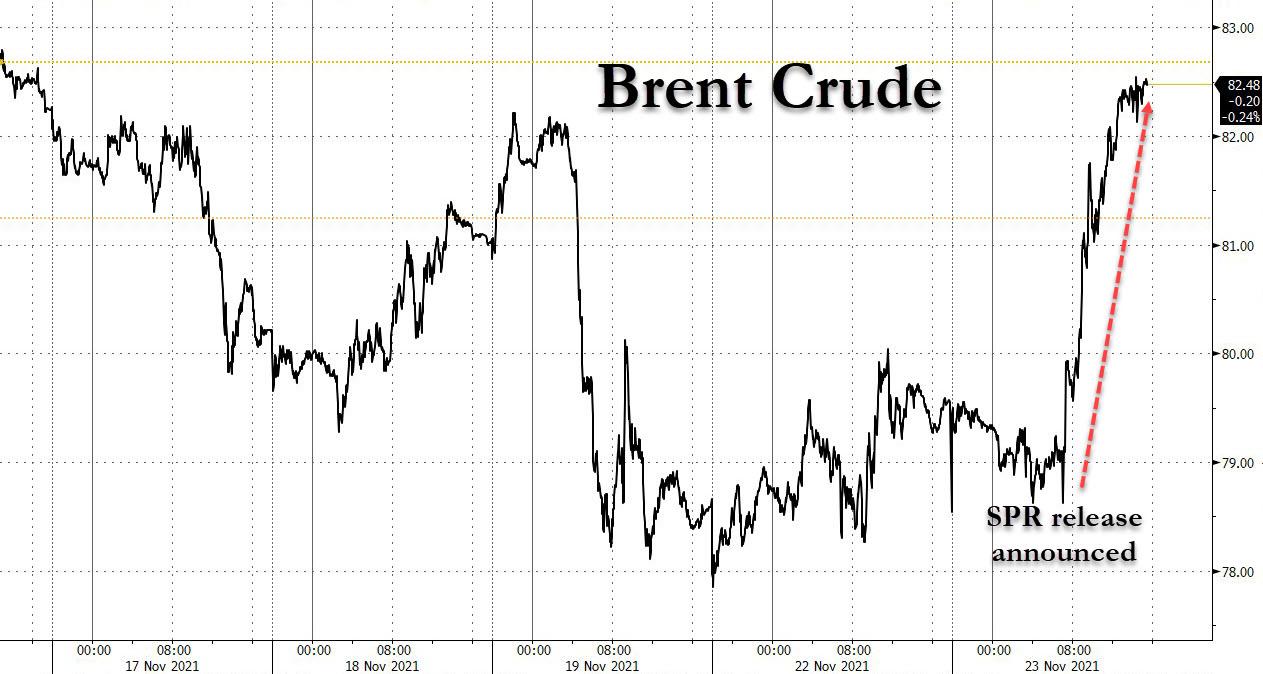
The joke of the day was Biden’s announcement of tapping into the Strategic Petroleum Reserve (SPR) to take pressure of constantly rising energy prices with the idea that this action would lower them. Apparently, the markets did not get the memo, as crude oil did exactly the opposite, namely spike sharply.
ZeroHedge called it this way:
And most notably, his actions today, sending prices for crude higher, will negate the impact of the drop in crude and wholesale gasoline prices that would bring pump prices lower. Simply put, the president is lying when he talks about retailers gouging – and given his lack of actual business experience, seems to have no idea how the supply chain from crude to gasoline works…
Ouch!
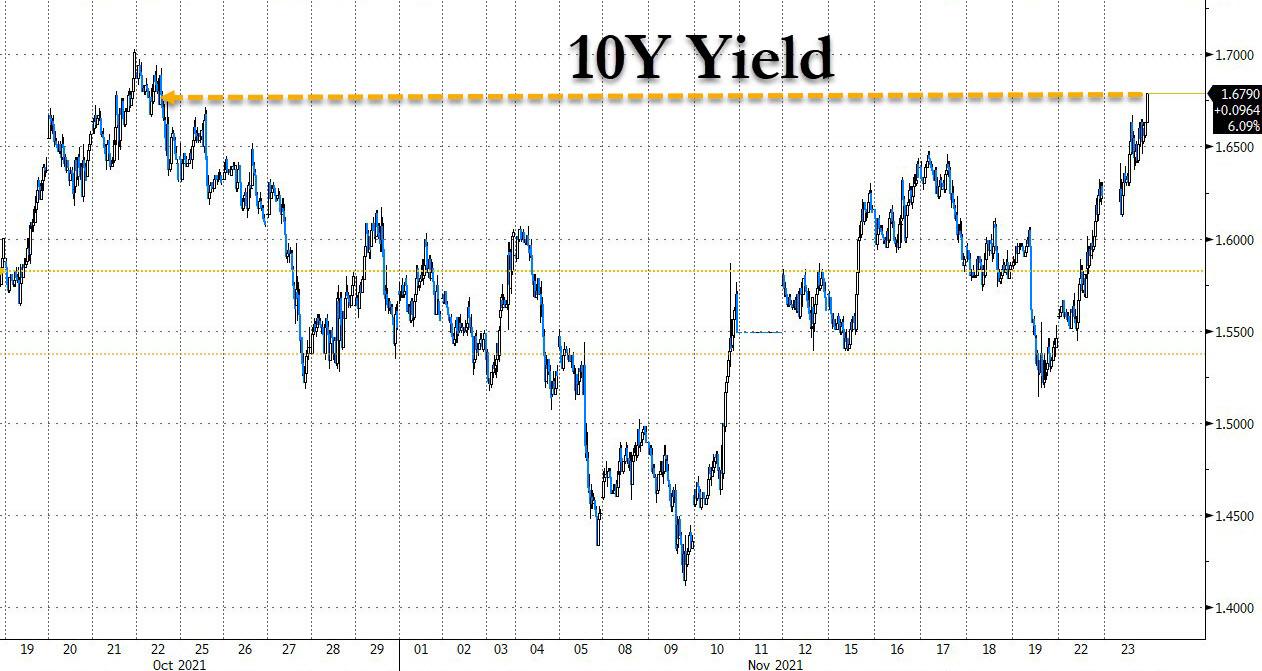
The 10-year bond yield catapulted higher by 14 basis points to end the day at 1.678%, a number last seen in October 2020. Therefore, just as yesterday, the US Dollar followed suit and is now heading towards its recent high set in September 2020.
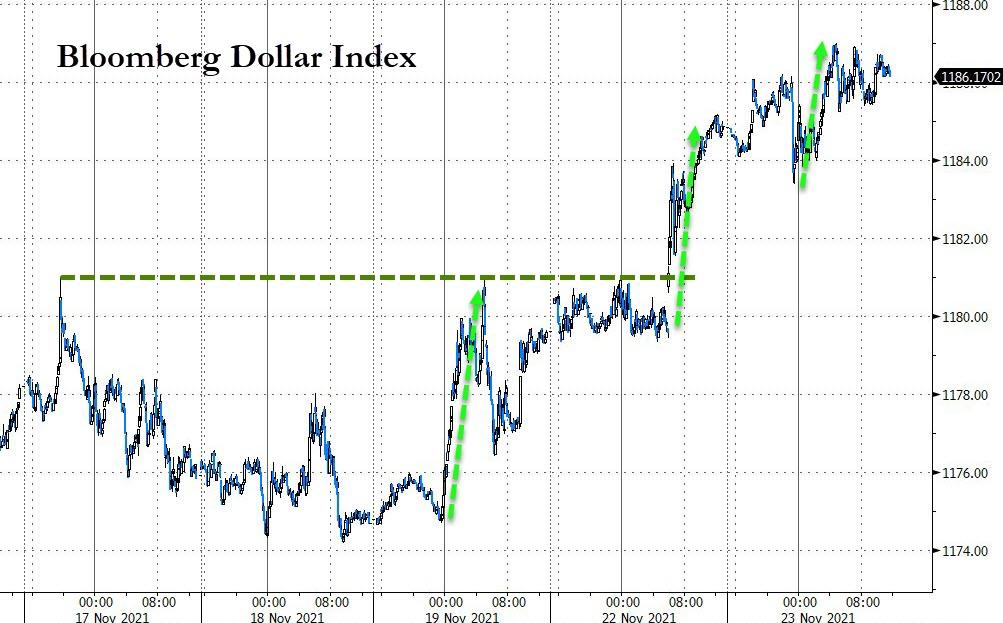
That type of action pulled the rug out from under gold’s recent rally with the precious metal giving up 0.9% and, in the process, losing its $1,800 level—again.
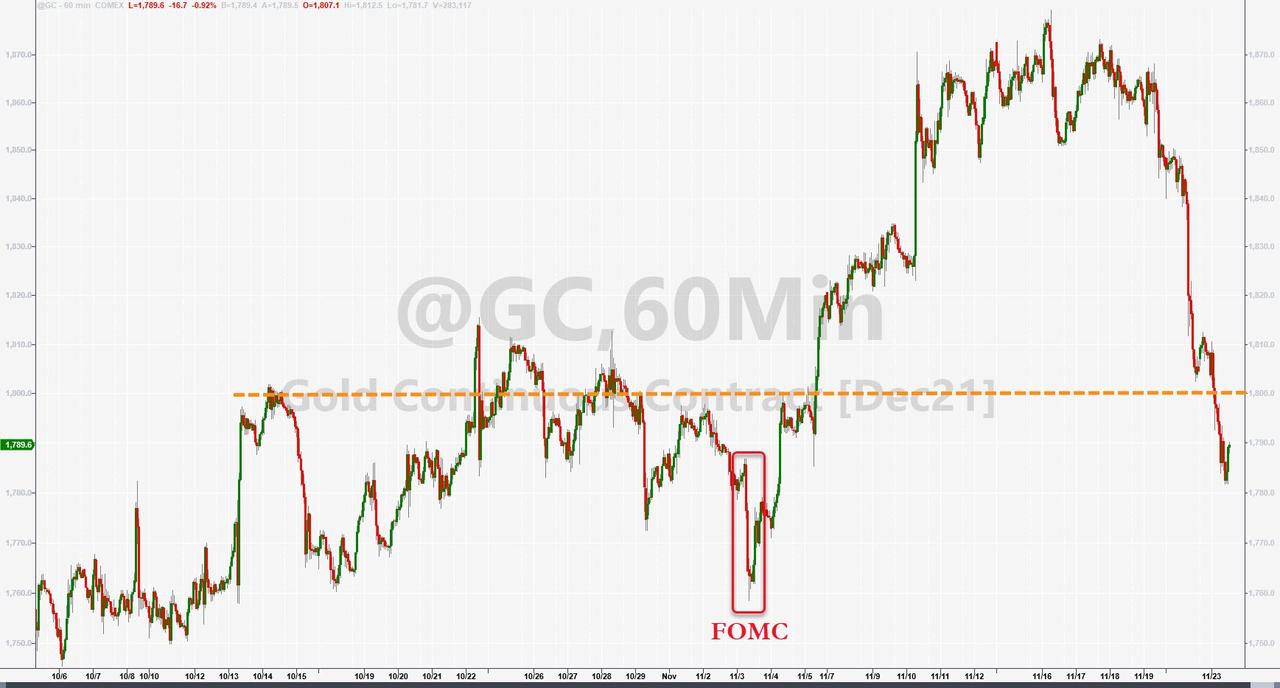
2. ETFs in the Spotlight
In case you missed the announcement and description of this section, you can read it here again.
It features some of the 10 broadly diversified domestic and sector ETFs from my HighVolume list as posted every Saturday. Furthermore, they are screened for the lowest MaxDD% number meaning they have been showing better resistance to temporary sell offs than all others over the past year.
The below table simply demonstrates the magnitude with which these ETFs are fluctuating above or below their respective individual trend lines (%+/-M/A). A break below, represented by a negative number, shows weakness, while a break above, represented by a positive percentage, shows strength.
For hundreds of ETF choices, be sure to reference Thursday’s StatSheet.
For this current domestic “Buy” cycle, here’s how some our candidates have fared:
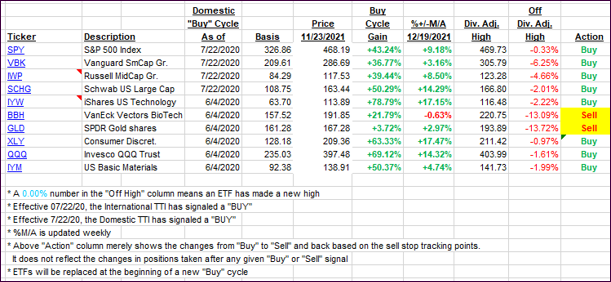
Click image to enlarge.
Again, the %+/-M/A column above shows the position of the various ETFs in relation to their respective long-term trend lines, while the trailing sell stops are being tracked in the “Off High” column. The “Action” column will signal a “Sell” once the -8% point has been taken out in the “Off High” column. For more volatile sector ETFs, the trigger point is -10%.
3. Trend Tracking Indexes (TTIs)
Our TTIs edged higher despite another roller coaster day in the markets.
This is how we closed 11/23/2021:
Domestic TTI: +6.85% above its M/A (prior close +6.41%)—Buy signal effective 07/22/2020.
International TTI: +1.89% above its M/A (prior close +1.66%)—Buy signal effective 07/22/2020.
Disclosure: I am obliged to inform you that I, as well as my advisory clients, own some of the ETFs listed in the above table. Furthermore, they do not represent a specific investment recommendation for you, they merely show which ETFs from the universe I track are falling within the specified guidelines.
All linked charts above are courtesy of Bloomberg via ZeroHedge.
Contact Ulli